Featured
Stock Markets Have Definitely Seen Better Days
It has been the worst start since 1939. Yes, we have to go back that far to find a year off to a worse start then 2022. Then the crypto market crashed. Well one, Terra Luna, a crypto that literally vaporized overnight wiping out $40 billion in a heartbeat. Our chart of the week looks at the stunning collapse of Terra Luna.

It has been difficult finding good news. And even if one does, it doesn’t mean markets will rally. Markets have been selling on both good news and bad news. Since the markets topped on January 4, 2022, it has been a steady diet of bad news that has sent markets tumbling. Sharply rising inflation, war between Ukraine/Russia/U.S., lockdowns in China because of the Omicron COVID, all leading to global supply disruptions that were already going on because of the COVID pandemic since March 2020.
So far, 2022 is off to its worst start since 1939. Hard to believe. Ironically, the market topped that year on January 4 just like it did this year. Since the beginning of the year the S&P 500 is down 15.6%. In 1939, the S&P 500 was down 14.7% by Friday May 12. January 4, 1939 was not the final high for 1939 as the market recovered and eventually topped in October 1939 just after World War II was underway. The late 1930s’ top was actually seen back in March 1937 and the final bottom of the 1937–1942 bear market did not occur until April 1942. The period saw a series of ups and downs with the final low occurring 60% below the March 1937 top. Against the backdrop of war and inflation, could a similar bear market be underway?

Inflation is not going away anytime soon. This week the U.S. inflation numbers were released and, while they came in marginally better than expected, they remain abnormally high, at levels not seen since the 1970s. Transitory is no longer a word associated with inflation. CPI is up 8.3% year-over-year (y-o-y) and PPI is up 11.0% y-o-y. If one used the finished goods PPI instead of the final demand PPI which is the one reported, the y-o-y rise was 15.6%, the highest level seen in 47 years. Compare that to the U.S. 10-year treasury note, currently trading around 2.90% and the effective Fed Funds rate of 1.0% following the 50 bp hike at the recent FOMC. Some are expecting another 50 bp at the June 14–15 FOMC with talks of 75 bp. Another 50 bp is being targeted for the July 26–27 FOMC.
Canada releases their inflation numbers next week and they are expected to remain high. As to Canadian interest rates? They are expected to follow the U.S. and more recently the BofC led the Fed. But narrowing the gap between interest rates and the current levels of inflation is potentially dangerous for the economy. With mortgage rates already rising, we are now witnessing the early stages of what could become a housing crash.
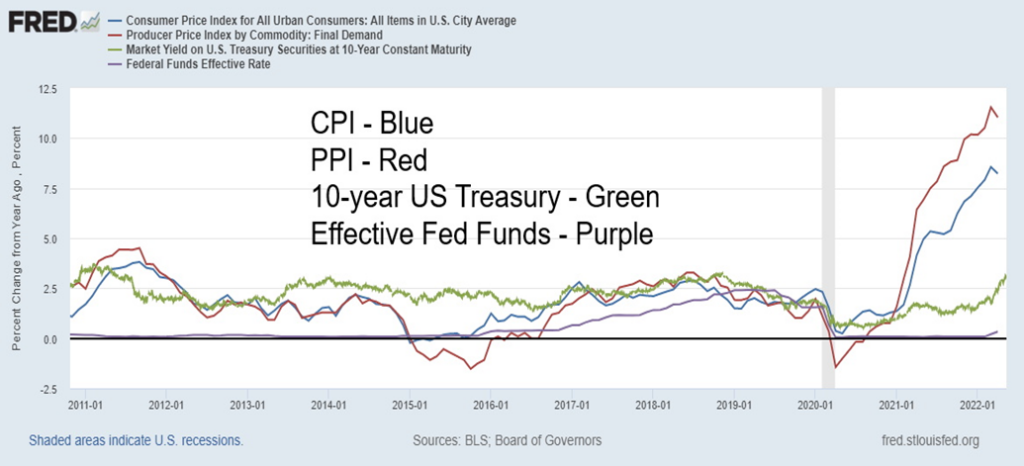
To bring down high inflation in the 1970s, the Fed hiked the Fed rate to almost 20%. At the time the high inflation rates—sparked by, first, the Arab oil embargo of 1973 when oil prices were quadrupled by OPEC and, second, by the Iranian revolution of 1979–1980 that caused oil prices to soar once again—resulted in the steepest recessions since the Great Depression in both 1973–1975 and 1980–1982. This time it is against the backdrop of the war in Ukraine, coupled with sanctions on Russia, that have helped spike oil prices to the highest levels since 2011. Russia is the world’s third largest oil producer and holds the world eighth largest oil reserves. For natural gas (NG), Russia is the world’s second largest producer and holds the world’s largest reserves.
Sharply rising inflation is causing political problems. Gasoline prices at the pump are soaring with the average U.S. price over $4.50/U.S. gallon. Diesel fuel, primarily needed by the trucking industry, is soaring even higher. In some places such as California, gas at the pump is upwards of $6/U.S. gallon. In Canada, prices were roughly the equivalent of $6.10/U.S. gallon. The global average is currently around $5.10/U.S. gallon. High inflation is causing President Biden’s support to fall and the Democrats to be at risk of losing control of both Congress and the Senate at the November elections. It is also raising talk of price controls. Price controls were used in the 1970s to combat inflation and the effect is to cause more dislocations and shortages.
But is the war in Ukraine likely to end any time soon? Even if it ended tomorrow, the sanctions would remain. Instead, the war appears as if it will be prolonged and escalated. As some have stated, the world is at the most critical juncture since the Cuban Missile Crisis of 1962. In 1962 President Kennedy tried to dampen down the conflict and following thirteen tense days the crisis ended peacefully with both sides compromising. Today, they are instead ramping it up. In March 1941 President Roosevelt signed what was a Lend-Lease Act that effectively allowed the U.S. to supply arms to the United Kingdom to assist them in the war effort. This allowed the U.S. to circumvent Neutrality Acts passed in the 1930s. The U.S. was in effect no longer neutral and, while it wasn’t formally announced, the U.S. was now at war with Germany and Japan long before the December 7, 1941 attack on Pearl Harbour.
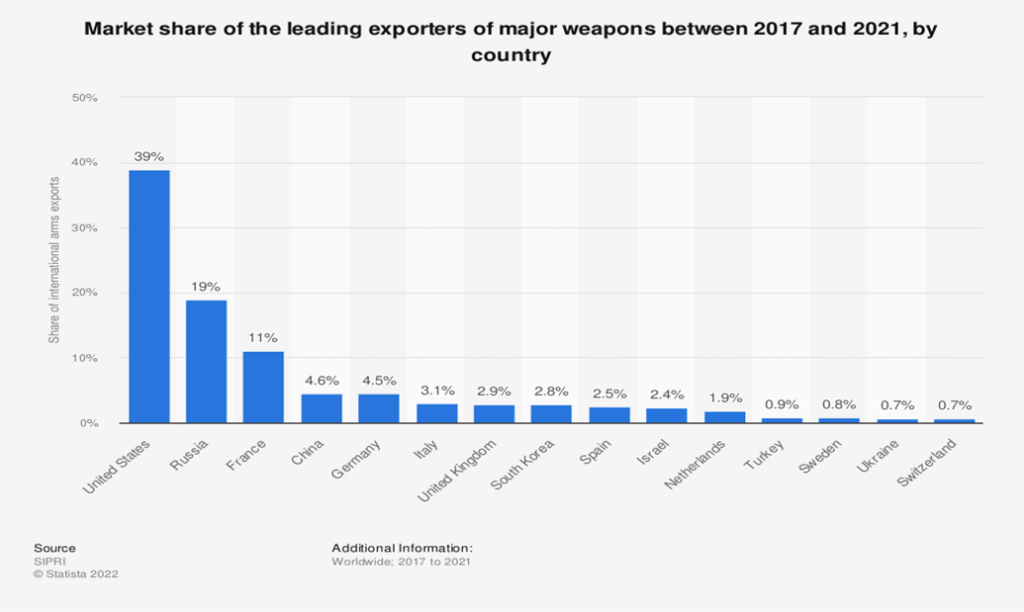
Today, instead, it is a modern-day version of the Lend-Lease whereby by a vote of 471–10 Congress has approved a bill to supply upwards of $33 billion in additional funding for Ukraine, including $20 billion in arms, $8.5 billion in economic assistance, and $3 billion in humanitarian and food security aid. As some note, this is a significant escalation in the war and, while U.S. troops are not on the ground, the U.S. is effectively at war with Russia just as the U.S. was effectively at war with Germany and Japan back in 1941 before the U.S. officially entered the war. The bill still has to clear the Senate where it may run into some opposition. The U.S., not surprisingly, is the world’s largest exporter of weapons followed by Russia and France. Arms manufacturers are significant donors to both the Democrats and Republicans and are a key component of the U.S. economy. Aerospace and defense companies employ almost 2 million people. The U.S. Department of Defense (DOD) employs some 3.2 million or 1% of the U.S. workforce. That number includes at least 700,000 civilians.
If the threat of nuclear war isn’t enough, there remains the threat of food shortages and famine. Russia and Ukraine supply some 25%–30% of the world’s grains: wheat, barley, corn. That’s a huge percentage of the world’s grain supplies. The major importers of Russian/Ukrainian grains are countries in the Middle East and Africa where countries like Egypt, Lebanon, Jordan, Somalia, Sudan, and Kenya are provided upwards of 70% to 100% of their needs. The countries at risk hold over 700 million people or 10% of the world’s population.
Add the woes of growing droughts, brought on by climate change as some say, although the world has gone through major cycles of droughts historically. Historic droughts were seen in the U.S. during the 1950s, 1930s, 1860s, and 1810s, each lasting roughly 6.5 years. Major periods of droughts have led to the collapse of civilizations. Major drought collapses that led to the collapse of civilizations include the Akkadian Empire and the Old Kingdom of Ancient Egypt 2334 BC–2193 BC, the Mayan civilization in Mexico 250–900 AD, the Tang Dynasty China 700–900 AD, the Khmer Empire in Cambodia 802–1431 AD, and the Puebloan culture of Southwest U.S. in the 11th–12th centuries.
Major droughts of varying degrees are being experienced in the Southwest U.S., particularly California. However, they also encompass most of the U.S. West and extend into Mexico, the Canadian Prairies and much of the Canadian West, Brazil, and extending down into northwest Argentina, all across central Africa encompassing upwards of a dozen countries, parts of the Middle East into Iraq, India, north-west and central Australia, and large parts of China in the central region and to the north. Major grain producers like the U.S., Canada, and Australia are already experiencing droughts themselves and also consume most of what they produce. They are not in a position to replace Ukraine/Russia grains.
Upwards of 50 million people are at risk of famine and the number could climb sharply. The World Food Programme (www.wfp.org) estimates that over 800 million people—10% of the global population—are at risk of severe malnutrition, including the 50 million at risk of famine and starvation. Upwards of 1.2 billion people, 15% of the global population, are at risk of displacement by 2050 due to climate change, natural disasters, and war. Today’s totals of refugees are as high as they have ever been. The estimated death toll from famine would far exceed the death toll of the war between Ukraine/Russia. As well, it is pushing up food prices globally. Price controls? As we noted, that would probably exacerbate shortages. We repeat a chart we have shown before of the historic rise in the U.N. World Food Price Index that is now at its highest level in thirty years.
U.N. World Food Price Index

The other elephant in the room is debt. Globally, debt has grown to an astounding $303 trillion, thanks to a sharp increase in emerging market debt and China debt in the past year. That’s more than double what global debt was back in 2008 during the financial crisis. The report from the Institute of International Finance (www.iif.com) showed that the bulk of the debt increase in the past year came from emerging markets (EMs) and was, fortunately for them, predominantly in local currencies. But a large amount was also denominated in U.S. dollars. With the U.S. dollar rising sharply against not only major currencies but also against EMs, the ability to repay these loans could become severely compromised. Surprisingly, Russia continues to find a way to pay its debt despite sanctions against them and the U.S. preventing Russian banks from using SWIFT and effectively holding hostage over half of Russia’s international reserves. As a result, trust in SWIFT and holding international reserves in U.S dollars, in particular, is coming under scrutiny.
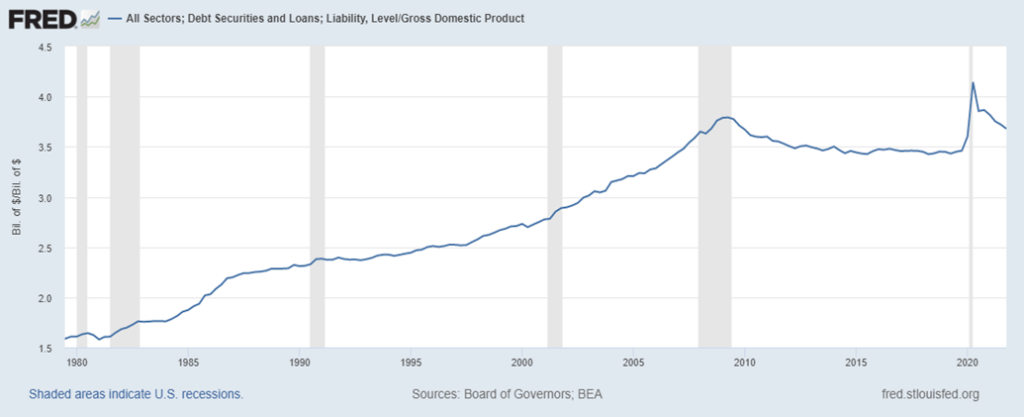
Debt has also risen sharply in the U.S., with debt for all sectors (government, corporate-financial and non-financial, household) now standing at $90.5 trillion. U.S. Federal debt is one-third of that while household debt represents 25%. Overall, that is an 80% increase since 2008.
Global debt to GDP stands at around 350% up from 215% back in 2015 while U.S. debt to U.S. GDP stands at 367%. Notice how the total debt/GDP started climbing in the 1980s coming out of the severe 1980–1982 recession. While recently it has eased somewhat thanks to more robust GDP growth, if GDP growth falters the debt is not going away. Rising interest rates could put pressure on the debt and expose weaknesses and possible defaults.

U.S. All Sector Debt as a percent of GDP
And we wonder why markets everywhere are off to their worst start in 83 years. Inflation, war, and the lingering effects of the pandemic and major supply-chain disruptions are the primary causes. And against that backdrop debt has soared. None of that is about to change anytime soon, even if a sharp rebound develops in an oversold market. A relief rally into the summer remains quite possible. However, the next few years and possibly longer are not going to be particularly easy. Everywhere we are either seeing cracks in the market (housing) or even outright collapses (cryptos). The question becomes, how long can the economy hold up given all the cracks that are appearing?
There is not much joy out there but one area that has held up, although well down from its high, is gold and to a lesser extent gold stocks. Much is written about how gold has a history of holding its value and that it’s a hedge against inflation, deflation, geopolitical uncertainty, and falling currencies. Holding gold is a portfolio diversifier and is generally negatively correlated to both stocks and bonds. Holding gold in a portfolio also helps to lower volatility. Since the beginning of 2022 both gold and gold stocks have held up comparably well to both the stock and bond markets.

It’s the tale of the tape 2022 to date: Gold -1.1%, TSX Gold Index (TGD) +0.5%, S&P 500 -15.6%, 10-year U.S. Treasuries -8.9%, TSX -5.3%, TSX Financials (TFS) -8.0%, WTI Oil +46.9%, NASDAQ -24.5%, NY FANG Index -32.0%, Bitcoin -35.0%. And the winner to date is WTI Oil, up 46.9%. But how does one own a barrel of oil? While major indices and the cryptos are all in the red in 2022, gold and gold stocks (TGD) are basically flat. For gold, that’s a win. Got gold?
Chart of the Week

Blaargh! Blech! Gack!
Those are the sounds one hears when something collapses 98% overnight. Maybe we should add splat or thud as well. On April 5, 2022 Terra Luna, a crypto blockchain protocol that uses fiat-pegged stablecoins to power price-stable global payments systems pegged to the U.S. dollar, hit a maximum market cap of $41.7 billion. Luna has some 35.2 billion coins outstanding. Then the peg collapsed and so did Luna. It last had a market cap around $45.6 million (some are now saying $0)—a stunning loss of almost 100% overnight. Millionaires who owned Luna were turned into paupers. Some lost their life savings. Some are facing homelessness as they are about to lose their home, having mortgaged the house to buy Luna. No word yet of anyone leaping out of high rises but that could follow. At one point Luna was in the top ten of cryptos.
For more on this, see https://www.cnbc.com/2022/05/13/cryptocurrency-luna-crashes-to-0-as-ust-falls-from-peg-bitcoin-rises.html.
The entire crypto market followed, with Bitcoin—the “Big Daddy” of the crypto market—falling almost 25% over the past week to fresh 52-week lows even as it rebounded at the end of the week. Bitcoin itself is down 56% from its all-time high seen in November 2021. Our old friend Dogecoin is down 44% since late April and down 87% from its all-time high seen a year ago in May 2021. Luna was advertised as a stablecoin. It is not looking so stable any more, nor, for that matter, is the entire crypto market. Protection against inflation as some claim? Not so much. This crash instead causes massive deflation.
Crypto was very popular with millennials trading on platforms such as Coinbase, Binance, and Gemini and discussed exhaustively on social media sites like Reddit. Robinhood (HOOD/NASDAQ) was another platform popular for trading stocks and cryptos. But the losses have been horrendous. The market cap of all cryptos has collapsed 55% since last November. Oh, they are still trying to save Luna with re-financing. Hope springs eternal? But the sound of bleching has not stopped.
Markets & Trends
| % Gains (Losses) Trends | ||||||||
| Close Dec 31/21 | Close May 13/22 | Week | YTD | Daily (Short Term) | Weekly (Intermediate) | Monthly (Long Term) | ||
| Stock Market Indices | ||||||||
| S&P 500 | 4,766.18 | 4,023.89 (new lows) | (2.4)% | (15.6)% | down | down | up | |
| Dow Jones Industrials | 36,333.30 | 32,196.66 (new lows) | (2.1% | (11.4)% | down | down | up | |
| Dow Jones Transports | 16,478.26 | 14,456.41 | (3.0)% | (12.3)% | down | down | up | |
| NASDAQ | 15,644.97 | 11,805.00 (new lows) | (2.8)% | (24.5)% | down | down | neutral | |
| S&P/TSX Composite | 21,222.84 | 20,099.81 | (2.6)% | (5.3)% | down | down | up | |
| S&P/TSX Venture (CDNX) | 939.18 | 696.65 (new lows) | (9.5)% | (25.8)% | down | down | neutral | |
| S&P 600 | 1,401.71 | 1,947.86 (new lows) | (1.6)% | (15.2)% | down | down | up (weak) | |
| MSCI World Index | 2,354.17 | 1,947.86 (new lows) | (4.4)% | (17.3)% | down | down | neutral | |
| NYSE Bitcoin Index | 47,907.71 | 30,833.70 (new lows) | (14.5)% | (35.6)% | down | down | up (weak) | |
| Gold Mining Stock Indices | ||||||||
| Gold Bugs Index (HUI) | 258.87 | 247.52 | (9.7)% | (4.4)% | down | down (weak) | neutral | |
| TSX Gold Index (TGD) | 292.16 | 293.67 | (9.9)% | 0.5% | down | neutral | up (weak) | |
| Fixed Income Yields/Spreads | ||||||||
| U.S. 10-Year Treasury Bond yield | 1.52% | 2.92% | (7.0)% | 92.1% | ||||
| Cdn. 10-Year Bond CGB yield | 1.43% | 2.96% | (4.2)% | 107.0% | ||||
| Recession Watch Spreads | ||||||||
| U.S. 2-year 10-year Treasury spread | 0.79% | 0.34% | (17.1)% | (56.0)% | ||||
| Cdn 2-year 10-year CGB spread | 0.48% | 0.29% | (19.4)% | (39.6)% | ||||
| Currencies | ||||||||
| US$ Index | 95.59 | 104.62 (new highs) | 0.9% | 9.5% | up | up | up | |
| Canadian $ | .7905 | 0.7732 (new lows) | (0.2)% | (2.2)% | down | down | neutral | |
| Euro | 113.74 | 104.01 (new lows) | (1.4)% | (8.6)% | down | down | down | |
| Swiss Franc | 109.77 | 99.69 (new lows) | (1.5)% | (9.2)% | down | down | down | |
| British Pound | 135.45 | 122.46 (new lows) | (0.7)% | (9.6)% | down | down | down | |
| Japanese Yen | 86.85 | 77.32 | 1.0% | (11.0)% | down | down | down | |
| Precious Metals | ||||||||
| Gold | 1,828.60 | 1,808.20 | (4.0)% | (1.1)% | down | neutral | up | |
| Silver | 23.35 | 21.00 (new lows) | (6.1)% | (10.1)% | down | down | neutral | |
| Platinum | 966.20 | 930.70 | (2.7)% | (3.7)% | down | down | neutral | |
| Base Metals | ||||||||
| Palladium | 1,912.10 | 1,917.70 | (5.2)% | 0.3% | down | down | neutral | |
| Copper | 4.46 | 4.18 | (2.1)% | (6.4)% | down | down | up | |
| Energy | ||||||||
| WTI Oil | 75.21 | 110.49 | 0.7% | 46.9% | up | up | up | |
| Natural Gas | 3.73 | 7.66 | (4.8)% | 105.4% | up | up | up | |
New highs/lows refer to new 52-week highs/lows and, in some cases, all-time highs.

There is no joy in the stock market. It is a sea of red ink. Maybe we’ve been too spoiled over the past decade or so. With the exception of that nasty pandemic crash in March 2020, the market has consistently made new highs, rising on a sea of ultra-low interest rates and massive amounts of liquidity injections through QE and rising debt levels. Oh, and companies have helped goose the market with a massive amount of stock buybacks.
The pain continued this past week. As we note under our Dow Jones Industrials (DJI) comment, we are now seven weeks down, something not seen since 2001. The S&P 500 fell 2.4% to fresh 52-week lows, the DJI lost 2.1% also to new 52-week lows, the Dow Jones Transportations (DJT) lost 3.0%, the NASDAQ fell 2.8% to fresh 52-week lows, and the S&P 600 small dropped 1.6% also to new 52-week lows. Was anybody spared? Even the S&P 500 Equal Weight Index fell 1.9% to new lows.
In Canada, the TSX Composite fell 2.6% and the TSX Venture Exchange (CDNX) was hammered, down 9.5% to fresh 52-week lows. There was more joy overseas. In the EU, the London FTSE gained 0.2%, the Paris CAC 40 was up 1.7%, while the German DAX gained 2.6%. Is the EU rebounding despite the ongoing war in the Ukraine and the threat of cut off of oil and gas? In Asia, China’s Shanghai Index (SSEC) gained 2.7% and while the Tokyo Nikkei Dow (TKN) fell 2.1% it rebounded sharply on Friday.
Indicators are mixed. As we note below, the VIX Volatility Indicator is diverging positively, a possible indicator of a low. But the put/call ratio got quickly bullish again. Not a good sign. The number of new lows on the NYSE soared over 1,000, a level that is often associated with lows in the market. The S&P 500 Bullish Percent Index (BPSPX) was at 30.6%, low but not super low. The number of stocks trading over their 200-day MA is at 32.5%, not exactly super bear territory. Only 21.6% are trading above their 50-day MA at levels associated with lows in the market. There are no divergences between the S&P 500 and the advance/decline line with both pointed firmly to the downside.
But the reality for the markets is inflation is rampant, as bad as it has been since the 1970s, and the Fed is taking away the punch bowl by raising interest rates and soon to embark on QT vs. QE. The markets are in a downtrend, having already wiped out some $7 trillion in 2022. Bond yields have been rising and we await a bond blow-up somewhere. (Okay, instead, we had a crypto blowup.) There is chaos everywhere with the Russia/Ukraine/US war, and, the deliberate slowdown/lockdown in China that could tip the Chinese economy over and in turn could tip the rest of the world into a recession.
The old stand-by is to raise cash levels but if you missed it, selling here is not a great idea. However, everyone will be trying to sell on a rebound. Oh, and, as we’ve said, own some gold. The sell-off in gold has cheapened it as well.
We need to regain 4,050 to give us a small technical buy signal. But the reality is we need to close over 4,300 to suggest that low could in. It is very possible we have seen at least a temporary low and a strong short-covering rally could get under way. But this bear is not over. It still may be just beginning.

The NASDAQ continued its misery this past week, falling 2.8% to fresh 52-week lows and now down 24.5% in 2022. We are in a bear market that has not yet bottomed, we believe. The FAANGs that led the market up are the main culprits with them now leading the market down. The NY FANG Index is down 32% in 2022 and down 37.5% from its November 2021 high. This past week the FAANGs were mixed to the downside. Facebook (Meta) fell 2.5%, Apple down 6.5%, Amazon -1.5% to 52-week lows, Netflix managed to rebound up 3.7% after making new 52-week lows, Google was also up 0.7% also after making 52-week lows, Microsoft down 5.0%, Tesla down 11.1%, Twitter down 18.2% after Elon Musk announced a hold on his purchase, Baidu gained about 0.2% after making 52-week lows, Alibaba fell 2.3%, and Nvidia was down 5.2%. The NY FANG Index fell 3.5% after making 52-week lows. We’d get a small buy signal for the NASDAQ above 12,000, but we’d need to get above 13,000 to suggest that a low is in. Otherwise, the trend is down and we have targets down to 10,500/11,000. The good news is we are not far from that level.
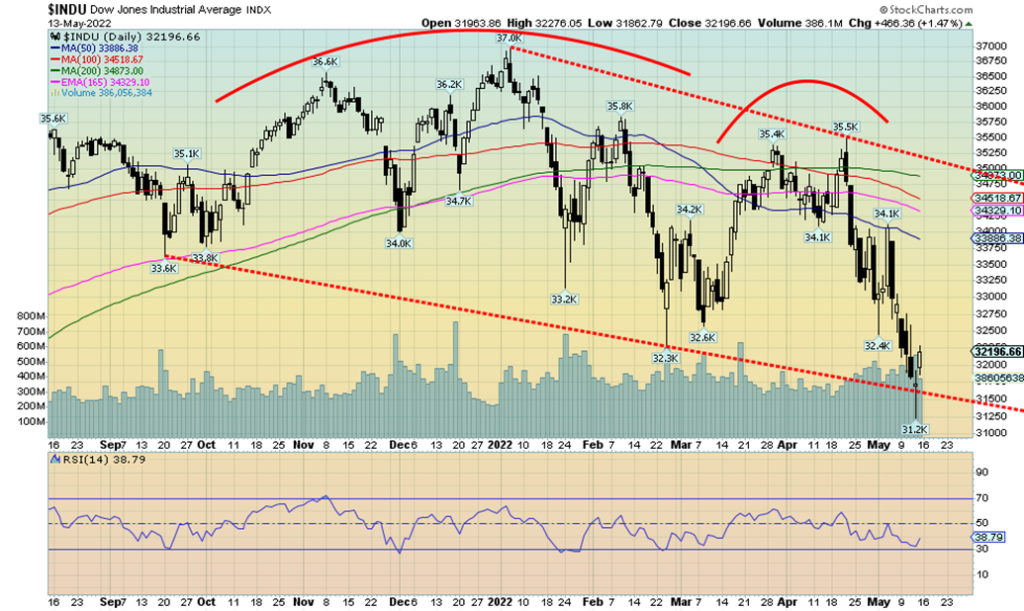
No joy for the big caps as the DJI saw fresh 52-week lows this past week at 31,228. Thursday’s action left one of those long doji’s on the chart, indicating a possible pause in the downtrend. Doji’s are a Japanese candlestick pattern seen where the market opens and then goes through a wide-ranging day before closing almost where it opened. Its significance is that it sometimes signals at least a pause in the market. On Friday the market rallied. An oversold bounce? Or are we making a bottom? The most recent breakdown for the DJI is suggesting we could fall to the 29,000/30,000 level with even lower potential once this rebound rally is over. A small buy signal would be seen for the DJI above 32,750 and we could see us rally back to the falling 50-day MA near 33,800. The DJI is now down for seven weeks in a row, an unenviable record that hasn’t been seen for 21 years back in 2001. If we were to fall again this coming week, we’d be matching a record that hasn’t been seen since 1923. At least the rebound on Friday gives some hope and support to a possible temporary low. New lows below 31,228 would set up a decline to 29,000/30,000. But we are hopeful for at least a rebound this week. However, we are not suggesting a major low.
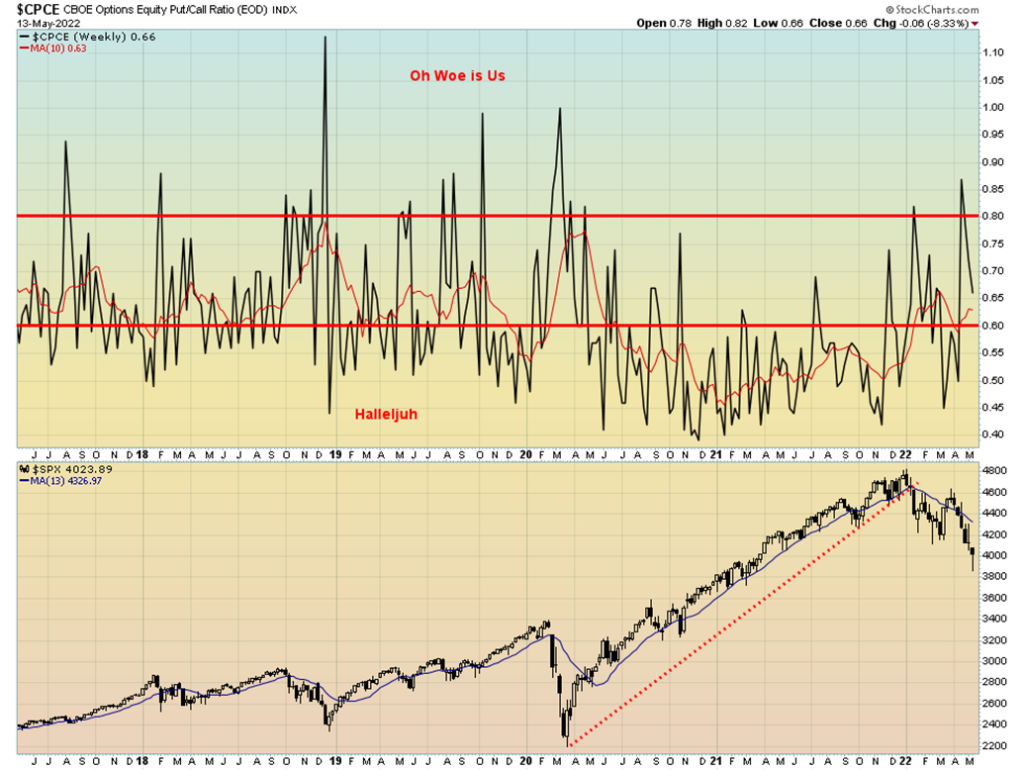
We were quite surprised to see the CBOE put/call ratio rally back so fast to 66, even as the S&P 500 was making new lows. Our preference is for the put/call to persist above 80 to suggest to us that a low may be at hand. The 10-week MA is only at 63 and again we’d prefer that to be a lot higher, even over 80. So, all we can say is—is the market getting too bullish too soon?

We love divergences at tops and bottoms and the VIX Volatility Index maybe giving us our divergence. At the highs in the latter part of 2021, note how the VIX was making higher lows even as the S&P 500 made higher highs. That was a divergence that resulted in the breakdown in January. Now the S&P 500 is making new lows but the VIX Volatility Index is making lower highs, a divergence. Naturally this is not confirmed. For confirmation, the S&P 500 needs to stage a rally, preferably regaining back above 4,200 but more realistically back above 4,500. The divergence is to be kept in mind but we need some other indicators to support it.
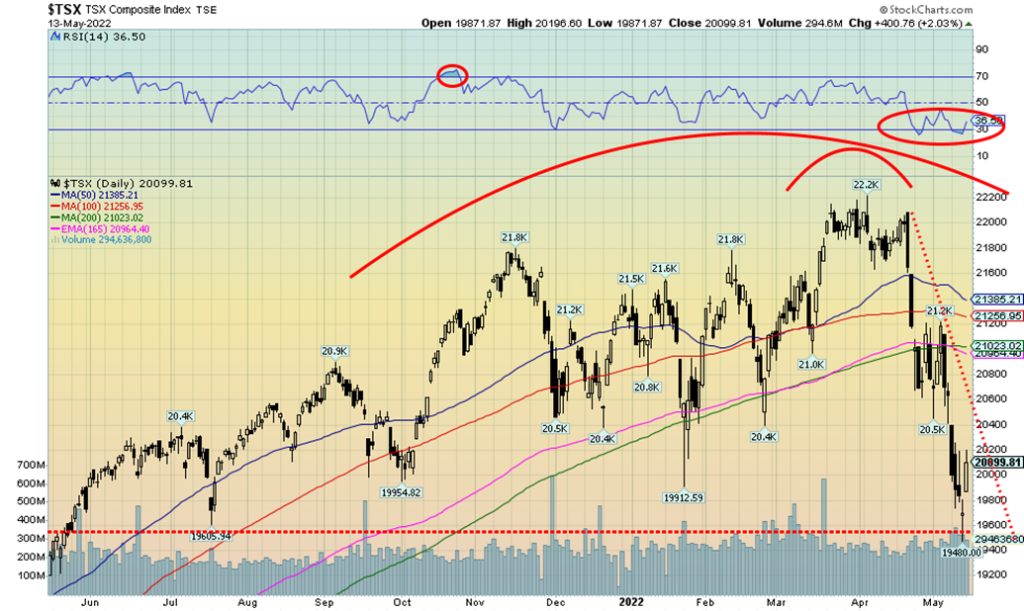
The TSX Composite followed the U.S. stock markets lower this past week as support broke and the index came close to setting fresh 52-week lows. One of our support points was 19,600 and the low on the week came in at 19,480. Thursday’s action left a possible bottom pattern on the charts and Friday the market followed through to the upside. But it will take a move and close above 20,400 for us to consider that a low is in. A move above 21,000 would confirm that a low is in. The TSX lost 2.6% this past week and is now down 5.3% in 2022. The junior TSX Venture Exchange (CDNX) continued its woes, falling 9.5% to 52-week lows and is now down 25.8% on the year.
Three out of the 14 sub-indices managed to close higher on the week. They were Consumer Discretionary (TCD) up 0.7%, Consumer Staples (TCS) up 1.8%, and Information Technology (TKK) up 0.9%. Both TCD and TKK made 52-week lows, then reversed and closed higher, a possible positive development. Real Estate (TRE) was flat on the week. The big losers were Gold (TGD) down 9.9%, Health Care (THC) -7.4%, Materials (TMT) -7.4%, and Metals & Mining (TGM) -6.7%. The important Financials (TFS) fell 2.1% and are down 8.0% in 2022. A number made new 52-week lows including TCS, THC, TIN, TRE, and TKK.
As noted, the TSX found support at 19,600 but we need to regain above 20,400 to suggest a low. We have turned down on the short and intermediate trend. The number of stocks trading above their 200-day MA has fallen to 34%. That is not quite into bear territory. Nor is the bullish sentiment indicator for the TSX quite in bear territory, currently at 36.8%. Below 30% is bear territory. Indicators are oversold so a relief rally could start any time.
U.S. 10-year Treasury Bond/Canadian 10-year Government Bond (CGB)

We’d be loath to say that bond yields have topped, given their rather muted reaction to the inflation numbers this past week. But with the CPI up 8.3% y-o-y and the PPI up 11%, it was surprising to discover that bond yields actually softened a bit this past week with the U.S. 10-year treasury note falling back to 2.92% from 3.14%. The Canadian 10-year Government of Canada bond (CGB) dropped to 2.96% from 3.09%. Our closely watched 2–10 spreads narrowed with the U.S. 2–10 spread down to 34 bp and the Canadian 2–10 spread down to 29 bp. Neither is anywhere near signaling a recession but, as a reminder, they can fall fast. Whether bond yields are softening on recession fears is difficult to say, but it is to be noted that, for the moment at least, yields have stopped going up.
Maybe they saw that Michigan Consumer Sentiment number on Friday when it came in at 59.1, the lowest level seen since August 2011. It was well below forecasts of 64 and March’s 65.2. Current economic conditions fell to 63.6, the lowest level in 13 years while expectations slipped to 56.2 from 62.5. Everything was down and that kind of consumer sentiment eventually translates into the consumer buying (buying conditions for durable goods also fell) and the stock market weakening even further. It could also give rise to economists talking about stagflation (high inflation and sinking feeble economic growth). Jobless claims this past week also came in marginally above expectations at 203,000 vs. an expected 195,000 and last week’s 202,000. Next week the big number is retail sales out on Tuesday. Canada reports its inflation numbers this week as well.
Our support for the 10-year is at 2.70% and a break under that level could send the 10-year lower to 2.50%. A move back above 3.00% could suggest new highs ahead.
Michigan Consumer Sentiment

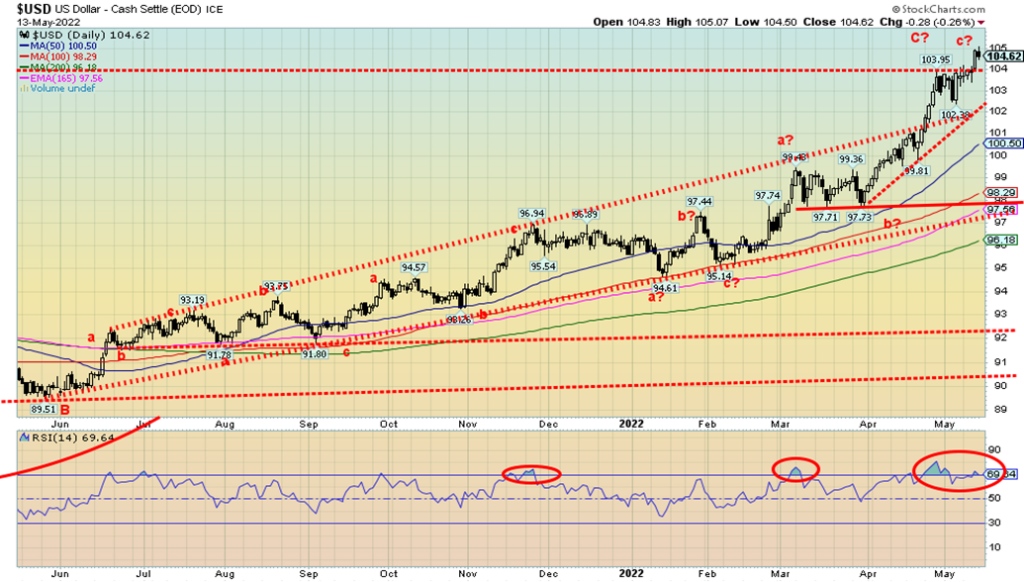
The US$ Index just keeps moving higher and higher. Capital flows primarily out of the EU, Japan, and China to purchase U.S. dollars and U.S. treasuries are driving the US$ Index higher and the currencies lower. This past week the US$ Index broke out of another barrier at 104.00, closing at 104.62. We are now starting to look at the 2001–2002 highs near 120/121 and wondering if they are now possible. The answer is yes. With the U.S. hiking interest rates to combat inflation, the U.S. now has the best interest rates of any of the major economies. As well, given the trouble in the EU with Ukraine/Russia war, the BOJ refusing to hike rates in Japan, and the slowdown underway in China, no wonder for the U.S. dollar and U.S. securities (even 3-month treasury bills at 1%) you have the capital flows out, as we noted.
This past week the US$ Index gained 0.9% to fresh 52-week highs. The Canadian dollar fell 0.2%, the euro was down 1.4%, the Swiss franc off 1.5%, the pound sterling down 0.7%, but the Japanese yen gained almost 1%. The Canadian dollar, the euro, Swiss and pound all made 52-week lows. The big surprise on the week was the Japanese yen that gained. But then, maybe Japan is being considered a safe haven now. An improving yen could also be positive for gold, as gold and the yen often trade in tandem.
Right now, we see little in the way of stopping the US$ Index from moving higher. Yes, it is very overbought but overbought is merely a condition that can remain for some time. Yes, sentiment towards the US$ Index is in the stratosphere. Yes, the U.S. dollar is the most attractive currency right now. What is needed is a change of sentiment. The U.S. suddenly falling into a recession might do it. Recall that Q1 GDP was negative. If Q2 is negative then we’d officially in a recession. Employment, which is a lagging indicator, would then start to falter and fall. The next good level of resistance is up at 108. We would not get a good sell signal unless we broke and closed under 102.
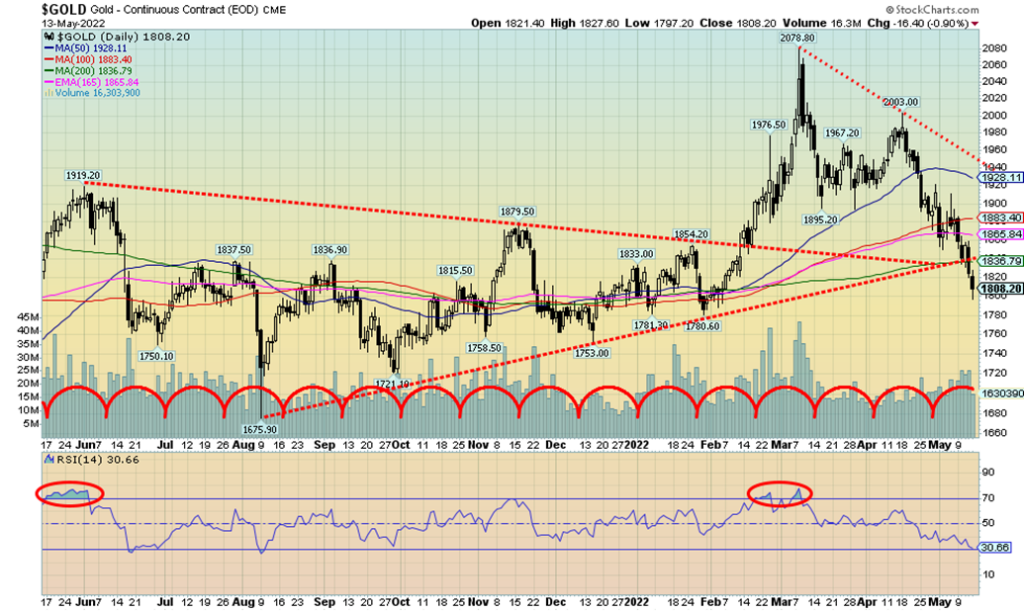
As bad as gold has been lately, it is still outperforming the stock and bond markets. And gold stocks are also outperforming both stock and bond markets. For the fourth consecutive week gold fell, this time losing almost 4%. Silver was worse, falling 6.1% to fresh 52-week lows. Platinum lost 2.7%. As to the near precious metals, palladium dropped 5.2% and copper fell 2.1%. The gold stocks were hammered lower with the Gold Bugs Index (HUI) down 9.7% and the TSX Gold Index (TGD) off 9.9%. Gold is now down slightly in 2022, off 1.1%. But we are also oversold and the commercial COT is showing some positive signs as noted next.
A strong U.S. dollar is the main culprit for falling gold. The Fed hiking interest rates is not helping either. A 50 bp hike in May is to be followed by another 50 bp in June and possibly July as well. Fed Chair Jerome Powell has said the battle to fight inflation would “include some pain.” A falling stock market is not helping gold either. As we have seen in the past, when the stock market is falling it tends to take everyone with it. As to the pain Powell is referring to, that pain is most likely a recession. But the reality is the Fed has taken away the punch bowl of supplying endless liquidity to markets (QT takes precedence over QE). The Fed is on a mission to bring down inflation and maximum employment be damned. With that in mind it is not surprising that all assets are taking it on the chin, gold included. But we do see some positive signs. Copper has broken its up-trend line and copper could be a leading indicator that we are headed for a recession. That will put the Fed in a difficult spot between fighting inflation and fighting a recession. Can’t do both at once. The rock and a hard a stone.
It is not surprising that we are seeing numerous pundits weighing in on gold that it is making a bottom, it is here, the buy of the century, buy now as we are headed for $3,000, and more. We tend to ignore all those prognostications as those pundits have been saying the same thing for years.
Gold has broken below up trend line from the low seen in August 2021. That suggests we could fall and test that low near $1,675. Right now, we need a close above $1,885 to suggest to us that we may be making a low.
A close above $1,930 would most likely confirm a low. Gold is becoming oversold but it has room to move lower. A move below $1,770 sets up the potential to see new lows below $1,673/$1,675 the 2021 low. If that level were to break, then we could be targeting anywhere down to the March 2020 low of $1,450. With that we’d be having thoughts that we are in the throes of making our anticipated 7.8-year and 23-year cycle lows.
None of this is a cheery forecast but oversold levels, falling sentiment, an improving commercial COT, all give us some hope that a low could be at hand even if it proves to be only a temporary low.
Copper Tilting Downward?

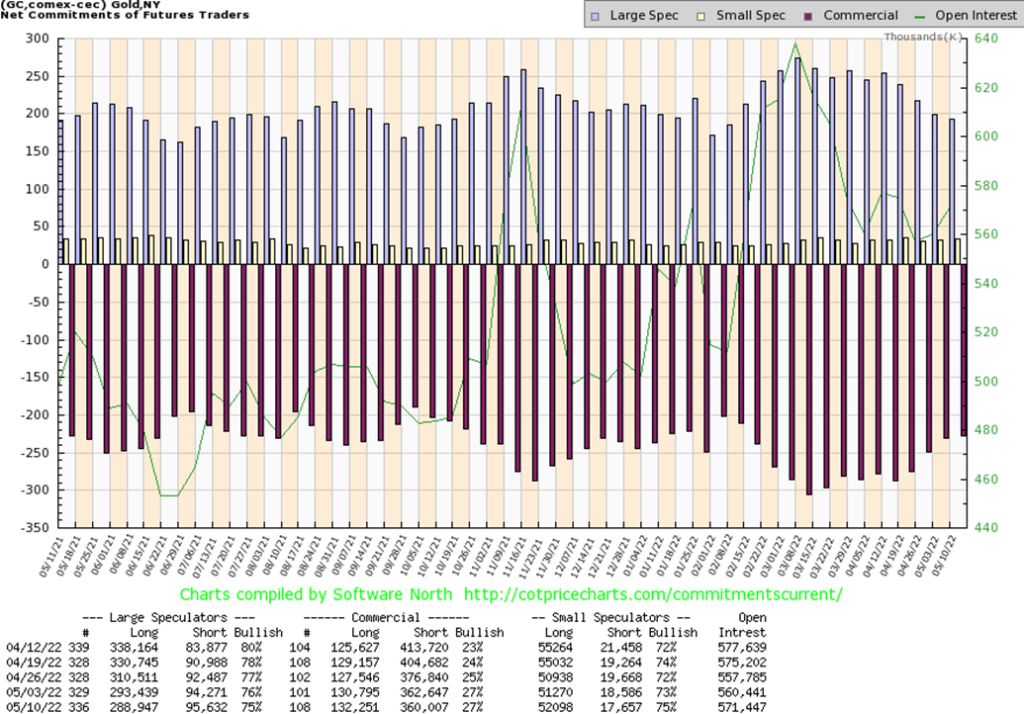
While the gold commercial COT (bullion companies and banks) was unchanged on the week, there was some improvement seen. Long open interest rose just under 2,000 contracts while short open interest fell over 2,000 contracts. It just didn’t change the ratio. The large speculators COT (hedge funds, managed futures, etc.) slipped to 75% from 76%. Overall open interest rose on a down week by about 11,000 contracts. We are slightly positive about this week’s COT despite little improvement.
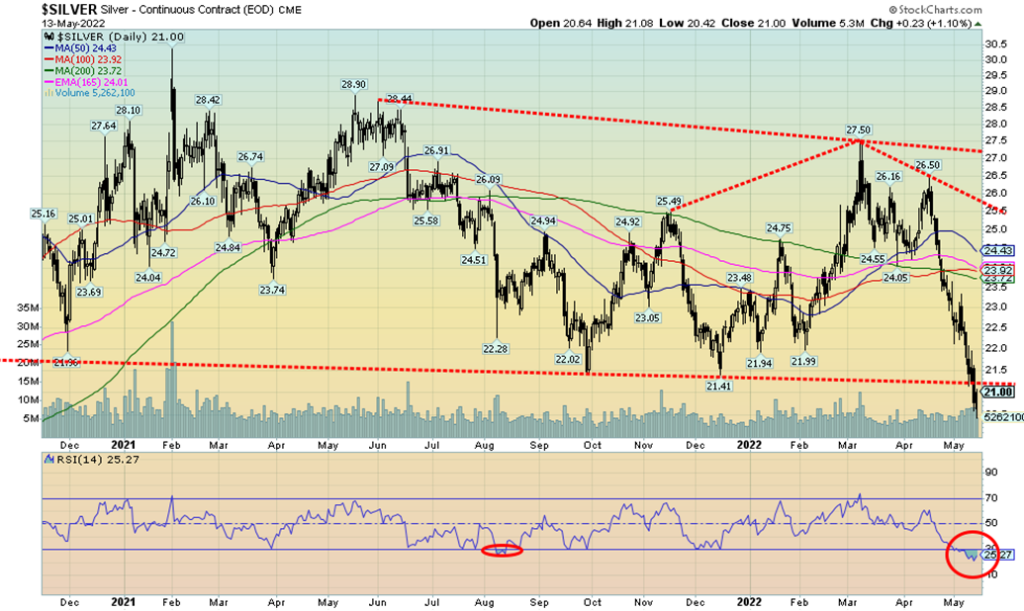
So, which is it? Silver is headed for new lows down to $14/$15? Or silver is so oversold now and sentiment is so bearish that a rebound rally could develop at any moment? This past week silver fell to 52-week lows, taking out all the lows seen over the past year and half. If we wanted to take our most bearish scenario, silver could fall as low $13. Initial targets could be down to $18.75/$19.00.
If there are some positives, it is first the deeply oversold RSI on the dailies at 25. The weekly and monthly RSI are not yet in deeply oversold territory. Silver, in falling to fresh 52-week lows, is also diverging sharply with gold that did not make 52-week lows. Silver priced in other major currencies is not making new 52-week lows. The exception is silver in Canadian dollars. But silver in euros, Swiss, yen, and pound did not make 52-week lows. However, as we noted, we can’t rule out gold eventually falling to 52-week lows, either. Nor can we rule out silver priced in other currencies not making new 52-week lows. The ultra-strong U.S. dollar is hurting silver in U.S. dollars, but weak currencies mean silver is holding its own in other currencies.
A small buy signal for silver on a break over $22. However, the reality is we’d need to see a break and close over $23 to convince us that a low is in. Silver looks like it is falling from an odd-shaped descending triangle which is bearish. Not a pretty picture. The best hope now is the deeply oversold levels, the improving commercial COT, and that silver is holding up well in other currencies. As noted, a break and close over $22 would be a start to confirm a low. Under $20, targets of $18.75/$19 are likely.
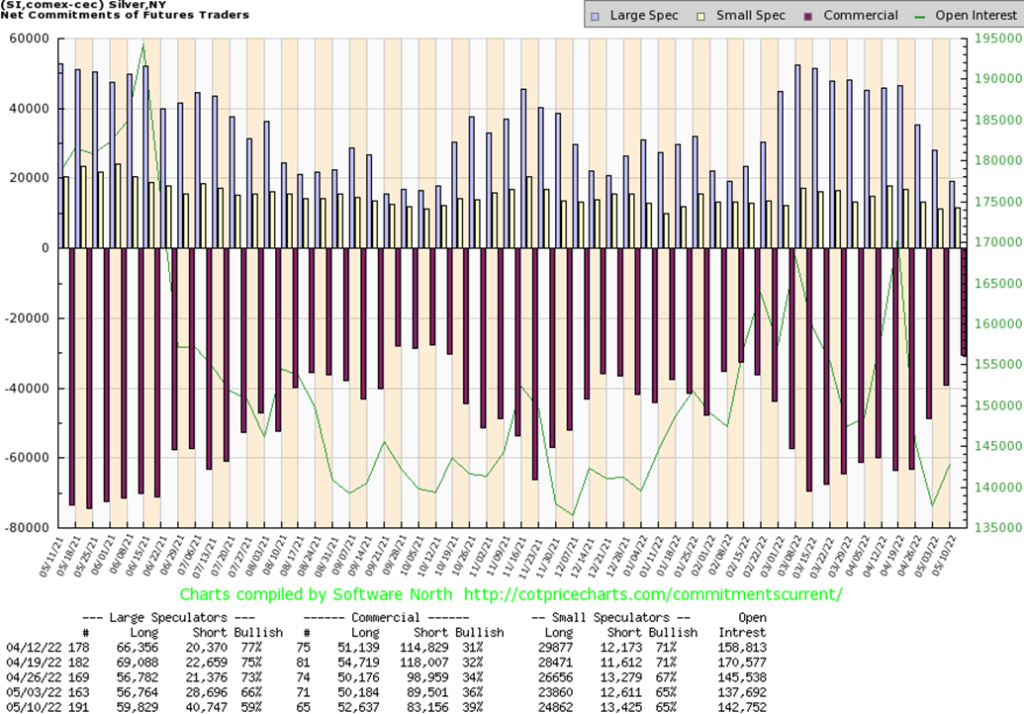
A big improvement for the silver commercial COT this past week as it jumped to 39% from 36%. This is as good as we have seen it since the last good rally/rebound got underway in December. Long open interest rose over 2,000 contracts while short open interest fell over 6,000 contracts. Overall open interest rose about 5,000 contracts on a big down week. The large speculators went in the opposite direction as they fell from 66% to 59%, even as they added around 6,000 longs but they also added about 12,000 shorts. We view the latest silver COT as positive.
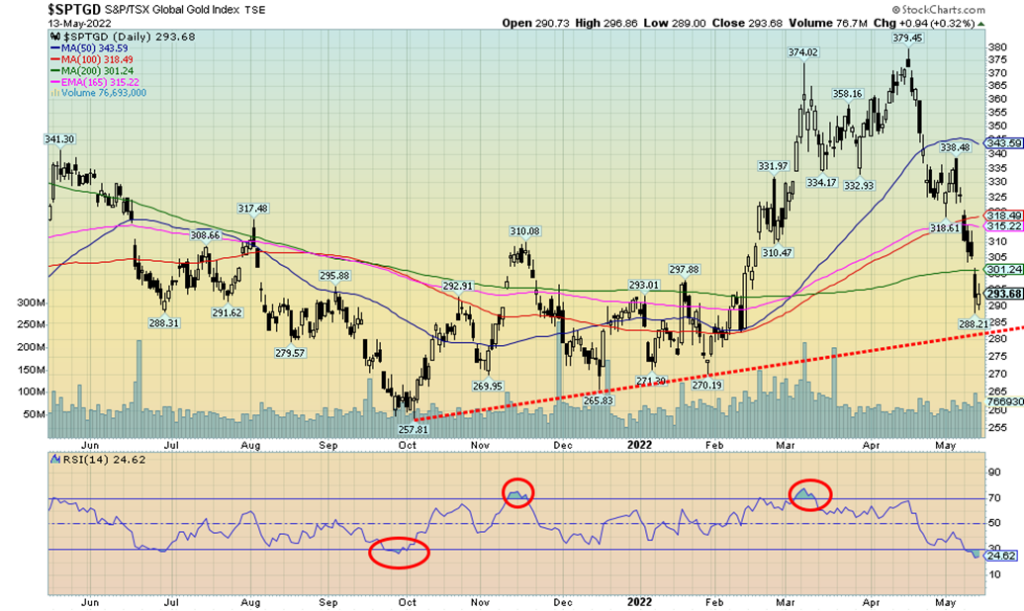
It was a very unpleasant week for the gold stocks as they have now given back all or most of the gains seen since a low in December 2021. This past week the TSX Gold Index (TGD) fell 9.9% while the Gold Bugs Index (HUI) was off 9.7%. The HUI fell into negative territory for the year, now down 4.4% while the TGD is barely clinging to a gain, up 0.5%.
From the low in December 2021 the TGD gained 42.7%. Since then, it has fallen 22.6% but remains up 10.5% from that December 2021 low. Given the close this week it is possible we could now see new lows below the December 2021 low of 266. There is support down to 280 but below that new lows are likely, including falling below the October 2021 low of 258. If there is some sign of encouragement, the RSI at just under 25 indicates a very oversold market. As well, the Gold Miners Bullish Percent Index (BPGDM) is down to 31%. A drop below 25% puts the gold stocks into oversold territory where often at minimum counter-trend rallies develop.
We need to recover and close above 320 to convince us that a low may be in. Above 345 a low would be confirmed and above 358 new highs are likely. Of concern at the moment is that new lows are possible unless we can recover at minimum above 320 first. The oversold conditions are an indication but not a guarantee that a low could be at hand. More evidence is needed.

So, is it demand destruction because of the deliberate shutdowns in China, or is it fear of finding supply if the EU implements a Russian oil ban? Depending on the answer, oil prices can either leap up or fall down fast. This past week alone we saw WTI oil fall $10 in 2 days May 9 and 10 then leap $10.70 the remainder of the week. At week’s end WTI oil closed higher by $0.72 or 0.7%. Natural gas (NG) eased somewhat, thanks to the EU not threatening to cut off Russian NG supply. NG fell 4.8% down $0.38.
Still, our most interesting read this past week was that millions of U.K. homes could face a winter with no heat. Apparently, sharply rising energy prices are making the costs of energy prohibitive for many Brits. There was talk that bills could reach as high as £2,900 (US$3,576) by October. The choice, as some noted, could be between heating or eating. Many homes in the U.K. are not well insulated. Sanctions, it seems, have unintended consequences.
Threats of Russian oil bans or the lockdowns in China are issues that are not going to go away. The result is, oil could continue to be volatile. Not helping matters are low or falling supplies. While the U.S. produces enough oil and gas to mostly satisfy their needs, they don’t have a lot of excess to ship elsewhere. Worse, their stockpiles are dwindling with both oil and distillate stocks well below the five-year average. If they needed to release more to help mitigate the price, they could have a difficult time doing it.
Meanwhile, WTI oil trades in what appears as a symmetrical triangle. A firm breakout over $112.50 could send oil towards $150. The energy stocks also appear poised to move higher. The energy stocks softened this week, falling along with the broader market. The ARCA Oil & Gas Index (XOI) fell 3.1% while the TSX Energy Index (TEN) was down 3.6%. Both remain up on the year 40.8% and 49.6% respectively. The XOI and TEN both fell sharply on May 9 along with the market, but by week’s end had recovered most of it. New highs over 1,700 for the XOI would most likely point the index higher. Oil, the XOI, and the TEN are holding good uptrends. Difficult to say what NG will do here as it started a correction earlier in the week and may not yet be finished. A move back above $8.40 would likely lead to new highs. Good support down to $6.25.
__
(Featured image by Adam Śmigielski via Unsplash)
DISCLAIMER: This article was written by a third party contributor and does not reflect the opinion of Born2Invest, its management, staff or its associates. Please review our disclaimer for more information.
This article may include forward-looking statements. These forward-looking statements generally are identified by the words “believe,” “project,” “estimate,” “become,” “plan,” “will,” and similar expressions. These forward-looking statements involve known and unknown risks as well as uncertainties, including those discussed in the following cautionary statements and elsewhere in this article and on this site. Although the Company may believe that its expectations are based on reasonable assumptions, the actual results that the Company may achieve may differ materially from any forward-looking statements, which reflect the opinions of the management of the Company only as of the date hereof. Additionally, please make sure to read these important disclosures.
David Chapman is not a registered advisory service and is not an exempt market dealer (EMD) nor a licensed financial advisor. He does not and cannot give individualised market advice. David Chapman has worked in the financial industry for over 40 years including large financial corporations, banks, and investment dealers. The information in this newsletter is intended only for informational and educational purposes. It should not be construed as an offer, a solicitation of an offer or sale of any security. Every effort is made to provide accurate and complete information. However, we cannot guarantee that there will be no errors. We make no claims, promises or guarantees about the accuracy, completeness, or adequacy of the contents of this commentary and expressly disclaim liability for errors and omissions in the contents of this commentary. David Chapman will always use his best efforts to ensure the accuracy and timeliness of all information. The reader assumes all risk when trading in securities and David Chapman advises consulting a licensed professional financial advisor or portfolio manager such as Enriched Investing Incorporated before proceeding with any trade or idea presented in this newsletter. David Chapman may own shares in companies mentioned in this newsletter. Before making an investment, prospective investors should review each security’s offering documents which summarize the objectives, fees, expenses and associated risks. David Chapman shares his ideas and opinions for informational and educational purposes only and expects the reader to perform due diligence before considering a position in any security. That includes consulting with your own licensed professional financial advisor such as Enriched Investing Incorporated. Performance is not guaranteed, values change frequently, and past performance may not be repeated.

-

 Biotech1 week ago
Volatile Outlook for Enlivex Therapeutics as Investors Await Clinical Catalysts
-

 Impact Investing2 weeks ago
Inter IKEA Launches Electric Truck Fleet to Decarbonize Heavy-Duty Logistics in Italy
-

 Markets3 days ago
Weather-Driven Supply Outlook Lifts Coffee Markets in Brazil and Vietnam
-

 Markets1 week ago
Cotton Market Weakens Amid Demand Concerns and Bearish Trends


