Featured
Stock Markets Have Officially Entered Bear Territory
It’s official. It’s a bear market. Although the TSX is still only in correction territory. Worst start since 1939. Crypto’s crashing and our scary calculation says they could all go bust. We have a short piece on cryptos. We look at some past bear markets to try to get a sense as to what this one will look like. Bad news is that this is only the first phase. Good news is a rebound rally could start any time.

I’ve been involved in capital markets for nigh on fifty years. We started out with the Vietnam war still raging. Since then I’ve experienced the 1970’s oil crisis, Watergate and the collapse of the Nixon presidency, the 1973-1974 stock market collapse, the Iranian crisis 1979-1980, the inflation and high interest rates of the late 1970’s that helped spark the 1980-1982 recession and collapse, the Latin American debt crisis where I was personally involved in loan restructuring for the bank I was working for at the time, the 1987 stock market panic Black Monday where I was sitting on the trading desk of a major bank, the 1980’s savings and loans crisis where a third of the U.S.’s S&L’s collapsed, Gulf War 1 and the subsequent early 1990’s recession, the Japanese stock market bubble 1986-1990, the 1994 Mexico economic crisis, the 1997 Asian contagion, the 1998 Russian debt default and LTCM that almost brought down the financial system, the dot.com boom of the 1990’s and the subsequent collapse, the Latin American banking crisis in the early 2000’s, the 2008 financial crisis that saw the biggest collapse in the stock market since the Great Depression, the EU/Greek financial debt crisis of 2010-2012, the Russian/Ukraine war 2014, the Russian financial crisis, the 2015 Chinese stock market crash, the Turkish currency collapse 2018, the pandemic crash of March 2020, the growing Russian financial crisis of 2022. One could get exhausted just thinking of all that has gone over the past 50 years.
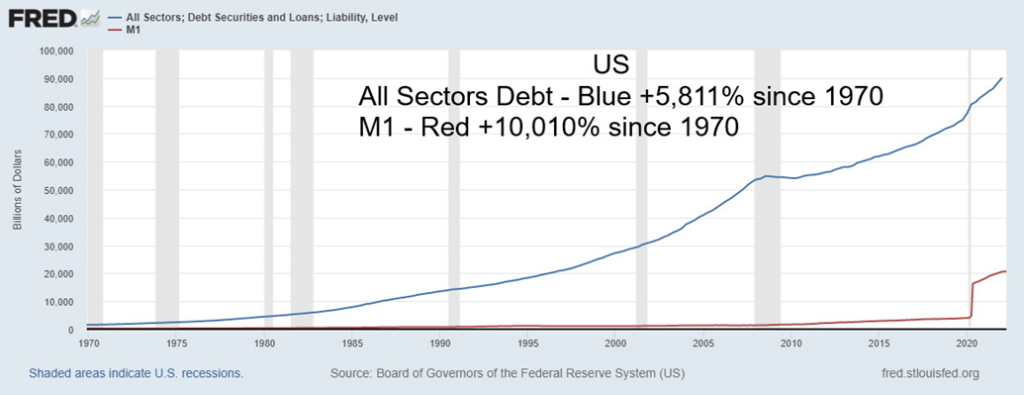
Throughout it all money and debt exploded. Never in history have we seen such exponential growth in money and debt. Below the chart shows the explosive growth in debt and money in the U.S. since 1970. We could apply that all over the world. Both really took off once the shackles came off the banking system and the gold standard ended in August 1971. Further explosions of money and debt came out of the 1998 Russia/LTCM crisis, the 2008 financial crisis and the 2020 pandemic crisis.
In every case, a larger crisis was averted because the central banks of the world flooded the financial system with money. Stock markets exploded to the upside and debt grew even faster as many bought into the belief
that no matter what the Fed and the central banks would bail them out. Hence the name the “Fed put”. But what if that put isn’t available any longer? How many times can the central banks bail out the financial system without blowing themselves up? Are we running out bullets or is running out of fuel?
So, what are we facing? Right now, we are facing a sea of red. The S&P 500 has officially fallen into a bear market, the NASDAQ is down over 30% from its high, Bitcoin and the cryptos have been slaughtered with Bitcoin down over 66% and platforms collapsing, even bonds haven’t been spared and are down on the year (prices are down, yields sharply higher as prices move inversely to yields).
Performance 2022 Selected Markets
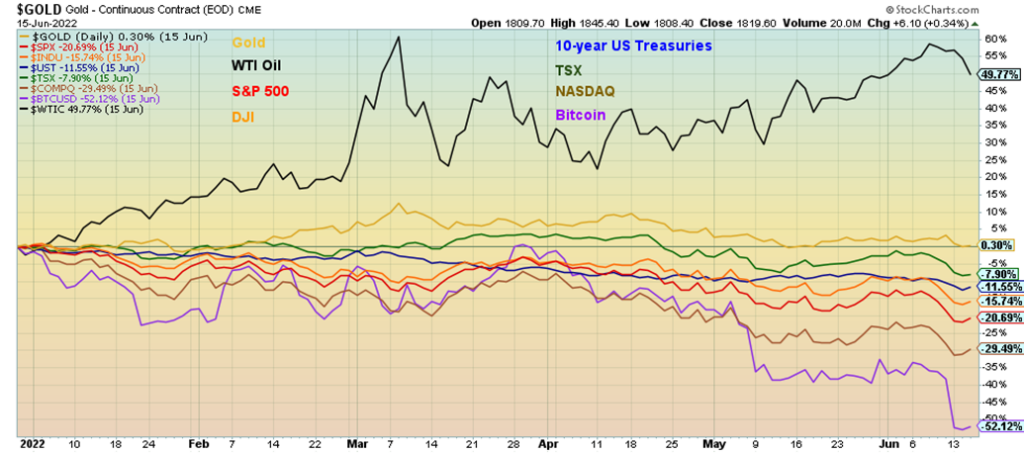
As the chart shows the only thing up this year is oil and gold. And sharply rising oil prices are a prime reason behind the sharp rise in inflation. Rising oil prices have also been a function of the Ukraine/Russia/U.S. war and sanctions. All commodity prices are impacted by the war. Supply disruptions thanks again to the war and the response to the pandemic are also negatively impacting inflation.
Now we have simultaneously the stock market bubble, the credit bubble and the debt bubble all imploding or on the verge of imploding at the same time. We are caught in an endless war in Ukraine that is primarily between the U.S. and Russia even though the U.S. is not official a combatant. The U.S. is also at odds with China. The G7 is now to be confronted by a new mix the G8 (Russia, China, Turkey, Brazil, India, Indonesia, Mexico, and Iran) all of who are not honoring sanctions against Russia and are starting to gather together as an economic block to counter the G7. Yes, the GDP of the G7 overwhelms the G8 by $38.7 trillion vs. $23.3 trillion and more importantly GDP/Capita by $43.3 thousand vs. $10.5 thousand but the G8 have much of what the G7 wants and needs to run their economies.
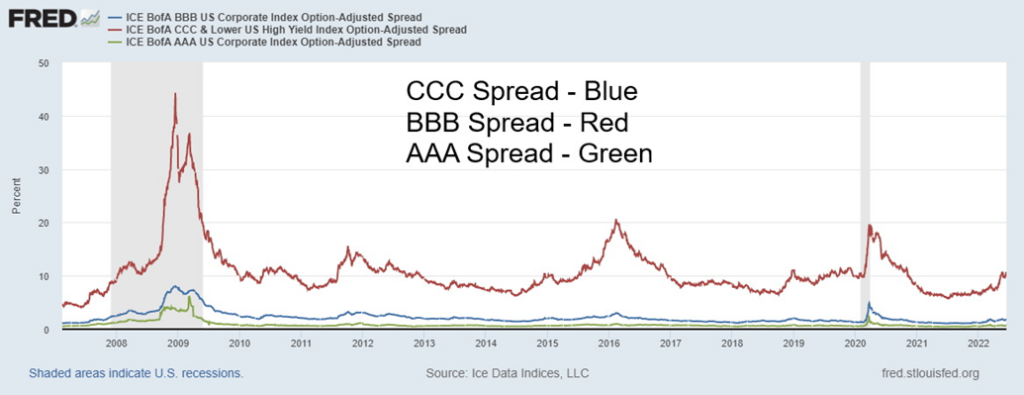
Could the credit and debt bubble burst? History is replete with debt collapses that also triggered economic collapse and depressions. CCC credit spreads are rising last at 10.5% over U.S. treasuries. At the beginning of 2022 they were 6.7% over. The same is being seen with BBB spreads now 1.8% vs. 1.2% and even AAA spreads now at 0.65% vs. 0.53%. A debt implosion is coming. We just don’t know when or who.
Rising Credit Spreads 2007-2022
A question we have been asking ourselves is are we setting ourselves up for an even bigger crash into the fall with more problems to come in 2023. None of the current issues are about to go away. We are entering the hurricane and fire seasons and who knows what devastation they’ll bring this year. Currently we are now six months into this market correction that has now officially turned into a bear market. Since 1900 the longest bear market recorded was September 1939 to April 1942 a period of 2.6 years or about 32 months. The
financial crisis bear of 2007-2009 lasted 1.4 years or about 17 months. Given the nature of this bear we believe we are facing upwards of a two-year bear market with the potential for a crash as a part of it. We have a look at some of the bear markets since 1970.
Bear Market 1973-1974
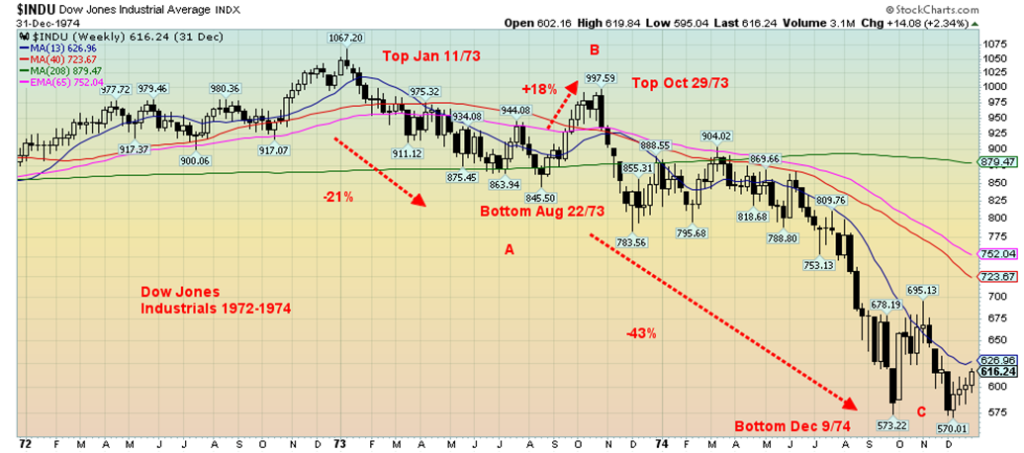
You will discover that each of these bear markets are somewhat similar in look. There is an initial sharp decline lasting months. The initial decline for the 1973-1974 lasted seven months. That’s the A wave down. The Dow Jones Industrials (DJI) fell 21%. The B wave correction lasted only roughly two months and gained a feeble 18%. The devastating C wave lasted fourteen months as the DJI fell 43%. This wasn’t just one big crash but a grinding bear market.
We passed on showing the 1980-1982 bear as it did not follow the pattern above. That market actually held up quite well primarily because the Fed had hiked interest rates to unheard of levels and the expectation was that this would work out to set-up the economic rebound despite the pain of the downturn. In that respect the stock market is forward looking.
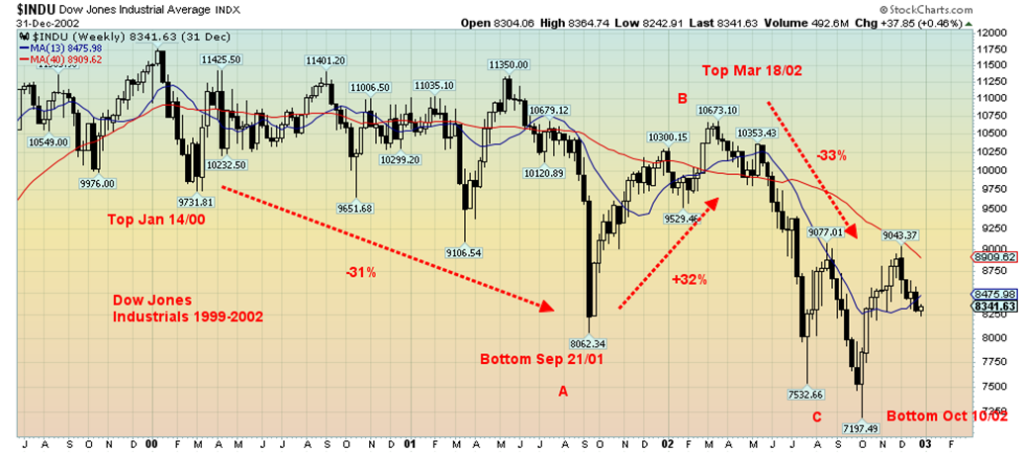
The pattern for the 2000-2002 bear is somewhat similar even if the first wave down was somewhat irregular. But again a ragged decline that played out over twenty months culminating in the 9/11 crash as overall the DJI fell 31%. The B wave rally lasted six months and gained 32%. But the subsequent dot.com/high tech collapse took the markets down sharply (especially the NASDAQ) but even the DJI lost 33% over a period of seven months. Total 33 months and a loss for the DJI of 39% (the NASDAQ fell 78% the biggest loss for an index since the 89% collapse of the DJI 1929-1932).
Bear Market 2000-2002
Bear Market 2007-2009
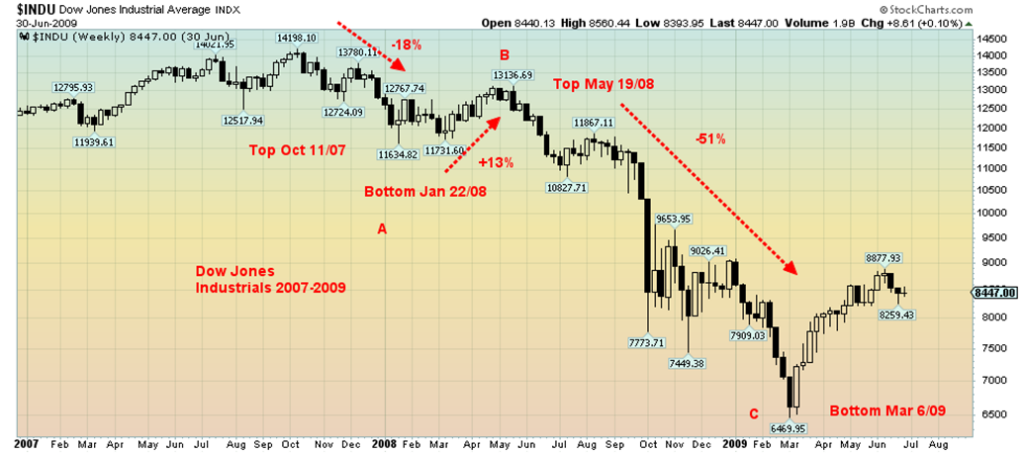
Was the 2007-2009 bear market any different? Hardly. The market topped first in October 2007 and the first leg down (A wave) lasted only three months as the DJI lost 18%. It didn’t seem to hint at the bigger drop to come. The B wave lasted in May a period of four months as the DJI gained a feeble 13%. Then came the big drop, the C wave down that included the Lehman Brothers collapse triggering a global financial crisis in
September 2008. The C wave down lasted about ten months as the DJI fell 51% the steepest decline for the DJI since the Great Depression.
ABC collapse is a common theme in all these crashes. An initial decline (A) followed by a hook rebound (B) and then the big one down (C). A common Elliott wave pattern. This one is barely underway. We are only in month six and we have yet to establish a low for the A wave. But when we do the B wave will follow. It is what comes after that is of greater concern. Given the background of war, sanctions, inflation, rising interest rates, falling stock and bond markets, the implosion of cryptos and the looming effects of climate change a 50% decline or more for the C wave would not come as a surprise. Things today are far graver than they were in 1973, 2000, or 2007. The potential debt implosion is higher than it has ever been and that translates into a housing collapse as well, economic collapse, and rising unemployment. Oh, and there is a little investigation into an attempted coup d’état on January 6, 2021, that could yet implode as well. No, the recession is not yet official. But the unofficial recession is underway. The stock market is forward-looking and it is warning us of danger to come. Be warned.
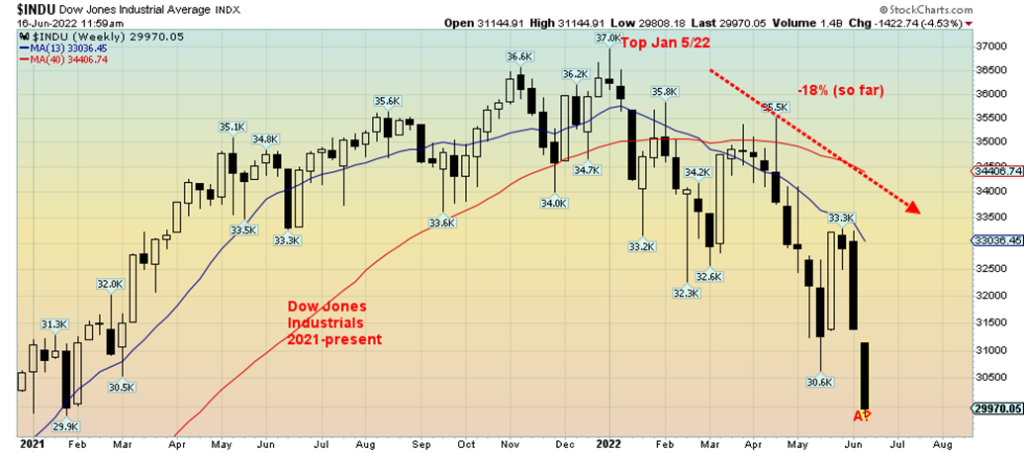
The Unfolding Bear Market 2022-?
We’ve been saying all along that the Fed and the other central banks are trapped. The Fed raising 50 bp is hawkish. Raising 75 bp as it did this week is even more hawkish. In fact, some believe it’s not hawkish enough. Other central banks have hiked their rates as well. All came to the table late to tackle inflation. Trying to do this while avoiding a recession is nigh on impossible. Every recession since 1970 was preceded by Fed and central bank rate hikes. The only way to bring down inflation is to spark a recession. Only this time it’s against the backdrop of war, sanctions, climate change and massive amounts of debt. There is no longer a Fed put. Result the stock market is crashing. Now there seems to be no longer a Fed put for the economy either. The economy is being thrown under the bus to bring down the rate of inflation. An official recession is matter of when not if. Somebody is going to blow up. A big bond fund, a big hedge fund? A crypto crash is already under way. But look who’s holding up – Gold.
Chart of the Week
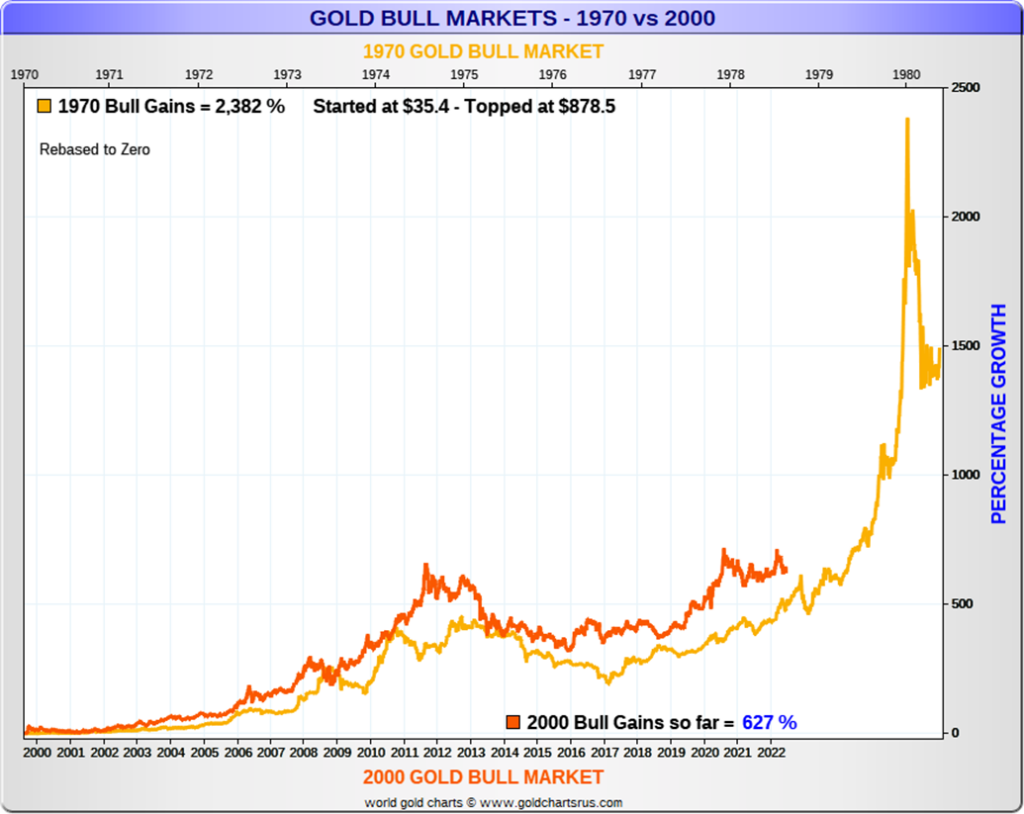
An interesting chart from Nick Laird of World Gold Charts, Gold Charts’r’us www.goldchartsrus.com. This is comparing the 2000’s gold market with the gold market of the 1970’s. The chart here is zero based. However, the time frame doesn’t match up as the 1970’s gold bull played out between 1970 and 1980 while the 2000’s gold market is now 22 years and counting 2000-2022. Ultimately this could play out until 2030 maybe longer.
In the 1970’s gold rose from $35 to $850 a gain of 2,300%. A similar ride today could in theory take gold to about $6,100. Gold’s low in April 2001 was $251. A lot of people just dismiss gold as baubles on people’s arms, fingers, necks – jewellery. Yet central banks continue to hold as reserves 35,568.4 metric tonnes as of March 2022. And many countries particularly China and Russia keep adding to their gold reserves. Some got rid of all their gold holdings – Canada. The best estimate for gold that has been mined is currently 205,238 metric tonnes. In 2021 the distribution of mined gold was 55.4% to jewelry, 25.0% to investment, 11.3% to central banks, and, 8.2% to technology.
Gold also attracts the doomsday crowd or what many call “gold bugs”. After all, there used to be a gold standard (classical gold standard was 1870-1914) and following Bretton Woods in 1944 the U.S. dollar was set as the world’s reserve currency backed by gold at $35/ounce. The gold peg collapsed in the 1960’s and ended in August 1971. Since then, the “gold bugs” people believe we face financial Armageddon unless we once again make money worth something by backing with gold. Today money is fiat – a promissory note from government that they promise the pay the holder the face value of the paper money. Intrinsically today’s paper money is worthless.
Gold rose in the 1970’s as it was a turbulent period with oil price shocks, double-digit inflation, political instability, steep recessions, and a weak dollar. All we need now is a weak dollar. The recession may already be underway. The question is when does the crisis of confidence get underway. When it does gold should soar. At least, unlike paper money or cryptos, gold is real. Gold has no liability, unlike stocks and bonds.
We couldn’t help but notice that downward blip on the chart for gold around 1978. Yes, gold fell about 21% in November 1978. A reminder we are still looking for our 7.83-year cycle low and 23–25-year cycle low. We are in the early period for those lows. And we are concerned about the possible double top on the gold charts in August 2020 at $2,089 and again in March 2022 at $2,078. Our neckline is around $1,675. Hate to see that fall.
Nonetheless, while some may consider the above chart compelling it still has more time to play out to see if gold continues to adhere to the 1970’s pattern.
The Crash of the Cryptos
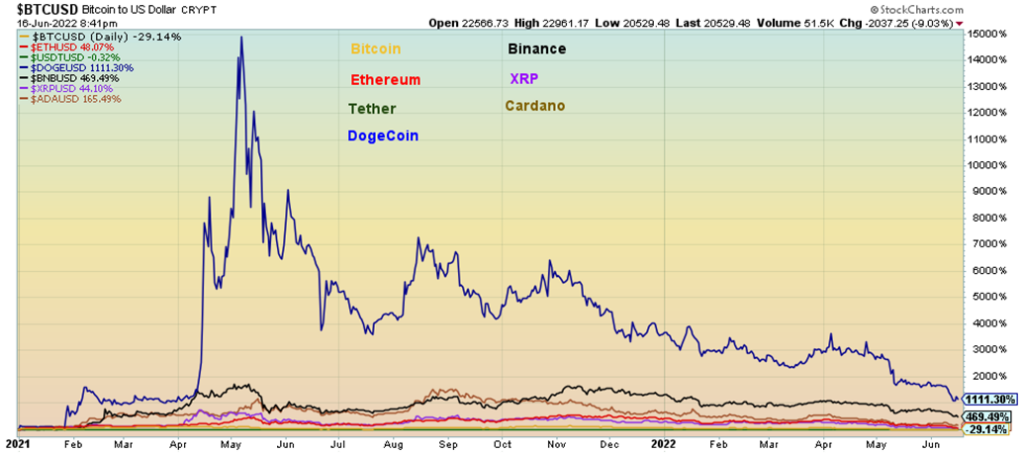
The crypto market has crashed. Bitcoin, the granddaddy of all cryptos has crashed 70% from its all-time high back in November. Our old favorite, Dogecoin, the crypto represented by a Shibu Inu and originally started as a joke, has crashed 93%. Not sure what that says about Elon Musk and Snoop Dog two celebrities pumping Dogecoin. Other cryptos have followed from the penthouse to the outhouse. Yes, bizarrely as this chart demonstrates, many remain up from where they were at the start of 2021. Pumping crypto has been popular. From movie star Matt Damon to the man who wants to be Prime Minister of Canada Pierre Poilievre. Although first Mr. Poilievre has to win the leadership of the Conservative Party of Canada, where he is leading the polls. He also wants to abolish the Bank of Canada (BofC) not acknowledging that he really doesn’t have that power.
So, what’s happened? Crypto started falling slowly then suddenly. Things really heated up in May when Terra collapsed as $50 billion turned to pixie dust. Terra was known as a “stablecoin” linked to the U.S. dollar. Some stablecoins like Tether and USDC remain. They act like banks. Only who are they giving (lending?) their money too? Crypto has been built on dreams, wishes and fairy tale dust as columnist Gary Mason wrote recently (Globe and Mail, June 17, 2022 – What the crypto crash says about Pierre Poilievre’s judgment”. Microsoft founder Bill Gates called it the “greater fool theory” meaning there always somebody willing to buy something that is essentially worthless. Crypto losses are now estimated at $1.5 trillion. A lot of people are hurting. Some may go bankrupt, lose their homes, everything. Many can’t even access their investment as platforms shut the door and collapse.
We can only guess that’s what’s happen when one buys something that essentially has no value. Well, those that got in at the outset have become billionaires. Hope they sold long ago. At least gold is real. Is there a future for cryptos? Or will it all just evaporate. They are calling this a “death spiral”. The technology, Blockchain, that helped create cryptos will, however, remain and that may be its biggest contribution.
Markets & Trends
| % Gains (Losses) Trends | ||||||||
| Close Dec 31/21 | Close Jun 17/22 | Week | YTD | Daily (Short Term) | Weekly (Intermediate) | Monthly (Long Term) | ||
| Stock Market Indices | ||||||||
| S&P 500 | 4,766.18 | 3,674.84 (new lows) | (5.8)% | (22.9)% | down | down | neutral | |
| Dow Jones Industrials | 36,333.30 | 29,888.78 (new lows) | (4.8)% | (17.8)% | down | down | neutral | |
| Dow Jones Transports | 16,478.26 | 12,868.60 (new lows) | (3.7)% | (21.9)% | down | down | up (weak) | |
| NASDAQ | 15,644.97 | 10,798.35 (new lows) | (4.8)% | (31.0)% | down | down | neutral | |
| S&P/TSX Composite | 21,222.84 | 18,930.48 (new lows) | (6.6)% | (10.8)% | down | down | up | |
| S&P/TSX Venture (CDNX) | 939.18 | 640.38 (new lows) | (9.1)% | (31.8)% | down | down | down (weak) | |
| S&P 600 | 1,401.71 | 1,095.12 (new lows) | (7.9)% | (21.9)% | down | down | neutral | |
| MSCI World Index | 2,354.17 | 1,884.63 (new lows) | (7.6)% | (20.0)% | down | down | down (weak) | |
| NYSE Bitcoin Index | 47,907.71 | 20,458.60 (new lows) | (30.8)% | (57.3)% | down | down | neutral | |
| Gold Mining Stock Indices | ||||||||
| Gold Bugs Index (HUI) | 258.87 | 241.55 | (7.7)% | (6.7)% | down | down | neutral | |
| TSX Gold Index (TGD) | 292.16 | 288.20 | (5..1)5 | (1.4)% | down | down (weak) | neutral | |
| Fixed Income Yields/Spreads | ||||||||
| U.S. 10-Year Treasury Bond yield | 1.52% | 3.23% (new highs) | 2.2% | 112.5% | ||||
| Cdn. 10-Year Bond CGB yield | 1.43% | 3.41% (new highs) | 1.8% | 138.5% | ||||
| Recession Watch Spreads | ||||||||
| U.S. 2-year 10-year Treasury spread | 0.79% | 0.06% | (33.3)% | (92.4)% | ||||
| Cdn 2-year 10-year CGB spread | 0.48% | 0.14% | 75.0% | (70.8)% | ||||
| Currencies | ||||||||
| US$ Index | 95.59 | 104.49 (new highs) | 0.3% | 9.3% | up | up | up | |
| Canadian $ | .7905 | 0.7678 | (2.0)% | (2.9)% | down | down | neutral | |
| Euro | 113.74 | 104.94 | (0.2)% | (7.7)% | down | down | down | |
| Swiss Franc | 109.77 | 103.06 | 1.9% | (6.1)% | up (weak) | down | down | |
| British Pound | 135.45 | 122.16 | (0.8)% | (9.8)% | down | down | down | |
| Japanese Yen | 86.85 | 74.09 (new lows) | (0.4)% | (14.7)% | down | down | down | |
| Precious Metals | ||||||||
| Gold | 1,828.60 | 1,840.60 | (1.9)% | 0.7% | down (weak) | neutral | up | |
| Silver | 23.35 | 21.59 | (1.6)% | (7.5)% | down (weak) | down | neutral | |
| Platinum | 966.20 | 930.20 | (4.2)% | (3.7)% | down (weak) | down | neutral | |
| Base Metals | ||||||||
| Palladium | 1,912.10 | 1,798.70 | (10.5% | (5.9)% | down | down | down (weak) | |
| Copper | 4.46 | 4.01 | (6.6)% | (10.2)% | down | down | up | |
| Energy | ||||||||
| WTI Oil | 75.21 | 107.99 | (10.5)% | 43.6% | neutral | up | up | |
| Nat Gas | 3.73 | 6.94 | (21.6)% | 86.1% | down | up | up | |
New highs/lows refer to new 52-week highs/lows and, in some cases, all-time highs.
It was a week from hell. It was the worst week since March 2020. Except March 2020 was a panic because of the pandemic. This one seems to be more systemic and therefore more dangerous. It is also the worst start to a year since 1939. Nothing was spared. Pretty well all indices hit 52-week lows. All have entered official bear markets although the Dow Jones Industrials (DJI) remains just short. It was a week of lousy retail sales; lousy housing starts and the Fed hiking 75 bp which while expected was steeper than originally thought. The DJI closed under 30,000 for the first time since January 2021. The markets have been volatile with sharp up and down days and the market gapping down over the past week or so. On the week the S&P 500 fell 5.8%, the DJI down 4.8%, the Dow Jones Transportations (DJT) off 3.7%, the NASDAQ down 4.8%, the S&P 500 equal weight index down 6.9%, the S&P 600 (small cap) down 7.9% and the S&P 400 (mid cap) down 7.6%. The very broad-based Wilshire 5000 fell 6.0%.
In Canada the TSX Composite fell to 52-week lows 6.6% and the small cap TSX Venture Exchange (CDNX) also made 52-week lows losing 9.1%. In the EU the London FTSE fell 4.1%, the Paris CAC 40 was off 4.9% and the German DAX dropped 4.6%. In Asia China’s Shanghai Index (SSEC) was a winner rising 1.0% but not the Tokyo Nikkei Dow (TKN) as it lost 6.7%. The MSCI World Index was down 7.8% to 52-week lows and Bitcoin was slaughtered down 30.8% also to fresh 52-week lows. We discussed the crypto crash earlier.
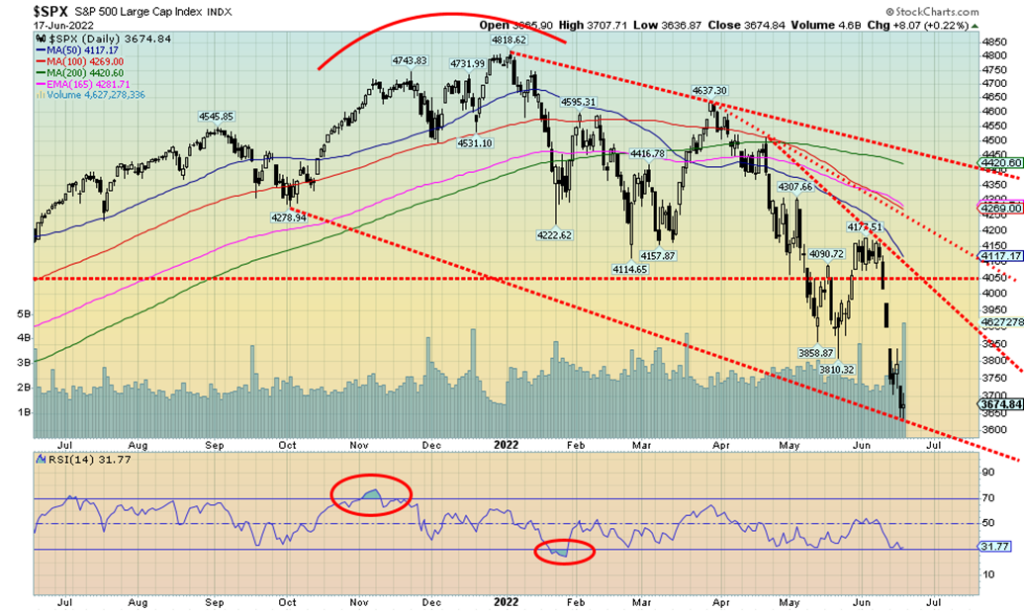
Has the S&P 500 bottomed? Is this capitulation? We can’t tell yet. There is potential for the S&P 500 to fall to 3,400/3,450 zone to complete this plunge based on the measuring gaps that have occurred so far. But we do believe we are getting near at least a temporary low but are loath to call a low until we see better signs. We wouldn’t even consider a bottom in until we regain above at least 4,000 and preferably 4,100. On the year the S&P 500 is officially in a bear market down 22.9%. The DJI is just shy of one down 17.8%, the DJT is in a bear market down 21.9%, while the NASDAQ has entered super bear market territory down 31.8% so far this year and down 33.3% from its all-time high seen last November 2021. With the Fed hiking rates aggressively and promising more aggressive rate hikes coupled with QT now in play we believe whether their intention is or not they are going to crash the economy to bring down the rate of inflation. As they say the Fed is throwing the economy under the bus. Of course, they won’t tell you that and White House officials can never admit the economy is in the sewer as that would spark a panic and a 50% plus drop could play out. Eventually we believe that’ll happen but not right now.
Ideally, we could be at a low or at least near one giving the points noted above. We are getting quite oversold although that is not a condition in itself to turn the market around. But a rebound is coming. A move above 3,850 would be our first clue for a potential low.
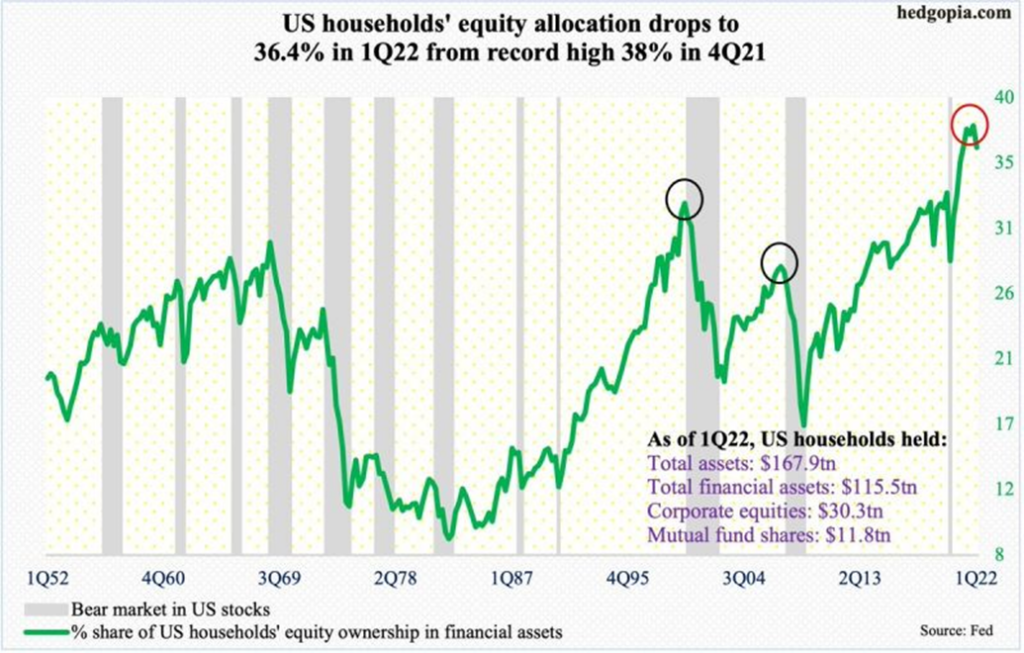
According to this chart courtesy of Hedgopia via the St. Louis Fed equity allocation for households peaked in Q4 2021 at 38%. It fell to 36.4% in Q1 2022 as the S&P 500 fell 5.0%. Since then, the S&P 500 has fallen another 19%. The high expectation is that this figure should be sharply lower at the end of Q2 2022. Levels recorded in Q4 2021 and Q1 2022 were higher than what was seen at the top of the dot.com bubble in 2000 and the 2008 financial crisis. Notice how precipitously the allocation fell during the inflationary 1970’s going from 30% in 1968 to 9.5% by 1982. But they fell sharply during the other periods as well from 38% in Q1 2000 to 22.5% in Q1 2003 and from 32.8% in Q2 2007 to 18.5% in Q1 2009. How steep a hit is setting up this time?
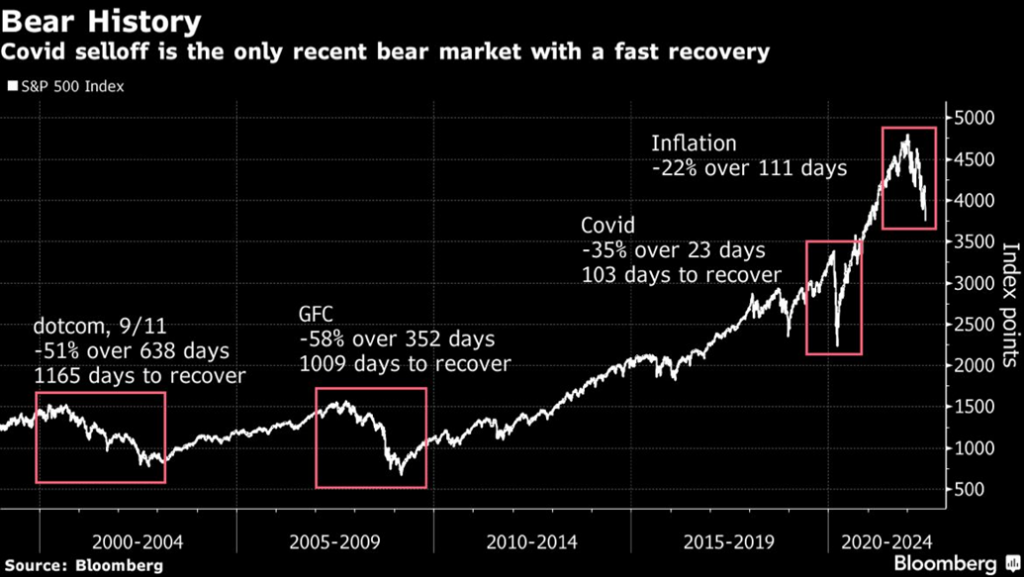
A nice illustration that shows bear markets don’t recover overnight. The longest was the Great Depression bear that did not see the DJI recover its 1929 high until 1954. On an inflation-adjusted basis it took until 1959. The dot.com crash took 1165 days to recover is 2000 high or 3.2 years. For the Great Recession financial crisis bear it took 2.8 years. On an inflation-adjusted basis it actually to 13 years to recover the 2000 high. Given the 2007 high for the S&P 500 was lower on an inflation-adjusted basis then the 2000 high it only took about 6 years to recover that high. The COVID crash was short and brutal so it covered quickly in less than 4 months. So how long will it take this developing bear to recover? We haven’t even found a bottom yet and we are five months into the bear. As we have noted in our main essay, we expect this bear to play out until at least 2023 and possibly into 2024. How long it takes to recover that 2022 high could take even longer.
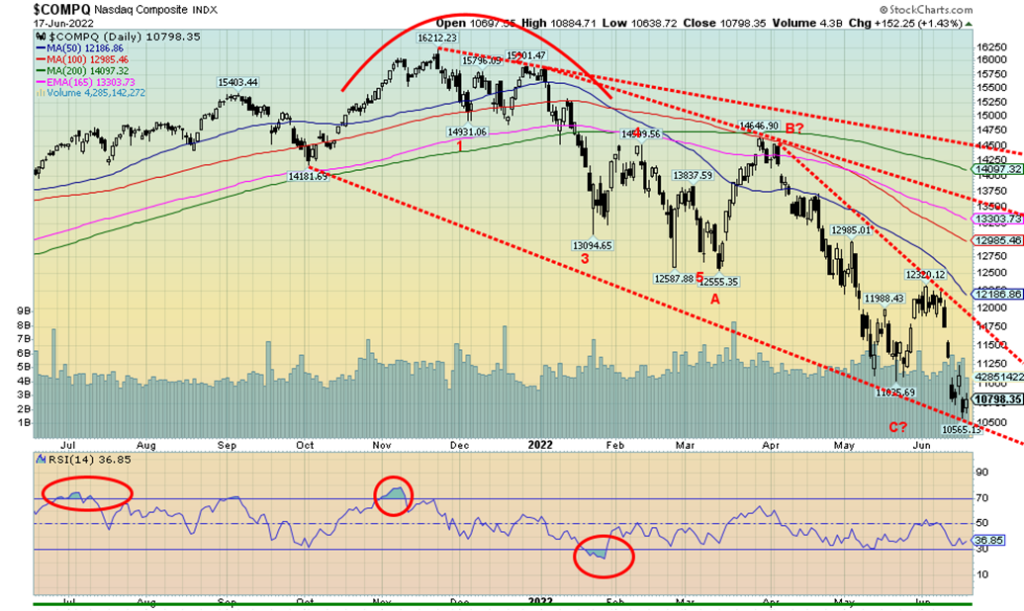
The NASDAQ is now firmly into major bear market territory now down 31% on the year. As with everyone else the NASDAQ made 52-week lows this past week. We are not at potential targets either as the NASDAQ could have targets down to 9,750 another 1,000 points below Friday’s close. The FAANG stocks continue to get hammered and many also hit 52-week lows this past week. Making 52-week lows were Meta -6.7%, Apple -4.1%, Amazon -3.1%, Microsoft -2.1% and Nvidia -6.5%. Even the granddaddy of value stocks made 52-week lows with Berkshire Hathaway losing 8.3% this past week. We doubt we’ll see Warren Buffett selling. More likely is they’ll be looking to scoop up bargains. Others were as follows: Netflix -4.1%, Google -3.2%, Tesla -6.7%, Twitter -3.1%, Baidu -2.1% and Alibaba -6.9%. A nasty week. The NASDAQ doesn’t confirm a low until minimum we regain back above 12,000. Don’t even think about new highs until we are back above 14,500. Given the depth of the plunge it could be months even years before the NASDAQ sees those highs again.
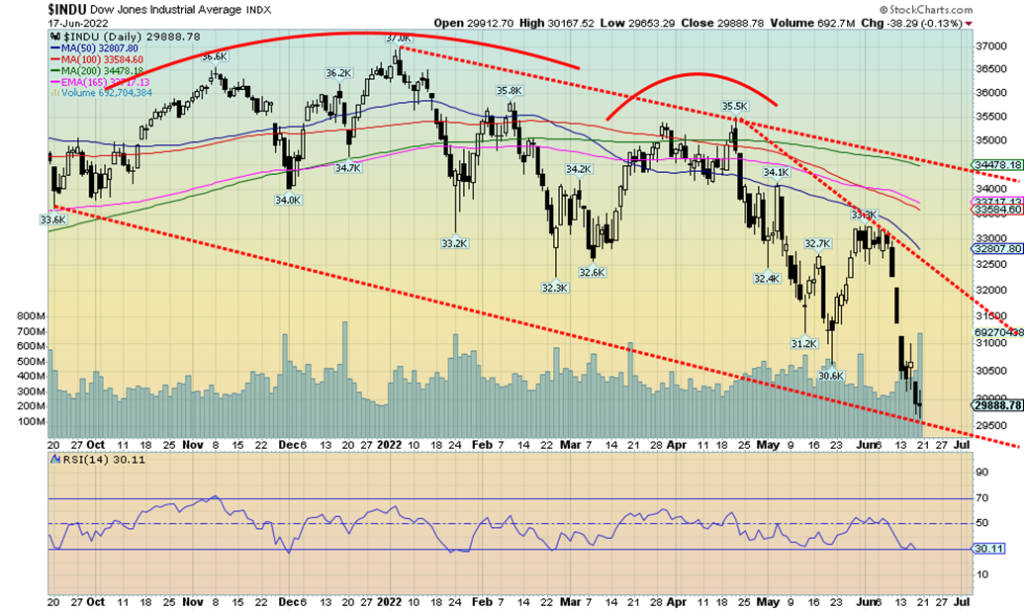
The Dow Jones Industrials (DJI) appears to be the only major index that has not officially entered a bear market. Even the Dow Jones Transports (DJT) plunged into a bear market this week down about 22% at week’s end. The DJI slipped below 30,000 this past week. Oversold signs are everywhere. But that doesn’t guarantee a bottom. There remains potentially more room to move lower to potential targets just under 28,000 before this market might find a low. Notice how volume has picked up. That is a potential sign of growing capitulation. The DJI is a long way from suggesting a low is in. We’d need to regain above 31,500 to suggest to us that a low is in.
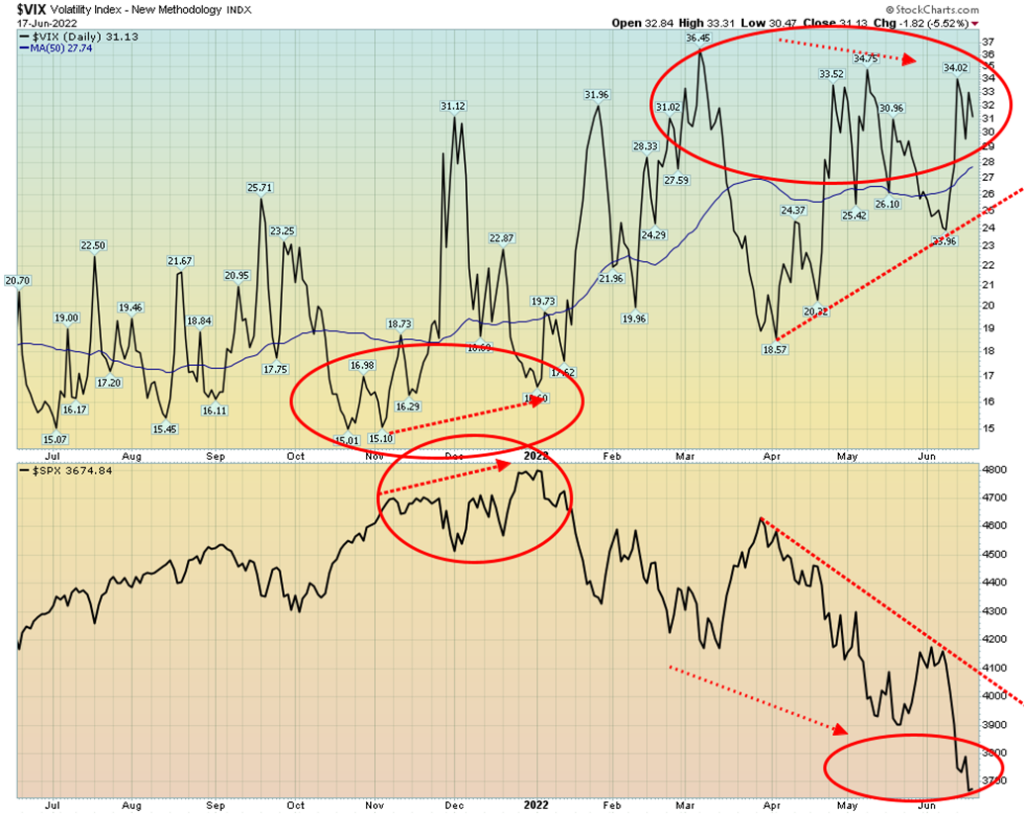
The VIX Volatility Index continues to diverge with the S&P 500. Note how the VIX is making lower highs while the S&P 500 makes lower lows (the VIX and the S&P 500 move inversely to each other). Note how back in November/December the S&P 500 moved to new highs but the VIX made higher lows. That divergence was the set-up for the plunge that eventually took place. Now we are seeing the opposite with the VIX making lower highs and the S&P 500 lower lows. Other indicators are also diverging such as the All-Bears and All-Bulls Indices. We note that the number of S&P 500 stocks trading above their 200-day MA has plunged to 12% the lowest level seen since the March 2020 pandemic collapse when it hit 5%. Similarly, the number of stocks trading above their 50-day MA is also at similar lows not only in 2020 but also 2011 and 2009. It is currently only 1.8%.
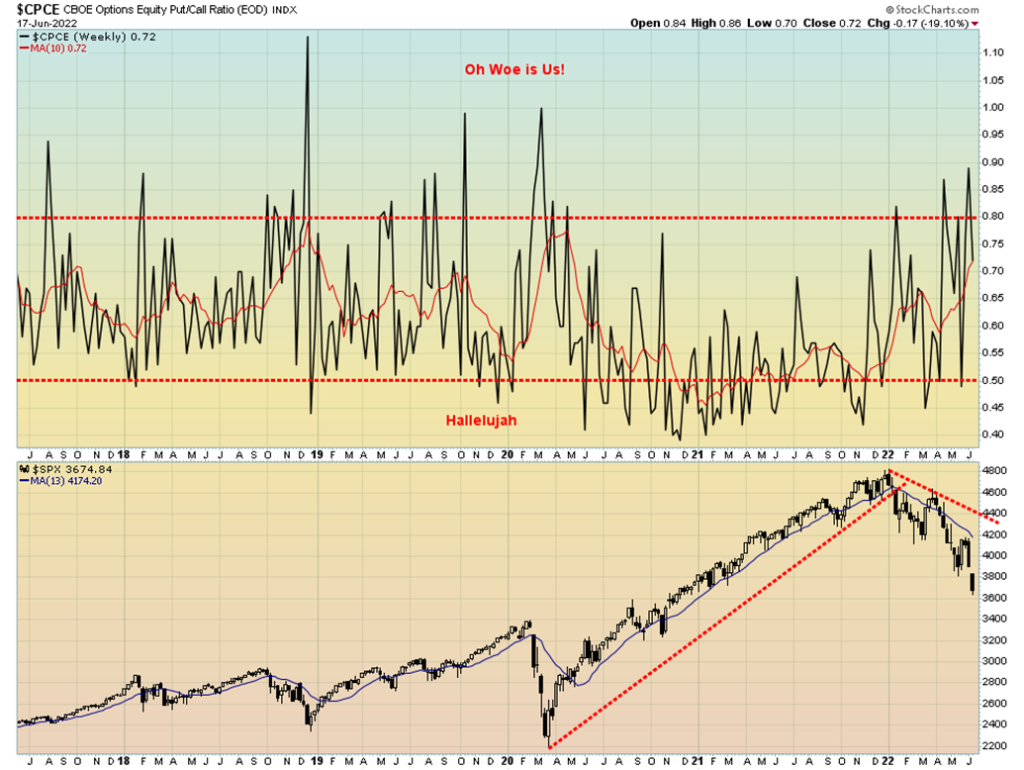
The put/call ratio spiked up to almost 0.90 but closed down at 0.72. It could be signaling a top but difficult to say just yet. We’d have preferred put/call ratio remained above 0.80 at least for a week. But it can be volatile. On the plunge this past for the record and disclosure we covered all of our puts. The reasoning was that usually plunges like what we saw this past week are not sustainable before buying comes in. As well it was a spike collapse which is usually terminal not the start of a new down leg.
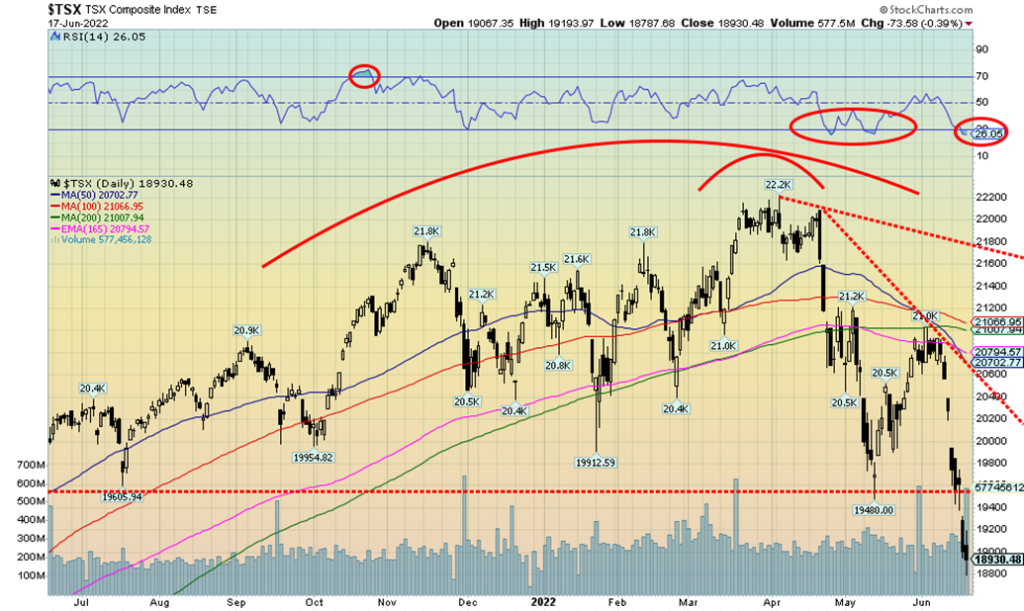
It has been quite the plunge for the TSX Composite over the past week or two. The TSX joined the U.S. stock indices plummeting to the downside as it lost 6.6% on the week and is now officially in correction territory down 10.8% on the year. The TSX also made new 52-week lows. Nothing was spared this week. All 14 sub-indices were down on the week led by Energy (TEN) that cratered 16.3%. Next up was Metals & Mining (TGM) down 8.0%. A slew of sub-indices made 52-week lows including Income Trusts (TCM) -6.4%, Consumer Discretionary (TCD) -3.7%, Financials (TFS) -4.8%, Health Care (THC) -3.8% (will HC ever recover?), Industrials (TIN) -2.3%, Real Estate (TRE) -6.9%, Information Technology (TTK) -4.7%, and, Telecommunications (TTS) -4.7%. The TSX has now plummeted past where we expected hitting down 18,800 this past week. From the March 2022 high the TSX is down 12.6%. Relatively the TSX has outperformed. Not so the TSX Venture Exchange (CDNX) was hammered down 9.1% this past week to fresh 52-week lows. The CDNX which is dominated by junior exploration stocks is now down 31.8% on the year. We need to regain back above 19,600 to suggest to us that low might be in. it was quite the plunge with some running gaps to the downside. But we’ve largely achieved objectives. And we note the RSI is now below 30 which means its oversold. However, that doesn’t mean it’ll rebound right away. Above 20,000 we’d feel comfortable that a low is most likely in. But we are long way from 21,000 and especially 21.800 that could signal further gains if they were taken out.
10-year Treasury Bond/Canadian 10-year Government Bond (CGB)
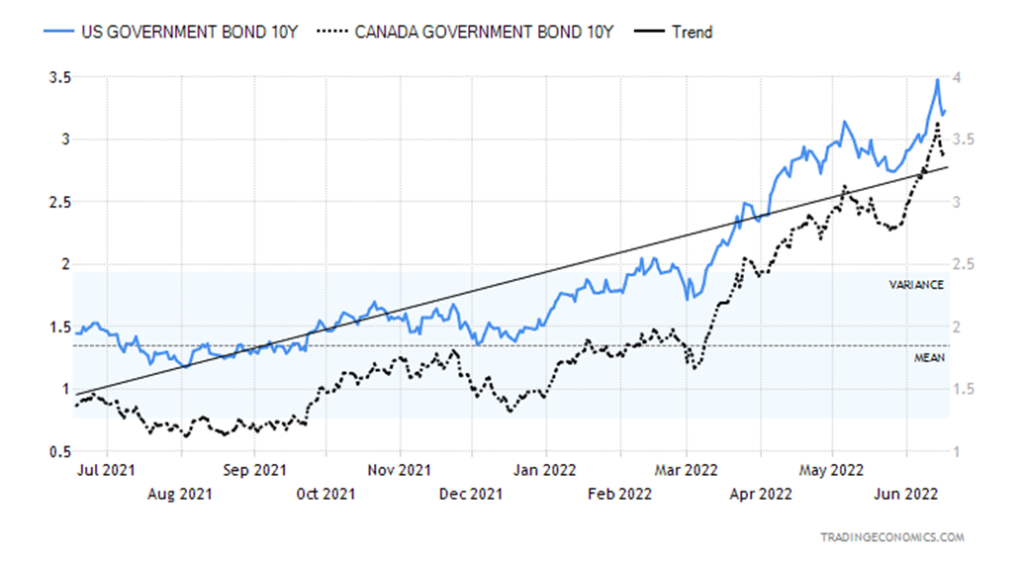
We see a reasonable chance that the U.S. interest rate yields may have topped. This week both the Canadian and the U.S. 10-year hit new highs with the U.S. 10-year treasury note hitting a high of 3.43% before pulling back to close at 3.23%. On the week the U.S. 10-year was up 2.2%. The Canadian Government of Canada bond (CGB) hit a high of 3.62% before closing at 3.41% up 1.8% on the week. The U.S. 2-10 spread narrowed to 6 bp from 9 bp but the Canadian 2-10 spread widened out to 14 bp from 8 bp.
The Fed hiked the key bank rate as had become widely expected by 75 bp 1.75%. But economic numbers were mixed. Retail sales for May fell 0.3% below the expected 0.3% gain. Y-o-y retail sales were up 8.1% but after inflation they would be negative. Ex auto/gas retail sales were only y-o-y an anemic 0.1% which means after inflation they were down on the year. The PPI for May came in at up 0.8% which was slightly above the expected gain of 0.7%. Y-o-y the PPI is up 10.8% better than expected 11.0% gain. Housing starts for May came in below expectations at 1.549 million vs. the expected 1.69 million. Housing starts were down 14.4% in May. The Philly Fed was at 64.5 below the expected 78. Initial jobless claims were 229,000 which was above the expected 215 thousand. Industrial production for May was 5.8% vs. 6.3% in April but above the expected 4.9%. Of interest this coming week is the existing home sales in the U.S. and the Canadian CPI rate.
A break of 3% would most likely signal that a high for the 10-year was in. We’d expect then soon after the 2-10 could turn negative. With some signs that the Fed rate hikes (and BofC) could slow the economy the 10-year could be poised to fall in yield, rise in price as prices move inversely to yields. That would make bonds potentially attractive at these levels.
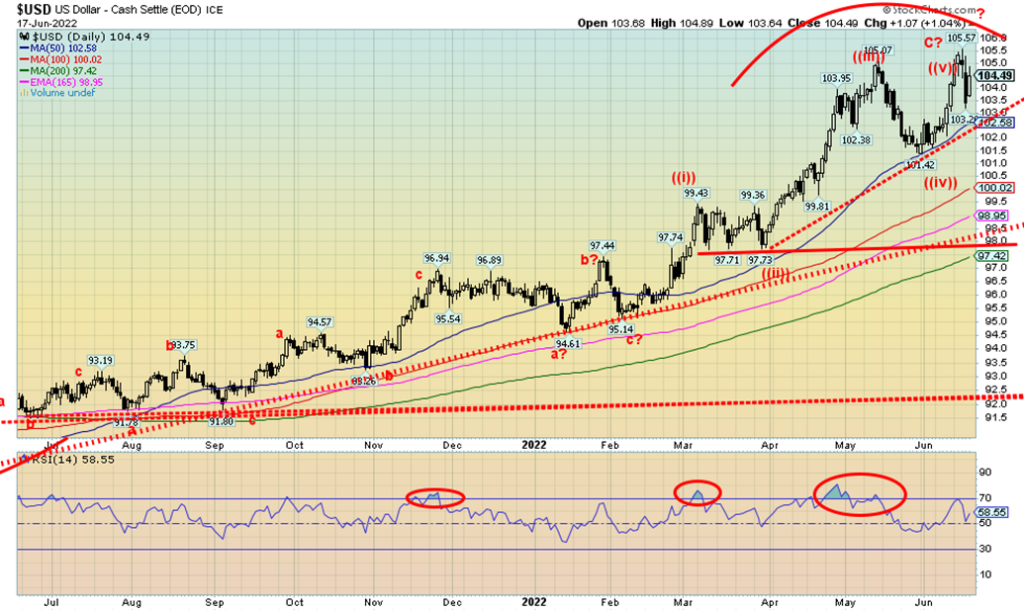
Has the US$ Index topped? We did push to new highs this week with the Fed rate hike. Of the G7 central banks the U.S. has the highest rate. While the UK hiked theirs Japan stood pat and it remains negative. That’s bad for the Japanese yen. So capital goes to the highest rate and the U.S. has that. The US$ Index rose 0.3% this past week as it fell sharply following the Fed rate hike on recession fears. But Friday it rebounded again. The Canadian dollar fell 2.0% as oil prices plummeted. The euro was down 0.2%, the pound sterling off 0.8% while the Japanese yen fell 0.4%. The Swiss franc became a safe haven and jumped 1.9% despite a central bank rate of negative 0.75%. It’s hard to tell just yet whether the US$ Index has topped. Usually, when we see this pattern with a slightly higher followed by a swift decline, we believe we’ve seen our top. If the US$ Index breaks back under that uptrend line currently near 102.60 then a top is most likely in. A breakdown under 101.42 the recent wave iv low would seal it. A breakdown under that level could target down to almost 97 in theory. The pattern from the February low appears to have unfolded in five waves suggesting we may have made our top. Only new highs now above 105.60 would tell us that the US$ Index rally is not over.
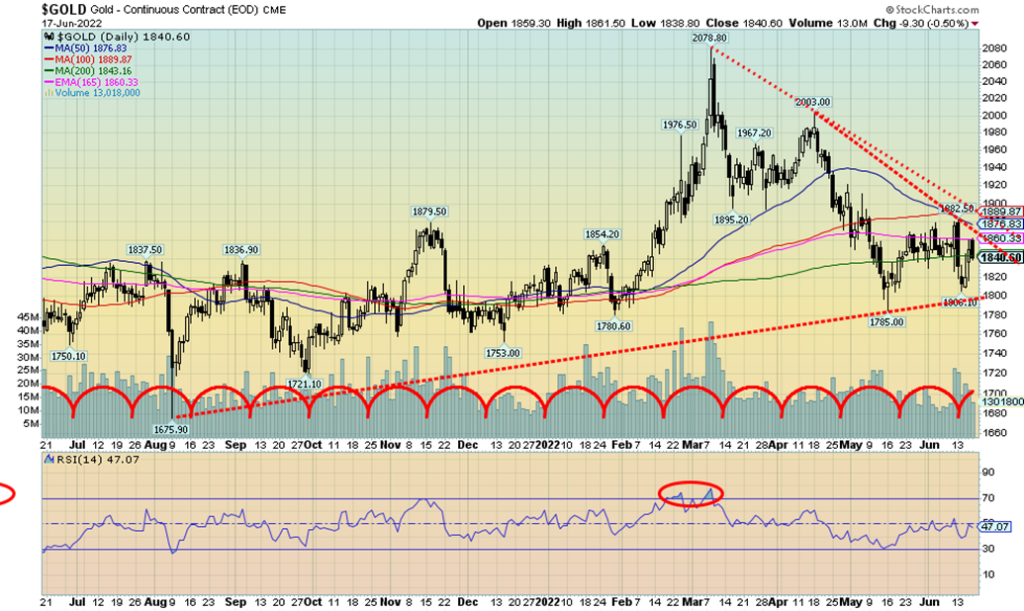
A strong U.S. dollar, rising interest rates thanks to rate hikes from the Fed and some other central banks all conspired to push gold prices down this past week. It was a roller coaster week with a sharp plunge followed later by a sharp up move. Friday gold gave back some of those gains and fell just short of breaking its downtrend line from the March high. On the week gold was down 1.9%. Silver outperformed and was only down 1.6% but platinum fell 4.2%. The near precious metals also fell with palladium down 5.7% and copper down 6.6% both falling on recession fears. It was recession fears that sparked the sharp up move for gold following the announcement that Fed hiked 75 bp. The hawkish Fed signaled potentially more 75 bp hikes in July and they announced their intention to get inflation back to the Fed’s long-term target of 2%. That could prove difficult as most of the reasons for high inflation are beyond the control of the Fed or even the U.S. White House. Well, unless they end the war and sanctions against Russia. That appears remote.
That’s the bad news. As we continually point out gold is outperforming the stock market. With gold actually still up on the year by 0.7% and the DJI down 17.8% it is no surprise that the DJI/Gold ratio has fallen 18.3% so far in 2022 in favour of gold over the DJI. The ratio is even more pronounced against the S&P 500, and, the NASDAQ. It’s less so against the TSX but both gold and the TSX Gold Index (TGD) are outperforming the TSX. While we’d all like gold to be up sharply on the year keep in mind that gold is doing its job as a hedge against the broader stock market not only outperforming stocks but also the bond market. This past week the TGD fell 5.1% while the Gold Bugs Index (HUI) dropped 7.7%. Even they are outperforming the broader stock market.
We are pleased with gold making a higher low to the May low of $1,785 and we sit on the cusp of breaking the downtrend. A move above $1,860 would be positive but it would be better above $1,890. Above $1900/$1,920 a bottom is confirmed. So far $1,800 has held as support with the $1,785 support just below. A break of $1,780 would not be good.
If the U.S. dollar starts to pull back as gave some signs this past week that would be positive for gold. Stagflation (weak economy, high inflation) would also be good for gold. We believe this coming period will more resemble the 1970’s with high inflation, a weak economy, weak stock market but strong commodities. Note as well the improved commercial COT discussed below. That helps as well. But we will be watching any rally closely because we remain concerned about the potential for that double top and we have moved into the early part of the period for us to see the 7.83 year cycle low and the 23-25 year cycle low.
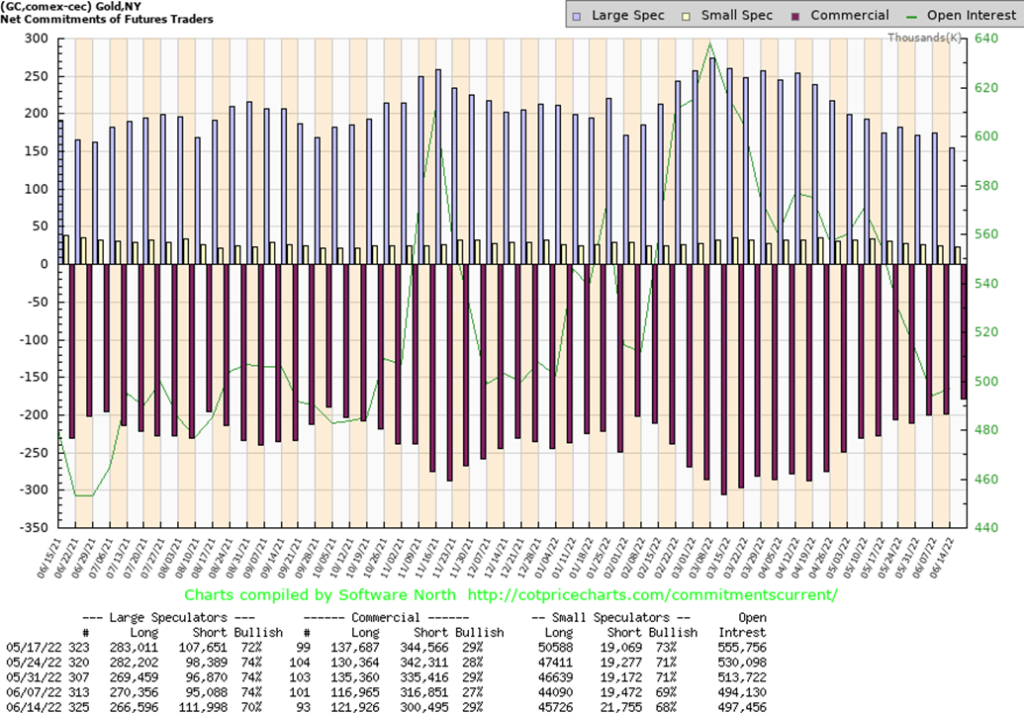
The gold commercial COT (bullion companies, banks) rose to 29% this past week from 27%. The commercial COT is now at its best level since last fall before an upward move. Long open interest rose roughly 5,000 contracts while short open interest fell over 16,000 contracts. The large speculators COT (hedge funds, managed futures etc.) slipped to 70% from 74% as they shed about 4,000 longs and added almost 17,000 shorts. Overall open interest barely budged up around 3,000 contracts. A positive report in terms of previous bullish reports.
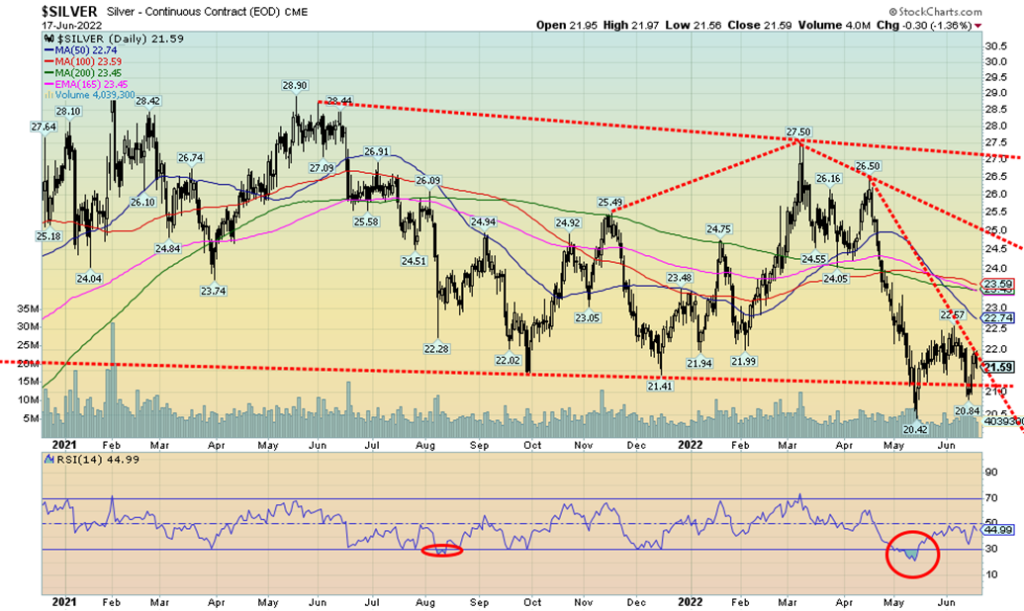
Silver prices fell 1.6% this past week. That was interesting because gold fell 1.9% and usually in downtrends and uptrends silver tends to lead. Despite the drop there are some positives. First as we note next the commercial COT improved from 40% to 42% the best level since last fall. Second this past week silver made a higher low before rebounding sharply. Silver finished the week on the cusp of breaking the steep downtrend line from April high of $26.50. We are working on a MACD crossover from the May low and this week’s gyrations did not turn the MACD down again. By Friday it was actually starting to rise again doing what we call a potential ‘kiss and run’. A ‘kiss and run’ occurs when the fast-moving MACD turns down and touches the slow moving MACD but fails to cross over. Once the fast-moving MACD turns up again it has a tendency to see the price run to the upside in this case. In other words, the uptrend could accelerate. It’s the opposite in a downtrend. a break back over $22 would give us a fresh buy signal. Initial targets could be the confluence of MA’s up around $23.50. A break over $23.75 would send silver higher to $25. A major breakout occurs above $27. Support is the low this past week near $20.85 and the May low near $20.40.
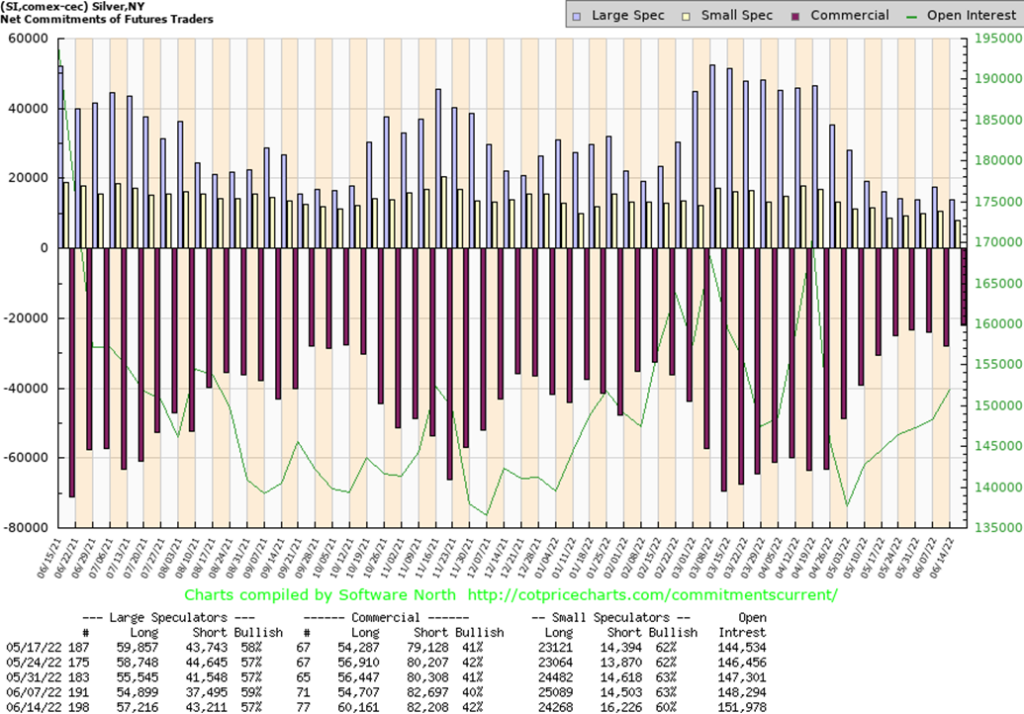
As with the gold commercial COT the silver commercial COT also improved this past week rising to 42% from 40%. That’s the best level since the fall of 2021 before an upward move took place. Long open interest rose roughly 5,500 contracts while short open interest held relatively steady. The large speculators COT slipped to 57% from 59% as they added roughly 6,000 shorts but also added about 1,500 longs. Overall open interest rose just shy of 4,000 contracts. A positive report in terms of past history.
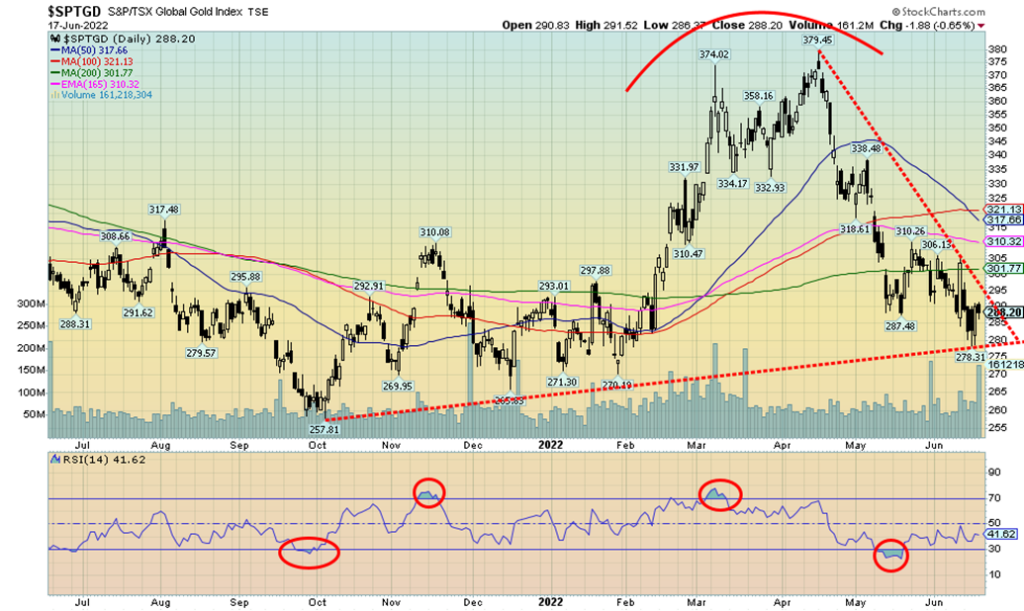
Oh, woe are gold stock prices. But the woe is limited given that the TSX Gold Index (TGD) is only down 1.4% in 2022 vs. the TSX Composite down 10.8%. Harder hit has been a number of junior stocks that trade on the TSX Venture Exchange. Keep in mind that the junior exploration stocks are more thinly traded and bids can just fade away knowing there are people desperate to get out of positions to raise cash or cover margin calls. Basically, nothing has changed at the companies themselves. It should give rise to bargains. The TSX Gold Index (TGD) fell 5.1% this past week while the Gold Bugs Index (HUI) dropped 7.7%. Both indices continue to outperform the broader stock market. The TGD broke to new lows this week for the current move. Still, we are down 24% from that April high of 379.45 in bear market territory. There is a fair bit of congestion below with the lows seen from October through January. The broad support range is from 255 to 270. Initially a break above 295 could give us a small buy signal. But we need to regain back above 302 to suggest to us that a low is most likely in. With signs that gold itself could be poised to move higher that’ll help the gold stocks. The gold stocks might even lead which would be quite preferable. What we don’t like about this drop is that appears to have fallen in 5 waves. That could suggest any rebound is a correction and it could fail the April high. The TGD breaks out above 320.
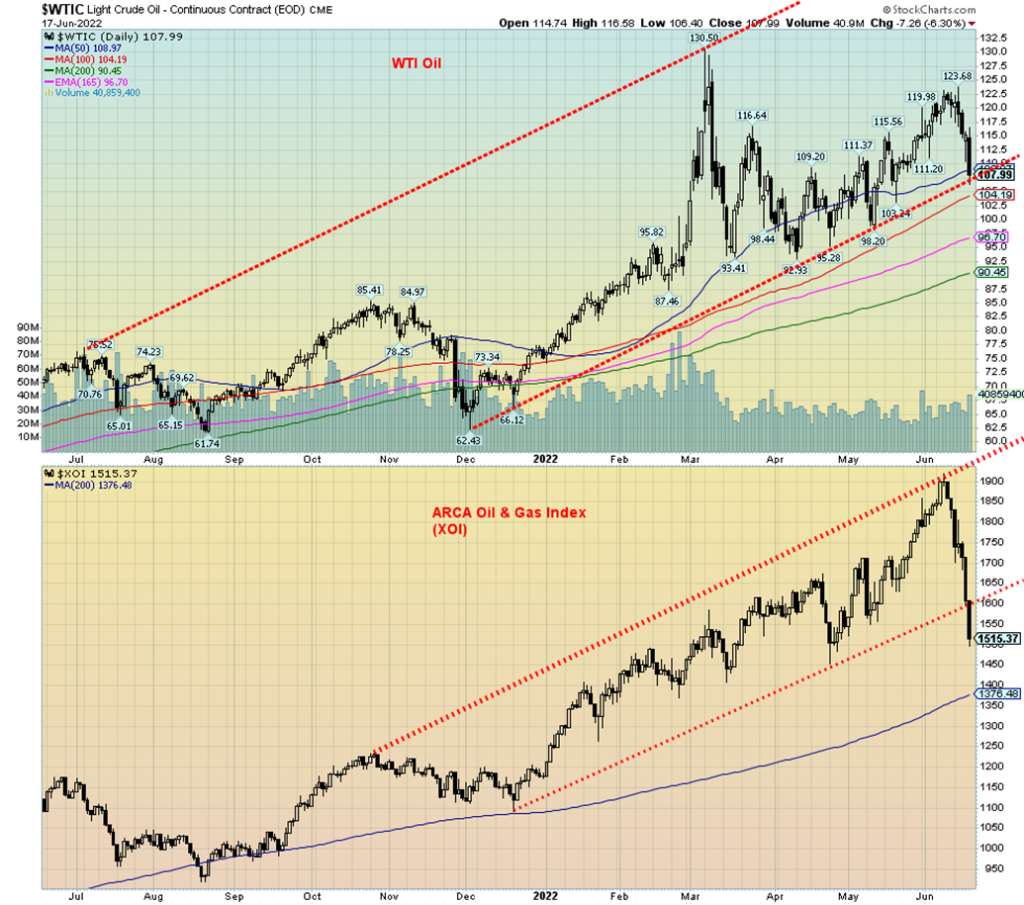
Recession fears are now overwhelming geopolitical fears and as a result WTI oil prices plunged this past week dropping 10.5%. Brent crude fell only 6.8%. The plunge spread over into the energy stocks triggering a wave of profit taking as the ARCA Oil & Gas Index (XOI) dropped 17.3% while the TSX Energy Index (TEN) fell 16.3%. Natural gas (NG) plunged as well dropping 21.6%. Bizarrely a fire at an LNG shipping facility in Texas is behind the drop as it prevents exports from leaving the U.S. putting available supply normally for export back in the domestic market. In the EU it had the opposite effect as NG at a Dutch trading hub (see chart below) leaped almost 43% this past week as Russia (Gazprom) cut gas supplies to the EU because of the inability to get a turbine back from Canada that has been under repair. Canada’s sanctions against Russia are preventing the return of the turbine. That now puts in jeopardy the ability of the EU to refill its tanks to 80% for the coming winter season. Further hindering the EU was putting sanctions on Russian oil. That also added to Russia holding back NG flows to the EU.
One could say what a confusing mess. But we look at the technicals and note that the XOI has broken uptrend support. This suggests to us that we will go through what will probably just be a correction. Since the low last August, the first wave up ended in October and that was followed by a drawn-out correction that lasted into December. Prices began to climb again and now we are starting what we believe is fourth wave correction. The first wave down of this correction was swift and steep. We suspect that this could be an A wave to the downside. Expect then this correction to play out as an ABCDE type. We could even test the rising 200-day MA currently near 1375. WTI oil has fallen to test their uptrend line which roughly coincides with the 50-day MA. If the uptrend is to remain intact, we shouldn’t take out the May low of $98.20. We could very well to start to rebound but only slowly back up the uptrend line. But a solid break under $107 could send oil prices lower to test next the 100-day MA near $104. One thing is for certain. This correction could result in some relief at the gas pumps.
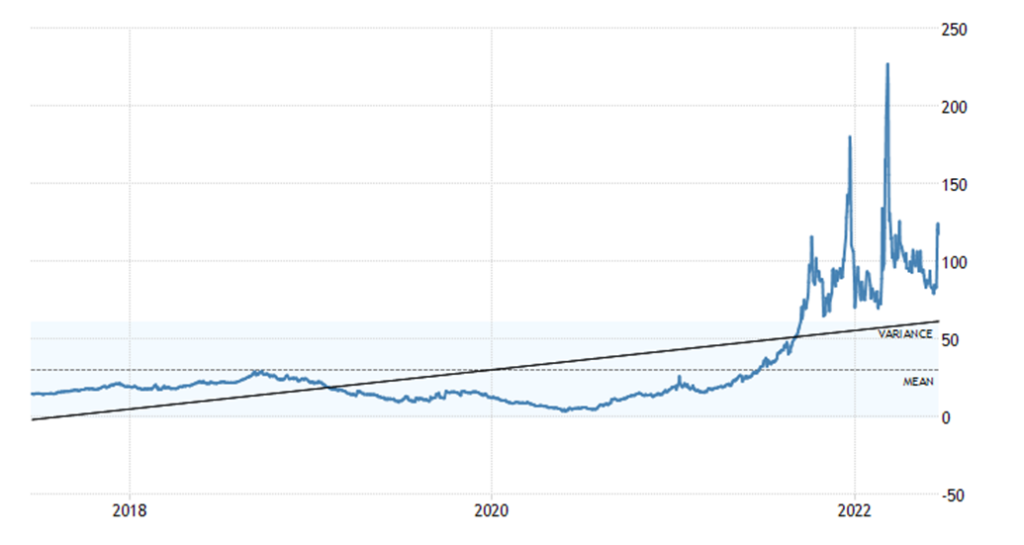
Below is a chart of EU natural gas at the Dutch Hub. It’s been exploding since tensions got underway with Russia/Ukraine. A few spikes were just that. But we could be starting another sharp rise. NG prices at the Dutch Hub are up 134% in the past year.
EU Natural Gas Prices 2017-2022
Copyright David Chapman, 2022
__
(Featured image by nosheep via Pixabay)
DISCLAIMER: This article was written by a third party contributor and does not reflect the opinion of Born2Invest, its management, staff or its associates. Please review our disclaimer for more information.
This article may include forward-looking statements. These forward-looking statements generally are identified by the words “believe,” “project,” “estimate,” “become,” “plan,” “will,” and similar expressions. These forward-looking statements involve known and unknown risks as well as uncertainties, including those discussed in the following cautionary statements and elsewhere in this article and on this site. Although the Company may believe that its expectations are based on reasonable assumptions, the actual results that the Company may achieve may differ materially from any forward-looking statements, which reflect the opinions of the management of the Company only as of the date hereof. Additionally, please make sure to read these important disclosures
David Chapman is not a registered advisory service and is not an exempt market dealer (EMD) nor a licensed financial advisor. He does not and cannot give individualised market advice. David Chapman has worked in the financial industry for over 40 years including large financial corporations, banks, and investment dealers. The information in this newsletter is intended only for informational and educational purposes. It should not be construed as an offer, a solicitation of an offer or sale of any security. Every effort is made to provide accurate and complete information. However, we cannot guarantee that there will be no errors. We make no claims, promises or guarantees about the accuracy, completeness, or adequacy of the contents of this commentary and expressly disclaim liability for errors and omissions in the contents of this commentary. David Chapman will always use his best efforts to ensure the accuracy and timeliness of all information. The reader assumes all risk when trading in securities and David Chapman advises consulting a licensed professional financial advisor or portfolio manager such as Enriched Investing Incorporated before proceeding with any trade or idea presented in this newsletter. David Chapman may own shares in companies mentioned in this newsletter. Before making an investment, prospective investors should review each security’s offering documents which summarize the objectives, fees, expenses and associated risks. David Chapman shares his ideas and opinions for informational and educational purposes only and expects the reader to perform due diligence before considering a position in any security. That includes consulting with your own licensed professional financial advisor such as Enriched Investing Incorporated. Performance is not guaranteed, values change frequently, and past performance may not be repeated.


Tilray Acquires HelloMD to Expand Medical Cannabis Digital Platform
Tilray Brands acquired HelloMD, a digital healthcare and medical cannabis platform, pending court approval on June 29, 2026. The deal...

Spanish Crowdfunding Market Reaches Record €761.6M in 2025, Driven by Real Estate and Crowdlending Growth
Spanish crowdfunding market reaches record €761.6M in 2025, driven by strong real estate dominance and rapid crowdlending growth, while donations...


Swedish fintech Lysa is preparing to enter the European ETF market
Swedish fintech Lysa is entering the European ETF market, registering its first ETF and expanding beyond its robo-advisor model. Managing...


Bitcoin Stalls Near $60K as Strategy Moves, ETFs Outflow, and EU MiCA Rules Take Effect
Bitcoin hovers near $60,000 with ETF outflows, while Strategy boosts reserves, sells BTC, and raises dividends to reassure investors. Ethereum...


Morocco’s Growth Holds at 4.6% as Agriculture Offsets Economic Pressures
Morocco’s economy grew 4.6% in Q1 2026, driven by a strong agricultural rebound offsetting declines in industry. Services expanded moderately...
 |
|
 |  |
 |
|
-

 Biotech2 weeks ago
Graph Therapeutics Secures $5M to Advance AI-Driven Precision Therapies
-

 Cannabis3 days ago
Cannabis Dominates Global Drug Use: Trends, Risks, and Shifting Markets
-

 Crowdfunding1 week ago
Ithaca: Climate Road Trip RPG on Climate Resistance
-

 Impact Investing1 week ago
ESG Gap Persists as Firms Struggle to Link Sustainability to Financial Value