Featured
Stock markets move higher; gold and silver enter corrective mode
The stock markets continued to wiggle their way higher towards the top of the broadening channel. Gold and silver have moved into a corrective mode, which should address some of the extreme bullishness. The inverted yield curve got less inverted last week as interest rates jumped higher due to improved trade talks between the U.S. and China and some decent economic numbers.

Friday the 13th came early for John Bolton, Trump’s former National Security Advisor. Bolton joins a long list of casualties of the Trump administration. Most resigned, but several high-profile ones like Bolton were fired. Bolton was the third National Security Advisor since Trump’s election. Number 4 in four years is about to be appointed.
Firing was a specialty of Donald Trump from his days as host of the TV series The Apprentice (2004–2017), where he actually fired people faster and more often than he has during his time as president. Trump also leaves behind a long list of business failures. He became president of the U.S.A. “Hey, it’s a crazy world.”
One who is still there is Jerome Powell, Chair of the Federal Reserve since 2018. Powell may have been appointed by Trump but, unlike Bolton, he does not actually report to Trump. The Fed is considered an independent central bank because its decisions are not approved by the president or his administration. Nor does the Fed receive funding from Congress and the terms of its board of governors span multiple presidential and congressional terms. In his latest salvo, Trump referred to the Federal Reserve as a “bonehead” for not lowering interest rates to zero or lower.
“The Federal Reserve should get our interest rates down to ZERO, or less, and we should then start to refinance our debt “INTEREST COST COULD BE BROUGHT WAY DOWN, while at the same time substantially lengthening the term. We have the great currency, power, and balance sheet.”
“The USA should always be paying the lowest rate. No Inflation! It is only the naïveté of Jay Powell and the Federal Reserve that doesn’t allow us to do what other countries are already doing. A once in a lifetime opportunity that we are missing because of ‘Boneheads.” —Donald Trump, tweets, September 11, 2019
Despite years of either zero interest rates and even negative interest rates, coupled with massive buying of financial assets (quantitative easing QE), along with large budget deficits and monetizing deficits, growth in the economies of the EU, Japan, and the U.S. can best be described as sluggish—with the U.S. leading the way. Estimates for GDP growth in 2019 are U.S. +2.2%, Japan +1.0%, and the EU +1.3%.
What worked in the past no longer seems to be working. However, all the mainly monetary stimulation has created is a series of bubbles in numerous asset classes and debt has exploded. As to fiscal policy, governments are reluctant to go into huge deficits. Given the massive expansion of debt, coupled with historically low-interest rates and QE, the fact that growth is sluggish suggests that the central banks’ monetary policy is no longer effective. As some say, the central banks have run out of ammunition.
Workforce and jobs generation
While governments globally are running budget deficits, the reality is that, rather than generating jobs through infrastructure building, the deficits have been largely created by cutting taxes that have mainly benefited the wealthy. Nor did the vast quantities of QE necessarily reach down into the broader economy. Over 17% of the workforce is part-time and many more belong to what is become known as the “gig” economy working on contract. Millions are listed as “not in the workforce” and not all of them are retirees, stay at home moms, disabled or full-time university.
In the U.S. the official unemployment rate is 3.7% but as Shadow Stats points out when you take into consideration the discouraged workers deemed no longer in the workforce through a redefinition back in 1994 plus part-time workers seeking full-time work the real unemployment rate is 21.2%. As well today the labor participation rate in the workforce is at levels last seen in the early 1970s.
Widening wealth gap, trade war
Since the 1980s, the wealth gap has been growing such that inequality in the Western countries is as high today—and in some cases higher—than it was before the Great Depression. The Gini coefficient or Gini Index measures the wealth distribution of a nation. The coefficient ranges from 1 to 100 where a Gini of 1 suggests absolute equality and a Gini of 100 suggests absolute inequality.
Calculations tend to lag by a year or two or more. According to the World Bank, South Africa has the highest Gini Index at 63 in 2014. The lowest belongs ironically to Ukraine as of 2015. The U.S. was at 41.5 in 2016, however, the CIA measurement has it at 47. Canada is at 34 in 2014 according to the World Bank and 32.1 by the CIA.
Gini Index U.S.A., 1913-2009

Finally, trade wars and the power struggle between the U.S. and China are taking a toll. The struggle between the U.S. and China is one of the existing power (U.S.) vs. the rising power (China). This struggle has historical precedents in Britain vs. Germany (late 19th—early 20th century), Britain vs. France (late 18th—early 19th century) and Britain vs. Spain and Netherlands (17th century). All these conflicts involved trade wars and eventually led to real wars. These “Great Powers” conflicts go back to ancient times as well.
A looming deep crisis
Combined, these have the potential to be lethal and plunge the world into a deep crisis if and when the next economic downturn occurs. Economic collapse and depressions are all about debt collapse and, in a world laden with debt, the odds of the world escaping another crisis is slim to none. Unlike the financial crisis of 2008, there would be no bail-outs. Instead, legislation has been passed in the Western countries for bail-ins. Meaning, if the banking system were to fail once again, debt holders and depositors would be at risk of having their debt and deposits converted to equity. The taxpayer would not be the lender of last resort as was the case in 2008.
By many measurements, the Western economies are tapped out—except the debt keeps on growing. Global debt is in excess of $250 trillion and could surpass $300 trillion in the next few years. U.S. total debt (governments, corporations, consumers) is $74.2 trillion and the total debt to GDP is 347%. National government debt is expected to hit $30 trillion before 2030 and it could be even higher, given that current budget deficits are exceeding $1 trillion annually.
When the U.S. takes into consideration Social Security liability, Medicare liability, and unfunded liabilities, debt totals $176.6 trillion, giving the U.S. a staggering 1,172% total debt to GDP ratio. A recent study suggested that the U.S.’s real debt to GDP is about 2,000%. That is astounding. The debt will never be repaid—it will be a burden on future generations and remain a major drag on economic growth. One only has to look at Japan to realize the extent of what amounts to a permanent or at least an ongoing rolling recession.
Interest rates are at all-time historical lows. They can’t afford to rise given the enormous amount of debt as it would most likely spark a debt crisis. No wonder they want to push them to zero and even lower. Savers suffer but debt issuers are spared the burden of high interest rates. Even a historical rate of 5% could bring down the financial system.
Economic & Financial Indicators G7 + China
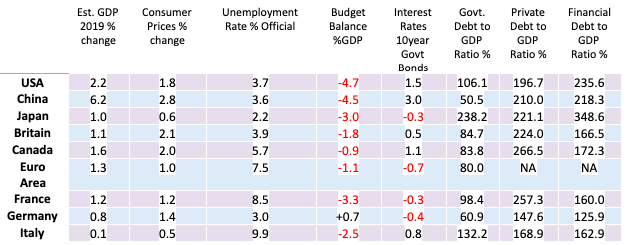
Note 2. Private sector debt – includes non-financial corporations, households, non-profit institutions. Data as of 2018.
Note 3. Financial sector debt to GDP ratio % data is as of 2018 except Canada 2008.
©David Chapman
Our table shows the extent to which debt has become a huge blanket over the Western economies. Are we about to become basket cases like Ukraine, Argentina, and Zimbabwe where the only way is default? Not likely. While government debts are high, the real concern lies with corporations, households, and the financial sector—that is where the defaults will come from. No wonder a proposal from some U.S. Democratic presidential candidates is to forgive student debt.
This debt will hang on ex-students for years, preventing them from forming households, getting married, having kids, etc. This is particularly a concern in an economy that is increasingly known as a “gig” economy with part-time contractual unstable jobs and the threat of technological change (AI, robotics) hanging over the heads of millions of workers.
U.S. 10-year Treasury Note vs. Effective Fed Funds vs. Annual Rate of Change GDP

Our long-term chart of effective Fed Funds vs. the U.S. 10-year Treasury note shows not only the rise and fall of interest rates but how, following the inflationary 1970s, each recession triggered an increasingly steeper drop in the Fed Funds rate. Also, superimposed on the chart is the annual rate of change of GDP. Note that following each subsequent recession GDP growth was slower than it was the previous time.
However, lower interest rates coupled with QE or some form of massive liquidity injections helped to trigger sharp rises in the stock market. Some might refer to this as creating bubbles. While the unemployment rate has fallen following each recession, the part-time economy has continued to grow and been a major beneficiary. But much of the funds from QE and other forms of liquidity injections went into speculation and the stock market.
The number of billionaires has grown sharply over the past decade and wealth inequality has also grown. This in turn has triggered what might known as the “politics of resentment” and a sharp turn to populist politicians. This was also seen in the 1920s with a strong shift to fascism, particularly in Europe with the rise of Nazism in Germany, the Black Shirts in Italy, and many more forms in Latin America and North America as well. Populism can be either left or right and code words are “for the people” and attacks against the so-called “elites.”
Effective Fed Funds vs. S&P 500

Our chart above of Fed Funds (FF) vs. the S&P 500 shows how huge cuts to FF helped trigger a sharp rise in the S&P 500. But after years of a sharply rising stock market will it work again? Pundits keep pointing at the inverted yield curve that suggests an impending recession. But that could still be months away, given the history of the inverted yield curve. Once the yield curve reverts to normal, then we should start worrying about a recession.
We are now moving into the end-game of the debt cycle. The next few years threaten to deliver a recession, potential debt collapse, and increased volatility with sharp moves in all markets both up and down. One potential safe haven is gold, given its long history as a standard and its characteristics as a diversifier that’s non-correlated to other assets and as a long-term store of value. Gold prices have soared to record highs recently with a host of other currencies, including the Canadian dollar. This suggests that the gold in U.S. dollars should eventually follow.
Gold as safe haven
Gold is perceived as a safe “harbour” during periods of economic and political uncertainty and a loss in the faith in government. Given low interest rates, particularly negative interest rates that prevail in the EU and Japan, gold becomes an attractive alternative to holding bonds. Many investors have done just that, selling their bonds and buying gold instead.
The safest way to hold gold is in physical coins and bars. Holding gold stocks is not the same as holding gold as gold stocks are paper (like any stock) and subject to market forces. During previous market collapses such as the 2008 financial crisis, gold stocks were amongst the worst performers, even as gold itself outperformed everything else. The same was seen during the 1987 stock market crash. There are also gold ETFs and gold funds, both mutual and closed-end.
Ray Dalio of Bridgewater Associates has referred to this as a paradigm shift. What he means by that is we are now entering a period where “If/when there is an economic downturn, that will produce serious problems in ways that are analogous to the ways that the confluence of those (three) influences produced serious problems in the late 1930s.” We agree and, as he also notes, one should diversify to protect oneself against them.
Markets and trends

With the U.S. and China talking nicely to each other once again; thoughts of lower interest rates especially given President Trump’s push on Jerome Powell to lower rates; economic numbers while not exactly gangbusters are at least showing the U.S. economy to continue to chug along; the stock markets rose for a third week in a row.
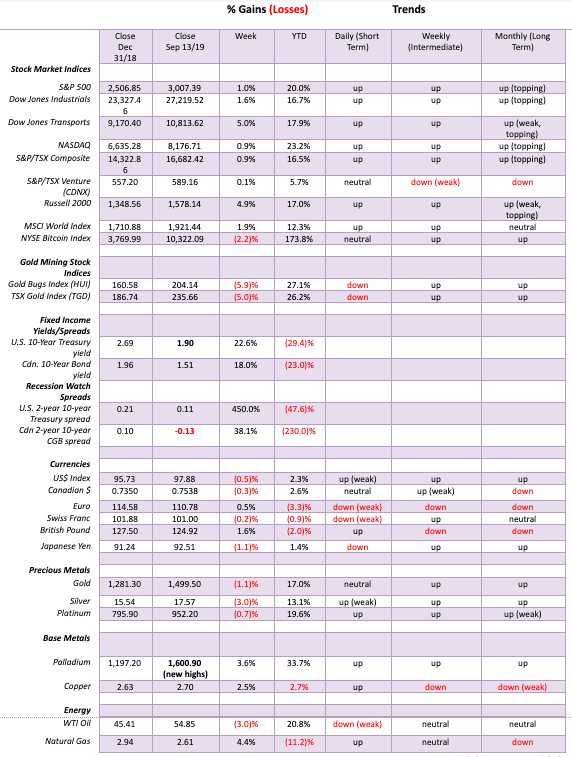
The S&P 500 gained 1.0% this past week while the Dow Jones Industrials (DJI) was up 1.6%, the Dow Jones Transportations (DJT) jumped almost 5.0%, and the NASDAQ was up 0.9%. In Canada, the TSX Composite gained 0.9% and the TSX Venture Exchange (CDNX) was up 0.1%. On the other hand, the EU saw the London FTSE gained 0.6%, the Paris CAC 40 was up 1.0%, and the German DAX jumped 2.3%.
In Asia, China’s Shanghai Exchange (SSEC) gained 1.0% and Japan’s Tokyo Nikkei Dow (TKN) was up 2.8%. Some indices even made new all-time highs as the Dow Jones Composite (DJC) gained 2.1% on the week. A week earlier the Dow Jones Utilities (DJU) made new all-time highs. They were slightly short this past week. This will be important to watch going forward as to who makes new highs and who doesn’t. If we are correct about where we are going, some will make new highs but others won’t, resulting in major divergences that are normally seen at significant tops and bottoms.
The S&P 500 is rapidly approaching the top of what we believe is a broadening channel. That top is seen near 3,045, only slightly above the previous high of 3,028. If the S&P 500 were to break above that level and give the sense of a major breakout, we note the top of what appears as a huge ascending wedge triangle is just above near 3,070 to 3,075. Either way, we believe we are approaching a potentially significant top. Volume has been contracting on the rise. Leadership is lacking as the gains are being generated by fewer stocks. The NYSE new highs-new lows index has been falling although it has not as yet turned negative.
Interpretation 1
We did not put a wave count on the chart above as there are alternative interpretations of where we are. Interpretation 1 is that the markets topped back in January 2018 and have since been making a series of waves forming the broadening pattern. Wave A down was the drop between January and February 2018 that made its final low in early April 2018. Wave B up was the run to the high in September 2018. Meanwhile, Wave C down bottomed in December 2018. We have been working on wave D. Once complete, we should collapse to the bottom of the channel near 2,200 to form the E wave. A new up advance would follow.
Interpretation 2
Interpretation 2 is that we made the final top in September 2018 and since then we have had wave A down into December 2018 and we are working on wave B up. To follow will be wave C down that would take us below the bottom of the channel near 2,200. A rebound rally would then get underway after that.
Either interpretation suggests that, once we make our top a significant decline should get underway. Raising cash as the market moves higher makes sense. We noted that it is not unusual to see important tops into October. The most significant ones we can think of are September/October 2018 and October 2007. There was also an important top in September 2000. All of these highs came before a significant market drop even as September and October are often associated with bear markets. With too many channels lying just above, we believe the odds of embarking from here on a major bull market are slim to none.

NASDAQ
The NASDAQ looks similar to the S&P 500. The NASDAQ has been quite choppy since the top back in April with a drop, a rise, another drop, and now another rise. We call these zigzag patterns. They are not unusual if the market is headed into a top (or even bottom) as they help form what appears to be here an ascending wedge triangle pattern. Ascending wedges are bearish. But the top may not come until deeper into the triangle, which is why one can see it move to new highs, with the bulls proclaiming that a new bull market is in force. Look for euphoria at new highs. The NASDAQ could rise to 8,400 or slightly higher before running into the top of the channel.

NYSE McClellan Index
The NYSE McClellan summation index ratio adjusted (known as the RASI) has turned bullish once again with a reading currently at 695. Any reading over 500 says the market is bullish. As one can see, the RASI has been a bit choppy of late reflecting the current uncertainty. A divergence would occur if the S&P 500 were to make new highs but the RASI does not. As a side note, the NYSE advance/decline line continues to advance, although it faltered a bit towards the end of the week. The AD line continues to say that the market is going higher.

We rarely note the NYSE short-term trading arms index (TRIN). The TRIN compares the number of advancing and declining stocks to advancing and declining volume. It is a measurement of market sentiment. The TRIN is bullish when it is below 1 and bearish above 1. Quickly, the TRIN has gone from above 1 to below 1, suggesting that the recent rise in the stock market has been accompanied by a wave of positive bullishness once again. The TRIN is currently at 0.73. A drop below 0.50 suggests the market has become overheated.

VIX volatility indicator
No surprise that with the stock market rising, the VIX volatility indicator has been falling. We’ll keep an eye on at 12 where the last low was seen back near the July top. Note how the VIX has become more volatile of late with the ups and downs more pronounced. Ideally, we’d love to see the S&P 500 make new highs but the VIX not confirm with new lows. Irrespective of this, the VIX is nowhere near its lows of late 2017 when it was down near 9. That was before the January 2018 top. Now, even as the S&P 500 made new highs in October 2018 and again in July 2019, the VIX did not confirm with new lows.

Small cap stocks tend to be the leaders in both bull and bear markets: they lead to the upside and lead to the downside. For the past several months that has not been the case as we’ve seen the large-cap S&P 500 outperforming the small-cap Russell 2000. Except that a strange thing happened—this past week the ratio gapped lower, suggesting that the small-cap outperformed the large-cap. This is worth watching as the market churns higher. Could the small caps be suggesting that the market will climb higher?

With the stock markets rising, it will be important to watch the divergence between the DJI and the DJT. The DJI is rapidly approaching its previous all-time highs. The DJT remains well off its highs but may have broken out this past week. So, this divergence remains important to watch going forward. Divergences are usually seen at tops and bottoms. The current divergence between the DJI and the DJT is signalling that another drop could lie ahead.
U.S. Retail Sales Month over Month

U.S. Retail Sales Year over Year

Retail sales surprised to the upside in August, rising 0.4% from a month earlier. This followed a revised 0.8% gain for July. The market had expected a gain of only 0.2%. For the bulls this was welcome and it helped the stock market rise this past week. The bulls will soon be chiming “recession, what recession?”
U.S. Consumer Confidence

The consumer confidence index rose to 92 for September from 89.8 in August. Improved trade talks between the U.S. and China helped boost consumer confidence. This is a positive development to help keep the economy humming, even at a reduced level.

TSX Composite
The TSX Composite underperformed this past vis-à-vis the U.S. markets, gaining 0.9%. The TSX appears to have broken out of a sideways pattern that has prevailed since March. Could this be signaling further gains ahead? It’s certainly possible. The pattern suggests a potential move to 17,300. We note, however, that the top of what may be a broadening channel is up near 16,900 to 17,000. The TSX Venture Exchange (CDNX) also enjoyed an up week, gaining a small 0.1%.
The gainers last week included consumer discretionary +0.6%, energy +5.6%, financials +3.6, global mining +1.9%, health care +0.2% and telecommunications +0.7%. Losers were led by gold -5.0%, income trusts -0.9%, consumer staples -1.8%, industrials -1.2%, materials -2.1%, real estate -0.6%, information technology -3.5% and utilities -0.6%. If longer-term interest rates are rising, avoid utilities, real estate, and income trusts but financials might benefit because of better spreads.

Bitcoin is falling
The DJI may be rising but Bitcoin is falling. Well, it’s not collapsing but Bitcoin did not follow the DJI higher this past week. We continue to be intrigued by how Bitcoin and the DJI seem to follow each other both up and down. Not exactly, of course. But we note last year when the DJI was making its rise into October 2018 Bitcoin did not follow. The next move was a sharp down. It’s mind-boggling that 2,810 cryptocurrencies are still listed at Coin Market Cap.
The market cap of all cryptos is $266.9 billion of which Bitcoin, at $186.4 billion, makes up 70% of the market. Doesn’t leave much for the other 2,809. There are 15 cryptos listed with a market cap of over $1 billion. The big three—Bitcoin, Ethereum, and XRP make up 81.6% of the market. With Bitcoin appearing to roll over, our bet is that will eventually translate into the DJI also falling.

Interest rates
Have interest rates bottomed? It appears they may have with the low on the 10-year U.S. Treasury note at 1.47%. Now it is at 1.90%. Retail sales helped as did a somewhat strong consumer confidence number this past week. Rising yields like this are not going please President Trump who wants lower interest rates, not higher ones. Trump’s call for lower rates is typical of someone with a borrower’s mentality. Trump had a habit of leveraging himself up with debt during the good times, and then when the bad times came, he was overleveraged.
Low interest rates are terrible for savers but great for borrowers. Trump harps on Fed Chair Jerome Powell to lower rates, but Trump should pay attention to long rates as well. The Fed doesn’t control long rates the way they do the short rates. The rise this past week seems to have taken out a downtrend line and also closed over the 50-day MA. Next targets could be the next down trend line near 2.10%. We believe a low is in. Rising rates in a world laden with debt could eventually bring out the skeletons with bond blow-ups.
The FOMC meets this week September 17-18. The market widely expects the Fed to cut another quarter of a point.
Recession Watch Spread

Given the strong backup in the 10-year yield, this past week the 10-year—2-year spread rose to 11 bp this past week. The spread was only briefly negative earlier, hitting a low of negative 4 bp. Recession fears appear to have abated for the moment.
Recession Watch Spread 2

The other closely watched recession spread is the 10-year U.S. Treasury note less the U.S. 3-month Treasury bill. That spread rose to negative 6 bp this past week from negative 41 bp the previous week. There is some history of the negative spread bouncing back and forth for some time. If you do note, however, the stock market doesn’t usually start to fall until the spread turns positive again following a period of a negative spread. For that reason, we are more concerned that the stock market might fall and a recession could be at hand when the spread turns positive again.

US dollar vs other currencies
The US$ Index continues to confound and confuse. On one hand, we may have made our high for the US$ Index, but on the other hand it could still hang on and move up again. Gold had been rising even as the US$ Index recently but last week gold fell even as the US$ Index also fell. The US$ Index overall fell 0.5% this past week.
The euro benefitted, rising about 0.5%, the Brexit-challenged pound sterling shrugged off the antics of Boris Johnson and Brexit and rose a strong 1.6%, while the Swiss franc slipped a small 0.2%. The Japanese yen took a tumble, losing 1.1%, so it was not surprising to see gold fall because the yen and gold seem to have a strong positive correlation. The Canadian$ fell about 0.3% on the week.
Since our outlook on gold is slightly negative going forward for the next few months, we can’t rule out another stab to the upside by the US$. There remain potential targets up to around 100.80 for the US$ Index. A firm break under 97.50 would suggest further declines to stronger support near 96.80. The major support line is seen at 96.00.
Another breakout above 99 would suggest that the US$ Index could make a run to our upper target near 100.80. The US$ Index tends to improve when it appears that the U.S. and China are starting to make nice. Trump wants to get re-elected so it is in his interest to make nice with China. Besides, as we know, China will not cave.

Gold in a corrective period
Gold has now put in three consecutive down weeks, telling us that we have now entered a corrective period that could last until November/December. The precious metal could be making a topping pattern here and to complete it we could see gold prices wiggle back over the next week or two before resuming a downtrend. It has found support in the $1,490 zone, but a break under that level could soon send us down to $1,460 support.
A break under $1,455 could suggest further declines toward $1,400. A decline towards $1,450 would be a fairly normal correction given the rise since the lows in May 2019. Long-term support for gold is down at the 200-day MA, near $1,345.
Could we fall that far? Well, it is not unusual to test these levels in a correction to make sure they hold, so, no, we can’t dismiss a potential test of that level. Once this corrective period gets out of the way we believe we should embark on a more powerful wave to the upside. But first, we need to see the nature of the correction.
Gold has a fairly consistent 50-week cycle of lows (11 months) but can range from 10–12 months; however, observations show that a wide range is 8–16 months. There was an important low in August 2016 followed by another important low in April 2019 (8 months), so that might have been our 50-week cycle low that came in early. If that’s correct, then the next low should be seen by December 2019 at the earliest. We’ll see how the market is performing going into that period to determine the next move.

The gold commercial COT improved this past week to 25% from 23%. The large speculators COT slipped to 84% from 85%. Commercial long open interest rose over 8,000 contracts while short open interest fell roughly 24,000 contracts. While the improvement in the commercial COT is welcome, we don’t believe we are out of the woods yet. We’d like to see prints up in the 40s.

Silver falls
Silver had a terrible week, falling 3.0% and closing at $17.57 over $2 below its recent high of $19.75. If there is one area of hope after that sharp fall on Friday it is that silver made a new low this week while gold did not. That might get confirmed later this week but for now, it is a divergence that could prove to be positive. RSI is falling rapidly but it is not yet at levels that might suggest a bottom. We need to get below 30 to suggest that.
Silver appears to be trying to break under a rather steep up-trend line. That is not unusual as usually steep rises (or falls) like this are not sustainable. The 50-day MA is currently at $16.93 so that could draw prices. Far better MA support is seen down at $15.60–$16.00. We have noted, however, that we would prefer to not see a breakdown under $16.50+/- 15 points. High volume accompanied the spike to $19.75, but Friday’s fall was on lighter volume. Bullish sentiment had reached over 90% for silver, a level that was not sustainable.
The gold/silver ratio is currently at 85 which we continue to believe is far too high. At some point, silver should outperform gold by a margin that takes the ratio down to at least 70. If that level held today silver would be at $21.40. We doubt that constant gold/silver ratios over 80 are the new norm. Although it seems that way. Silver needs to regain back above $18.50 to suggest to us that higher prices are probable.

Silver in long-term
Here is a longer-term chart of silver from the top in 2011. Note that silver made its final high in April 2011 while gold did not make its final high until September 2011. These are the kind of divergences one expects to see at significant tops and bottoms. Silver followed basically the same trajectory as gold did, falling in what appears to be five waves to the low in December 2015 at $13.62.
Since then silver, like gold, has begun a complex recovery. We believe the B wave low was seen at $13.86 in November 2018. Silver appears to have broken out above the down trend line from the key rebound high in August 2013 at $25.12. The recent high was at $19.75, but silver fell back rather fast to a low close of $17.57 this past week. It also appears to have taken silver back below the break-out line.
A false breakout? We don’t think so, but silver might test lower before resuming its uptrend. The 4-year MA is near $16.50 (actually $16.35) and that may be a target to test. Merriman notes that silver follows an 18.5-year cycle and subdivides that into three 6-year cycles but it could range from 5–8 years. Silver made an important low in 1993 and since then it made lows in 2001 (8 years), 2008 (7 years), and 2015 (7 years). This could be the start of a new 18.5-year cycle from the December 2015 low.
Silver did make a monthly close of $18.34 in August which was above key breakout levels near $16.50. That gives us hope that silver is embarking on another bull run. The next major low from December 2015 would not be expected until sometime between 2020–2023. The key monthly MAs are around $16.50 which is why we believe we could test down to that level; however, we would not really want to see a monthly close under that level. Final confirmation of a major breakdown would be under $15.50. These are some things to keep in mind going forward.

The silver commercial COT slipped slightly this past week to 31% from 32%. While silver fell sharply, the cut-off on the COT is September 10 so it didn’t capture the big drop on Friday. Next week’s COT will. Long open interest fell roughly 2,000 contracts as did short open interest so it was basically a saw-off. Look for improvement in the commercial COT in next week’s report.

TSX Gold Index
The TSX Gold Index (TGD) has broken down below its up-trend line this past week. The TGD lost 5.0% this past week, the second consecutive weekly 5% decline. The TGD is now down 13.5% from its recent highs. The Gold Bugs Index (HUI) fell 5.9% this past week and is now down 14% from its highs. With gold mining stocks volatility is thy name.
Nonetheless, the TGD remains up 26.2% and the HUI up 27.1% in 2019. There appears to be good support for the TGD, first at 225 and then again at 215. Only a breakdown below 200 would be of major concern. To the upside, the TGD must first regain above 250 to suggest higher prices.

Finally, some of the bullish hype has come off of the gold stocks. The Gold Miners Bullish Percent Index (BPGDM) has fallen back into a more neutral stance. The Gold Miners New Highs-New Lows % Index also slipped this past week but has not as yet fallen into negative territory. Another down week might do that. We’d love to see the BPGDM fall back to at least the 50 level. If the correction is steeper it might even fall back below 25.

Effects of US-China trade talks
Improved trade talks between the U.S. and China helped stem another oil price sell-off. The recent rally in for the U.S. Oil & Gas Index (XOI) also seemed to be giving off some hope of price recovery. Talks that China would accept some soybean imports were helpful. Inventory drawdowns also helped. Seasonally, oil prices are in their down period, and usually, things don’t pick up until December.
Note last year’s rise started in December and topped in April. Sometimes, the season lasts until about July. The pattern on WTI oil appears to be a descending triangle so that could imply that we have more downward movement before this is over.
A break under $50 could project down to around $34. The XOI appears to be in a down channel and is currently at the top of the channel. Either it has to break out or fail at current levels. This past week WTI oil fell almost 3.0% but the indices did better as the XOI gained 3.0% and the TSX Energy Index (TEN) jumped 5.6%.
Are the energy indices signaling that WTI oil will follow to the upside? One thing that may be helping is natural gas where prices jumped 4.4% this past week to the best levels in two months.
Drone attacks in Saudi’s oil fields
The oil fields of Saudi Arabia’s Aramco were attacked by drones this weekend setting the fields on fire and knocking out roughly 5 billion barrels a day of production. This production can be made up through release of reserves in Saudi Arabia and the U.S. Some producers such as Russia have some capacity to increase production.
Yemen’s Houthis have claimed responsibility but the U.S. has accused Iran of being behind the attacks. There is some evidence that suggests the attack came from Iraq. Saudi Arabia and Iran have been traditional enemies given that Saudi Arabia is Sunni Muslim and Iran is Shia Muslim. Where this leads no one knows.
Some fear Iran’s oil facilities will be attacked triggering a broader Mid-East war involving numerous players including Iraq, Syria, Lebanon (Hezbollah) and Israel besides the U.S. and Saudi Arabia. As well Russia and China are not far away and would most likely support Iran. Saudi Arabia supported primarily by the U.S. has been involved in Yemen’s civil war for years bombing the Houthis creating a humanitarian crisis.
The Saudi stock market took a hit. It is expected that oil prices could rise when markets open on Sunday. Stock markets could also be hit. Is this a black swan event?
Chart of the Week

I saw this chart recently from Tom McClellan of McClellan Financial Publications and thought it interesting enough to present. McClellan posted the chart in response to President Trump’s wish for the Fed to lower interest rates even to negative and even bring back QE. McClellan thinks that Trump should be careful what he wishes for.
The chart above covers the period from 1989 to the present, following the fall of the Berlin Wall and reunification. McClellan noted this relationship did not seem to work prior to reunification. What it explores is the relationship spread between U.S. 10-year Treasury notes and German 10-year bunds. Right now, the spread is quite high at around 231 basis points as of September 12, 2019. But the spread wasn’t always this wide.
In December 2008 the spread was 90 basis points but in favor of bunds over notes—the exact opposite of today. A falling German bund is usually associated with a recessionary period. Neither the Fed nor the Bundesbank controls the 10-year rate as their focus is on short rates. Actually, the Bundesbank doesn’t set rates at all as that’s the job of the ECB.
But a widespread in favor of the 10-year note over the 10-year bund is associated with a rising U.S. stock market. whereas as if the 10-year note falls and the 10-year bund is favored over the 10-year note the U.S. stock market is falling and the U.S. economy is sliding into recession.
So, as McClellan concludes that if we did see a sharp fall in the spread. it would presumably be bad news for the U.S. stock market and for the U.S. economy. Trump had better be mindful of what he wishes for.
__
DISCLAIMER: David Chapman is not a registered advisory service and is not an exempt market dealer (EMD). We do not and cannot give individualized market advice. The information in this article is intended only for informational and educational purposes. It should not be considered a solicitation of an offer or sale of any security. The reader assumes all risk when trading in securities and David Chapman advises consulting a licensed professional financial advisor before proceeding with any trade or idea presented in this article. We share our ideas and opinions for informational and educational purposes only and expect the reader to perform due diligence before considering a position in any security. That includes consulting with your own licensed professional financial advisor.


Bitcoin Stalls Near $60K as Strategy Moves, ETFs Outflow, and EU MiCA Rules Take Effect
Bitcoin hovers near $60,000 with ETF outflows, while Strategy boosts reserves, sells BTC, and raises dividends to reassure investors. Ethereum...


Cannabis Dominates Global Drug Use: Trends, Risks, and Shifting Markets
Cannabis remains the world’s most widely used illicit drug, with 256 million users in 2024, surpassing all others combined. Growth...


Italy Approves First Hydrogen-Powered Train for National Rail Network
ANSFISA has approved Italy’s first hydrogen-powered train, the Alstom HMU214, for use on the Brescia–Iseo–Edolo line. Capable of 140 km/h,...


Cotton Market Weakness Persists Despite Brief Rebound
Cotton prices fell to new lows last week before a modest rebound. USDA data shows crop conditions remain worse than...


Eli Lilly Hits $1 Trillion Valuation Amid Strong Bullish Momentum
Eli Lilly stock hit a record high, surpassing $1 trillion market value after strong product demand. Shares surged over 7%,...
 |
|
 |  |
 |
|
-

 Markets1 week ago
Cocoa Market Faces Mixed Trends Amid Rising Supply and Weak Demand
-

 Africa6 days ago
Bank of Africa Expands Sino-African Trade Partnerships in Beijing
-

 Biotech2 weeks ago
Bavarian Biotech Sector Expands with Record Funding and Startup Growth in 2025
-

 Africa2 days ago
BOAD Approves Major Funding Boost to Drive West African Development