Markets
Stock Markets Surge Amid Global Uncertainty, But Storm Clouds Loom
The stock market hit new highs despite global tensions, with the S&P 500, NASDAQ, and TSX leading. Oil collapsed amid a brief Mideast conflict. Energy and gold stocks fell, while Dollarama rose on strong earnings. Markets surged into Canada Day and U.S. Independence Day, but sustainability is uncertain heading into typically weak August and September.

The bears must be tearing their fur out. Here we are halfway through the year and stock markets, despite facing headwinds of trade wars, inflation, persistently higher interest rates, geopolitical tensions (war), domestic political tensions (deep polarization, ICE raids), we are once again nearing all-time highs.
Some, such as the NASDAQ, the AMEX, the NASDAQ 100, the S&P 100, and the NY FANG Index have already made their all-time highs. The S&P 500 just joined them. Elsewhere, the TSX Composite, the Tel AVIV 125 Index (a surprise), and the Dow Jones Global Index. It seems to defy logic, with many markets showing overbought and overvalued. Oh yes, and need we mention we also have all-time highs in money supply and debt.
Despite everything, U.S. corporate profits continue to grow. Stock markets focus on profits
Dominating corporate profit growth has been high tech, especially the MAG7, but healthcare and consumer discretionary have also done well. Here in Canada, the strongest-performing sectors over the past 10 years are the TSX Information Technology (TTK) and Golds (TGD). But by a wide margin it is the high-tech sector and the MAG7 (Apple, Amazon, Google, Nvidia, Tesla, Meta, and Microsoft) that have led the way. We note that, because of poor performance of late, Tesla has been replaced by Broadcom.
However, the biggest winner has been Nvidia (NVDA), up some 30,000% over the past decade. Nobody else is even close. Broadcom (AVGO) was next, up some 2,400%. Tesla (TSLA), which has been kicked out of the MAG7, is up 1,700% but has fallen sharply over the past year. Not so magnificent anymore. The market is being driven by AI (Nvidia), riding on sentiment in the sector, huge investments, and a big bet that AI will continue to fuel productivity growth and, by extension, corporate earnings. Who cares whether Israel bombs Iran, unless they hit their oil facilities (note: they haven’t).
The U.S. continues to see strong international flows of funds. That’s surprising, given the downward push of the US$ Index over the past year. However, the U.S. dollar falling is mainly due to the fact that most international investors hedge their positions and other central banks act to support their currency, thus dampening the U.S. dollar effect. The US$ Index recently hit 52-week lows and is down over 10% in 2025. Despite everything, the U.S. is still viewed as a safe haven. That could, of course, shift if the rest of the world is viewed more positively.
There remains considerable concern about the U.S.’s fiscal position with huge debt and rising budget deficits. There is also a constant feeling that the negative events (wars with Russia/Ukraine and with Israel/Hamas/Iran) are occurring “over there.” Unless the “over there” impacts the price of gas at the pump, those events are just noise. Things could yet come unravelled in the U.S. if the ongoing protests against the presidency of Donald Trump become more frequent or violent. But, so far, they are having little impact on markets. As long as the profits flow, what happens on the street stays there.
U.S. Corporate Profits vs. S&P 500 2015–2025
What stands out in these charts is that corporate profits and the rise in the S&P 500 are in tandem. If those corporate profits falter, then the S&P 500 falters as well. Note that the S&P 500 Schiller PE multiple is rather high at 37.2, not far from its peak in 2000 at the time of the dot.com bubble peak. The long-term average is around 17. The S&P 500 PE ratio is at 29.0, which is below the peak of the 2008 financial crisis and also well below the level at the top in 2000 during the dot.com bubble. The long-term average is around 15.5. Over time, things do tend to return to the mean. During the 2008 financial crisis, both the Schiller PE ratio and the S&P 500 PE ratio fell to around 14.
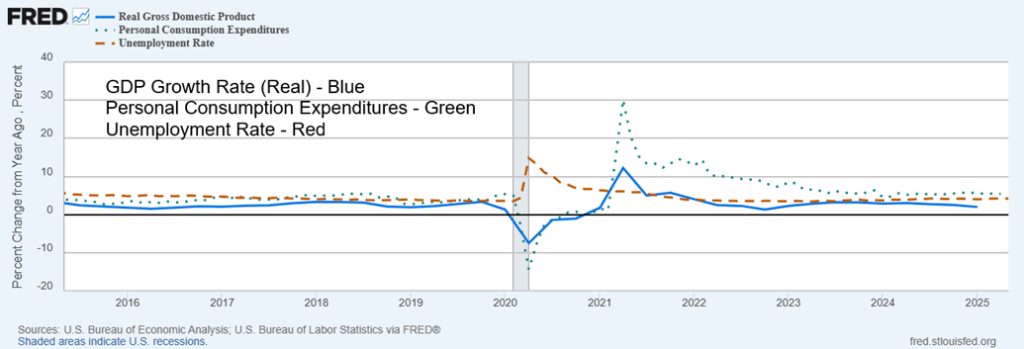
Interestingly, while GDP growth has started to falter and unemployment is creeping higher, personal spending is holding steady. However, is personal spending now faltering? Personal spending for May fell 0.1% when they expected a gain of 0.1%. The PCE (Personal Consumption Expenditures) price index came in at 2.3% vs. the expected 2.2% and last month’s 2.2%.
Real GDP Growth, Personal Consumption Expenditures, Unemployment Rate 2015–2025
Conference Board Consumer Sentiment Index 2007–2025
The PCE remains high, so it is somewhat surprising to see consumer sentiment faltering. On the previous page is the latest Conference Board Consumer Sentiment Index. It fell to 93, below the previous month’s 98 and below the expected 99. The Michigan Consumer Sentiment Index came in at 60.7, above the expected 60.5 and the previous month’s 52.2. While the Conference Board consumer sentiment is faltering, the Michigan Index shows improvement. Which is it? The Michigan Index is more responsive to consumer changes like gas prices.
Many have cited the fact that tariffs have not as yet increased inflation. Typically, tariffs trigger stagflation, putting upward pressure on prices while sparking sluggish growth. While tariffs in the U.S. right now only average 15.8%, they are still the highest in decades. Tariffs create an unpredictable business environment where supply chains get disrupted. It’s no surprise to see that containers coming from China have been in a downward trend. But there is a lag effect as it takes some time to work its way through the economy. Many analysts are now lowering their GDP outlook for the world in 2025 along with increasing the odds of a global recession.
Causing problems in markets is the persistent rumour that President Trump will fire or undermine Fed Chair Jerome Powell. Bluntly, the president does not have the legal power to fire the Fed chair and any attempt to do so would most likely fail. Trump is considering announcing a new Fed chair long before Powell’s term is up in May 2026. The Fed chair must be selected from the current governors. The dovish outlook helped stock markets surge higher, bond yields fall, and the US$ Index fall to its lowest level in 52 weeks. Oh yes, and golds were hit lower.
While Trump does not have the power to fire Powell, bond yields are falling on the expectation that his undermining of Powell will help push rates lower, thus being positive for the stock market. The US$ Index is also falling on the expectations of lower interest rates. This is an ongoing feud between Trump and Powell and globally markets would not respond well to the politicising of the Federal Reserve.
The Fed is still expected to lower rates at least once in 2025, probably in September. But there is a growing consensus that the next FOMC, July 29–30, might also see a rate cut. Powell has consistently noted that forcing interest rates lower may be dovish for the stock market but is inflationary in the longer term. Dovishness from the Fed also might spark a rush out of U.S. dollar assets, particularly if accompanied by what is seen as political interference in the workings of the Fed.
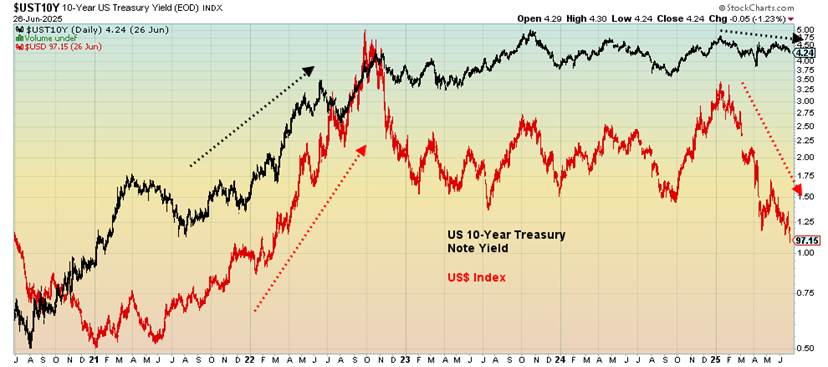
U.S. 10-Year Treasury Note vs. US$ Index 2020–2025
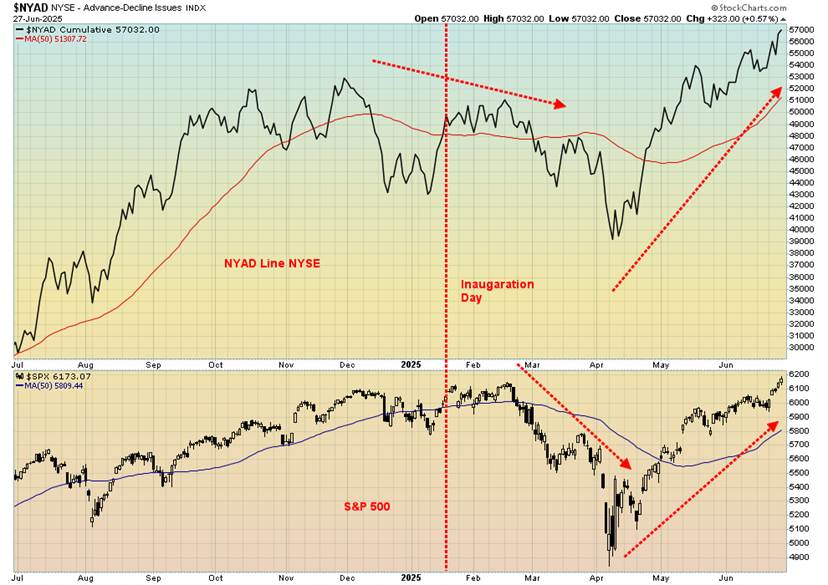
Irrespective of what one feels about a clearly overvalued U.S. market, flows can still occur due to nervousness elsewhere. The U.S. is still seen as a safe haven, away from the turmoil in the Middle East and Eastern Europe. Trade friction between the U.S. and China can also spark funds to move to the U.S. and out of Asia. We can’t help but notice that, as the stock market goes higher, the NYSE advance/decline (AD) line has also been moving higher.
It appears that the recent rally has broadened the stock market so that the MAG7 is no longer leading the way. Financials and industrials are joining the party. The last time we really saw this was before the 2008 financial crisis. The public always gets in at the top. Note how the NYAD is making new highs but the S&P 500 is barely back at its old highs.
A divergence? Earlier, note that the NYAD line was falling, even as the S&P 500 was making new highs in late 2024 and early 2025. That divergence resulted in the April 2025 tariff war collapsing. When they do not agree, something is amiss. Today, the AD line moving sharply higher while the S&P 500 is barely back at its old highs is a divergence.
NYSE Advance/Decline Line vs. S&P 500
The stock market has recovered its highs seen just before “Liberation Day.” But note that the Dow Jones Industrials (DJI) and the Dow Jones Transportations (DJT) have not. The DJT is not even close, an ongoing divergence with the DJI. Does it mean anything? Not until something happens. But whenever we have seen the indices not agreeing with each other, something happens to reverse the trend.
Markets have been rising against what many thought would happen. That alone triggers short covering. Buybacks have made stocks scarcer. Trade tensions have eased and trade deals might even happen. The wars are “over there” and the U.S./Israel/Iran war is on hold, at least for now. The economy has been resilient, although the Q1 GDP report suggests it could be faltering. Tech continues to dominate. And finally, the expectations are that the Fed will ease interest rates, either at the July or September FOMC. That is friendly for stocks and also helps ease long-term rates, but it is not friendly for gold or the U.S. dollar.
Chart of the Week
XOI and TEN 2020–2025
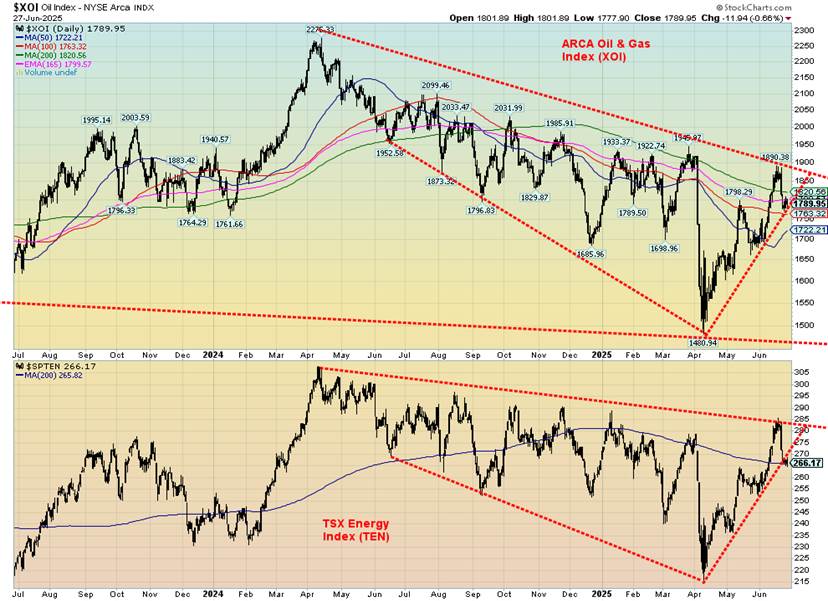
With the sharp reversal by oil following the cease fire between Israel and Iran, it was not surprising to find that the energy stocks were hit as well. But there were some differences. On June 23, WTI oil had a huge outside reversal day. No, it was not a key reversal as no new highs were made. From top to bottom WTI oil fell 15%. From the previous close WTI oil fell 7.5%. Brent crude from top to bottom fell 14.6% and was down 7.5%, equal to the drop for WTI oil. It was a dramatic day for oil.
However, the energy stocks fared better. The ARCA Oil & Gas Index (XOI) dropped from high to low only 4.1% and from the previous day’s close 2.8%. For the TSX Energy Index (TEN) the decline high to low on June 23 was 4.4% while from the previous day’s close the TEN was down 3.5%. Neither the XOI or the TEN had outside reversal days. A clear outperformance by the energy stocks.
We viewed the outperformance of the energy stocks as a positive. Yes, the commodity, oil, was severely beaten up, but the response from the stocks was much more muted. Where was the panic? In all instances there was some further selling the next day (June 24), but on June 25 all were bouncing back. Rather than viewing all of this as a huge negative, we view the lack of follow-through selling as bullish. Note that all of them—WTI, Brent, XOI, and TEN—held bullish uptrend lines, at least for now.
XOI and TEN Performance 2020–2025
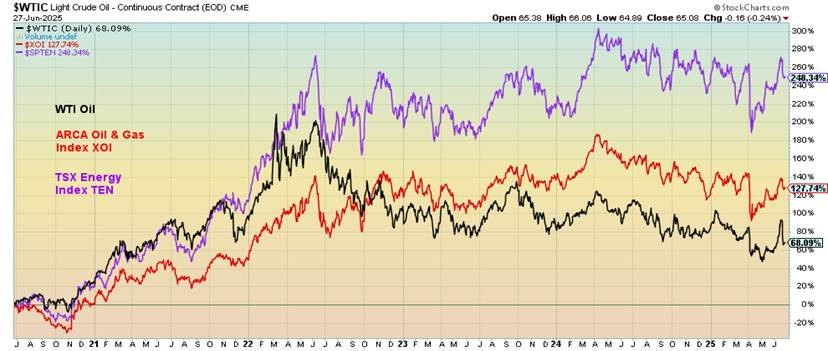
Since the 2020 COVID recession, energy stocks have enjoyed strong up moves, despite pulling back over the past year. Nonetheless, we view the patterns as positive and while on the surface the sector appears quite beat up, the action is suggesting otherwise.
The return over the past five years has been 250.8% for the TEN, 127.1% for the XOI, and only 66.2% for WTI oil. Not shown but for comparison purposes, Brent crude gained 63.6%, the S&P 500 was up 97.6%, the TSX Composite gained 73.0%, while gold was up 88.7%. The gold stock indices were up but less than many would expect with the Gold Bugs Index (HUI) gaining 49.5% and the TSX Gold Index (TGD) up 49.9%. By a considerable margin the winner was the TSX Energy Index, up 250.8%. It shows the importance of the sector.
Key stocks in the XOI include Exxon Mobil, Chevron, Occidental Petroleum, Conoco Phillips, and Phillips 66. For the TEN, key stocks include Canadian Natural Resources, Imperial Oil, Suncor Energy, Cenovus Energy, and Tourmaline.
The strong performance by the energy sector, particularly for the TEN, has been key to the performance of the TSX Composite.
Markets & Trends
| % Gains (Losses) Trends | ||||||||
| Close Dec 31/24 | Close Jun 27/25 | Week | YTD | Daily (Short Term) | Weekly (Intermediate) | Monthly (Long Term) | ||
| ne | ||||||||
| S&P 500 | 5,881.63 | 6,173.07 (new highs) * | 3.4% | 5.0% | up | up | up | |
| Dow Jones Industrials | 42,544.22 | 43,819.27 | 3.8% | 3.0% | up | neutral | up | |
| Dow Jones Transport | 16,030.66 | 15,494.54 | 4.9% | (2.5)% | up | neutral | neutral | |
| NASDAQ | 19,310.79 | 20,273.46 (new highs) * | 4.3% | 5.0% | up | up | up | |
| S&P/TSX Composite | 24,796.40 | 26,692.32 (new highs) * | 0.7% | 7.9% | up | up | up | |
| S&P/TSX Venture (CDNX) | 597.87 | 724.21 | 1.8% | 21.1% | up | up | up | |
| S&P 600 (small) | 1,408.17 | 1,336.86 | 3.1% | (5.1)% | up | down (weak) | up (weak) | |
| MSCI World | 2,304.50 | 2,690.42 (new highs) * | 1.8% | 16.8% | up | up | up | |
| Bitcoin | 93,467.13 | 107,052.88 | 3.5% | 14.5% | up (weak) | up | up | |
| Gold Mining Stock Indices | ||||||||
| Gold Bugs Index (HUI) | 275.58 | 406.90 | (3.5)% | 47.7% | up | up | up | |
| TSX Gold Index (TGD) | 336.87 | 484.31 | (3.8)% | 48.8% | up | up | up | |
| % | ||||||||
| U.S. 10-Year Treasury Bond yield | 4.58% | 4.27% | (2.5)% | (6.8)% | ||||
| Cdn. 10-Year Bond CGB yield | 3.25% | 3.31% | 0.3 | 1.9% | ||||
| Recession Watch Spreads | ||||||||
| U.S. 2-year 10-year Treasury spread | 0.33% | 0.53% | 12.8% | 60.6% | ||||
| Cdn 2-year 10-year CGB spread | 0.30% | 0.71% | 9.2% | 136.7% | ||||
| Currencies | ||||||||
| US$ Index | 108.44 | 97.33 (new lows) | (1.5)% | (10.3)% | down | down | down | |
| Canadian $ | 69.49 | 0.7297 | 0.3% | 5.0% | up | up | down (weak) | |
| Euro | 103.54 | 117.11 (new highs) | 1.7% | 13.1% | up | up | up | |
| Swiss Franc | 110.16 | 125.06 (new highs) | 2.3% | 13.5% | up | up | up | |
| British Pound | 125.11 | 137.10 (new highs) | 2.0% | 9.6% | up | up | up | |
| Japanese Yen | 63.57 | 69.11 | 1.0% | 8.7% | up | up | neutral | |
| Precious Metals | ||||||||
| Gold | 2,641.00 | 3,275.09 | (2.8)% | 24.0% | up | up | up | |
| Silver | 29.24 | 35.93 | (0.2)% | 22.9% | up | up | up | |
| Platinum | 910.50 | 1,336.80 (new highs) | 5.9% | 46.8% | up | up | up | |
| Base Metals | ||||||||
| Palladium | 909.80 | 972.00 | (6.7)% | 6.8% | up | up | down | |
| Copper | 4.03 | 5.06 | 4.8% | 25.6% | up | up | up | |
| Energy | ||||||||
| WTI Oil | 71.72 | 65.08 | (12.1)% | (9.3)% | neutral | neutral | down | |
| Nat Gas | 3.63 | 3.74 | (3.9)% | 3.0% | up (weak) | up (weak) | neutral | |
This is a theme that pervades others, including bond yields, the US$ Index, and gold. First off, hopes are rising for a Fed rate cut at the July 29–30 FOMC. Trump wants to replace Jerome Powell with Christopher Waller who is more dovish on rates than Powell. Trump’s public haranguing of Powell is not good because the bond market in particular doesn’t like to see political interference with the Fed. Nonetheless, the market is moving to thinking two or maybe even three rate cuts may occur this year, up from one. Also, peace was established (for now) in the Middle East and oil prices fell. The MAG7 and other tech stocks had good advances this past week. As we noted previously, the rally appears to be broadening out as seen by the advance/decline line.
Both the S&P 500 and the NASDAQ hit all-time highs this past week. They were up 3.4% and 4.3% respectively. The Dow Jones Industrials (DJI) rose 3.8% but saw no new highs. The Dow Jones Transportations (DJT) had a good week, up 4.9%, but is nowhere near its recent highs, let alone its all-time highs. A major divergence with the DJI. The S&P 400 (Mid) rose 2.6% while the S&P 600 (Small) was up 3.1%. Neither index is anywhere near their all-time highs. The NY FANG Index hit all-time highs, up 6.0%. The S&P 500 Equal Weight Index was up 2.2% but remains short of its all-time high. A potential divergence with the S&P 500 if the market turns down? Bitcoin was up 3.5% but remains shy of its all-time high.
In Canada, the TSX Composite gained 0.7% to all-time highs while the TSX Venture Exchange (CDNX) gained 1.8%. In the EU, the London FTSE was up 0.3%, the EuroNext was up 1.1%, the Paris CAC 40 was up 1.3%, and the German DAX gained 2.9%. No all-time highs, though. In Asia, China’s Shanghai Index (SSEC) was up 1.9%, the Tokyo Nikkei Dow (TKN) gained 4.6%, while Hong Kong’s Hang Seng (HSI) was up 3.2%. Gains all around.
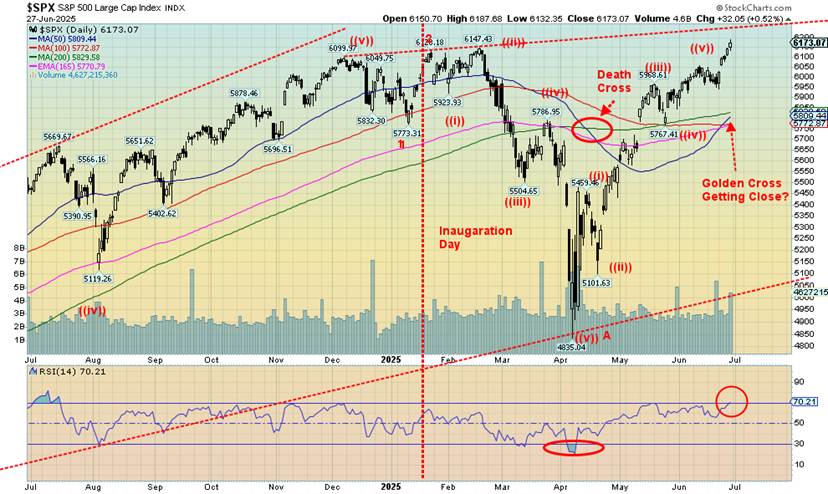
The steep rise continues. And, as we know from experience, steep rises like this are not sustainable. Is a golden cross pending? It’s hard to say. The NASDAQ is closer. RSI is creeping over 70, overbought. A break back under 5,950 could signal a top. Under 5,800 a top is in. That upsloping line connecting tops seems to suggest we have a little more up wiggle room. Will it happen? Things can change quickly as Trump ups his trade wars with Canada (and others to come?), while the Israel/Iran peace is fragile.
Economic numbers are also rolling over as witnessed by decreased income and spending and a negative Q1. We await rising unemployment, and suspect it’s coming. Lots of layoffs, but they don’t necessarily show up immediately due to severance, etc. Is the Fed cutting rates? The odds have risen for a July cut. The Fear/Greed index is moderately bearish at Greed. July can often see turns in the stock market. It can be the best month of Q3, but then beware August/September when we start to get the worst months. So, we don’t deny we could continue higher, but we’re getting long in the tooth and, given a 27.6% gain off that April low, we know this can’t continue for long.
The Scorecard
Selected Performance Since Inauguration Day 2025
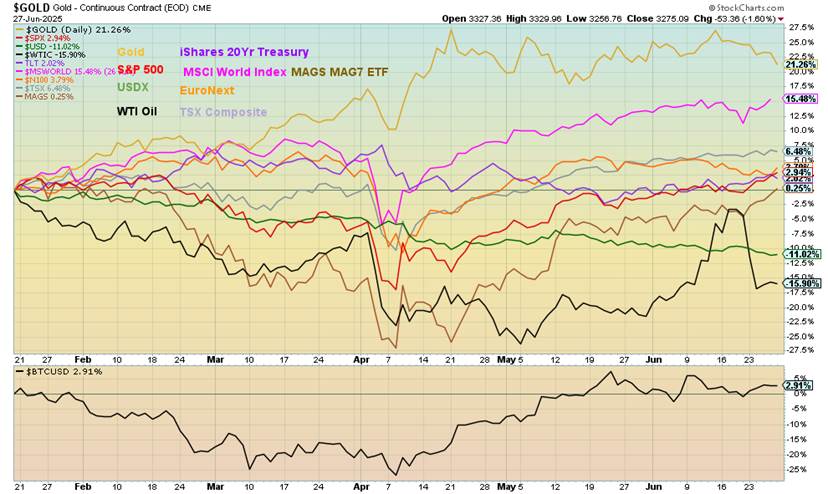
Despite gold taking a rest this past week, it still leads the pack, up 21.3% since Inauguration Day. The MSCI World Index remains second, up 15.5%. Oil’s big dip down put it back in the cellar again, down 15.9% so far. The US$ Index is not faring well either, down 11.0%. Most others are hanging at or just above 0 with the TSX the best of the lot, up 6.5%.
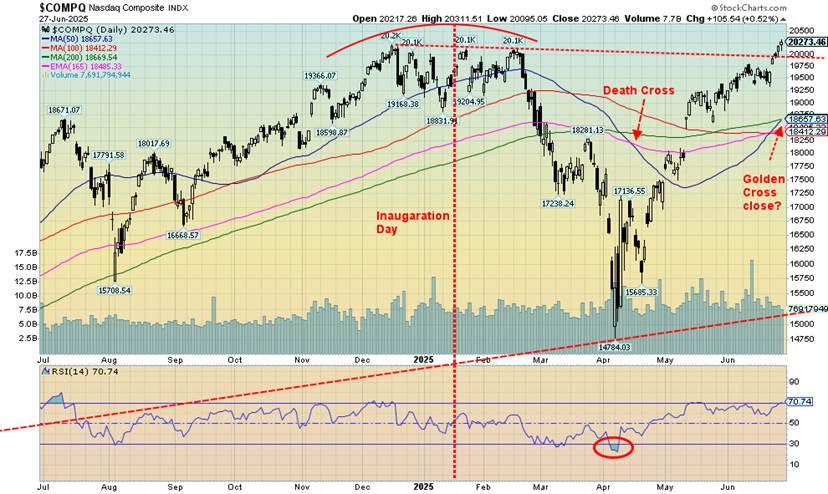
The NASDAQ made new all-time highs this past week, spurred on by the MAG7 and earnings. Helping as well was easing of global tensions, a dovish outlook towards rates, and optimism that trade issues will be resolved. They may not want to hold their breath. Right now, it looks like the NASDAQ broke out. But we won’t feel comfortable about the breakout until we clear and close over 20,500. Key, of course, are the MAG7 stocks where this past week six out of the seven were up on the week, with only Apple faltering—if you want to call “flat” faltering.
Broadcom rose 7.7%, Nvidia was up 9.6%, Meta was up 7.5%, and Microsoft made all-time highs, up 3.9%. Netflix also made all-time highs again, up 7.5%. No surprise that the NY FANG Index rose 6.0%. As noted, this up move from the April low has been quite sharp with few pullbacks. A break under 19,750 would signal we might have topped. Under 19,250 we’ve topped. RSI is creeping over 70, in overbought territory. But we note few if any negative divergences yet.
U.S. GDP quarter over quarter Annual Growth 2022–2025
U.S. GDP fell by 0.5% in Q1. The previous quarter, Q4 2024, GDP rose 2.4%. First effects of the Trump presidency? The market had expected a decline of 0.2%. It was the first decline in three years. Downward revisions came in consumer spending and exports.
There were also downward revisions to imports, but not enough to offset downward revisions of exports. It is the first potential sign of the tariff effect. Federal government spending also fell more than expected. Federal spending can be an important support to the economy. Where do we go from here? Two consecutive quarters of negative growth is an official recession.
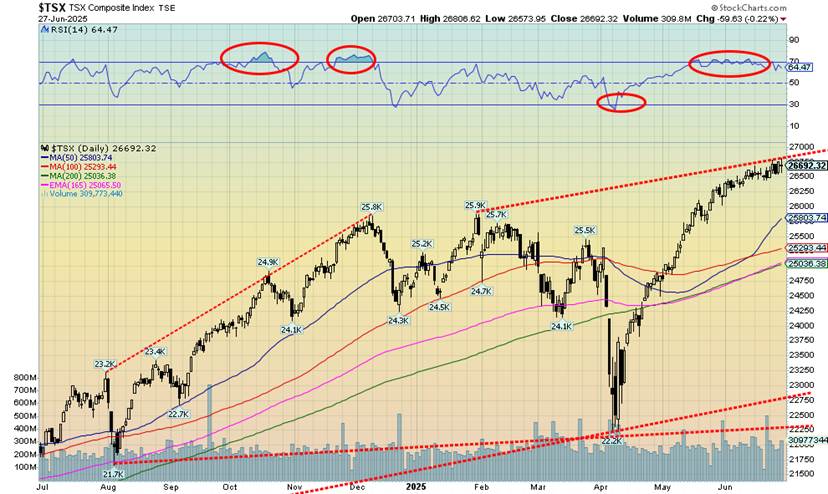
Another week, another record high for the TSX Composite. It’s been straight up since that April low, but the index is showing signs of fatigue as we appear to be flattening out. Note that the TSX never made a death cross during that fall and now the indicator has turned up again. The TSX gained 0.7% this past week. The TSX 60 also made record highs again up 0.8%. The TSX Venture Exchange (CDNX) also held up, gaining 1.8%. Most sub-indices were up on the week with 11 winners and only three losers. The losers were probably no surprise with Energy (TEN) down 5.6%, Golds (TGD) off 3.8%, and Materials (TMT) down 2.0%. Surprisingly, Metals & Mining (TGM) held in, up 0.6%.
Leading the charge to the upside was Information Technology (TTK), up 4.1%. Financials (TFS) charged to new all-time highs, up 2.2%. The only other significant winner was Health Care (THC), up 2.4%, but it remains as the year’s poorest performer, down 19.9%. The TSX appears to be rolling over. Note the falling RSI indicator. Volume has tailed off as well. Under 26,500 might start a down move. Under 26,000 we’re going down for sure. Long-term support is at 25,000.
U.S. 10-year Treasury Note, Canada 10-year Bond CGB
Bond yields fell this past week with the U.S. 10-year Treasury note dropping to 4.27% from 4.38%. As with stocks, bond yields were responding to peace in the Middle East (for the moment) and dovish statements from Fed officials. One dovish statement came from Fed Governor Christopher Waller. Trump has suggested that Powell be replaced with Waller. Trump wants rates down now to help hold off any recession rather than waiting for data, which is how Powell tends to act.
The Q1 GDP decline of 0.5% was the first sign of probable weakness going into the second half of the year. Inflation has been muted, as even the PCE prices were roughly the same this past week. Other weak numbers were moderating home prices, the decline in the Conference Board’s consumer sentiment, new home sales falling 13.7% after a 9.6% gain in April, Q1 corporate profits off 3.3% vs. 5.9% gain in Q4 2024, and personal income and spending down in May by 0.4% and 0.1% respectively.
Initial jobless claims were 236,000 vs. 246,000 the previous week. Durable goods orders jumped 16.4% in May. So, we’re not completely dead. Oil prices dropped as a result of peace breaking out. The market mostly is front-running expectations of a July rate cut rather than waiting until September. Canada’s 10-year
Government of Canada bond (CGB) was largely unchanged, up 1 bp to 3.31%. The 2–10 spread widened to 53 bp from 47 bp in the US and was up to 71 bp from 65 bp in Canada. That’s mainly because the 2-year note fell more than the 10-year in anticipation of a rate cut. The U.S. 10-year has broken the uptrend and could even fall back towards 4.00%, a level we saw in late April.
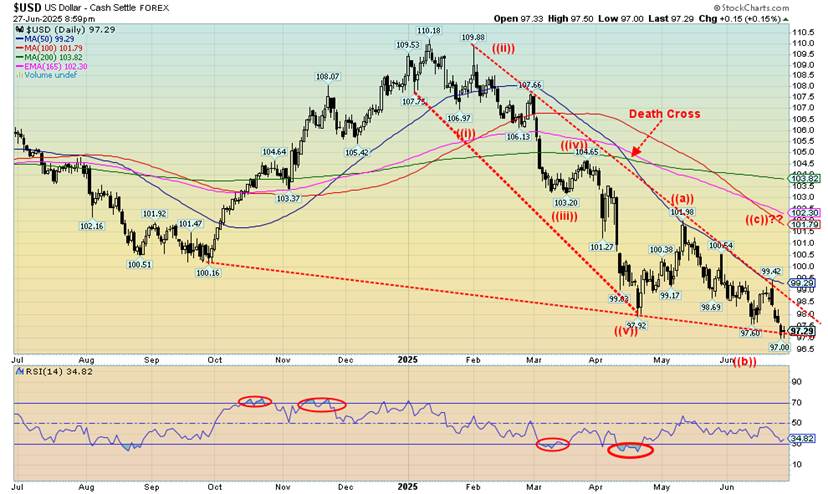
The US$ Index fell to new 52-week lows this past week, losing 1.5%. The US$ Index has been falling on expectations of a Fed rate cut as early as the July meeting. The dollar has also been losing altitude because of the ongoing Trump/Powell feud. Finally, Trump’s on-again, off-again trade ramblings create uncertainty. So, sell the dollar. Capital flows are moving elsewhere as hedged positions unwind and capital goes back to its source. The other currencies are not complaining as a number of them made new 52-week highs this past week.
They were the euro, up 1.7%, the Swiss franc, up 2.3%, and the pound sterling, up 2.0%. Not making new highs was the Japanese yen, up 1.0%, while the Cdn$ gained 0.3%. The Cdn$ was up more but sold back on news of Trump announcing the end of trade discussions with Canada over the digital tax. The US$ Index may find support here. A break under 97.00 could end that and the downtrend continues. It would take a breakout over 99 to suggest this downtrend is over. Above 100.50 it’s definitely over and we could test up to 102. If that happened, it wouldn’t be good for gold.
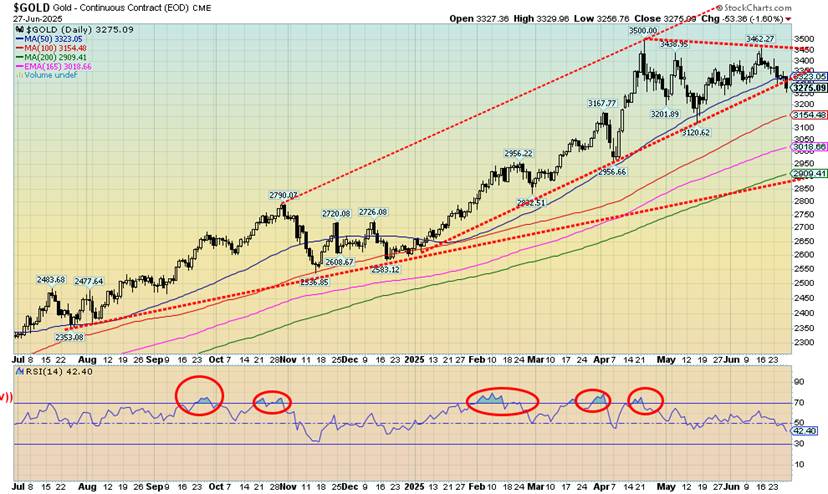
It wasn’t a good week for the gold bugs. Peace was established, for the moment, in the Middle East. The Fed kept rates unchanged, as we all expected. But that was not overly friendly for gold. Of bigger interest is the ongoing fight between Trump and Powell. If Trump gets his way for the Fed to cut rates up to 2.5%, gold would likely soar. Nonetheless, this past week gold was weak because of peace, no rate cuts, and the stock market up yet again. The US$ Index fell. Gold would normally go up when that happens. Not this time. Both gold and the US$ Index fell. A divergence?
On the week, gold fell 2.8% while silver was down 0.2%. Another divergence as silver showed stronger. But the real star has been the ongoing rise/recovery of platinum (also known as “white gold”) that was up again by 5.9% to fresh 52-week highs. Helping platinum were power shortages in South Africa where 70% of the global supply comes from. Also, there was good demand for platinum, particularly in the automobile industry. Green energy is also fuel for platinum. On the other hand, palladium fell 6.7%, helped by increasing supply.
Palladium has been moving from undersupplied to oversupplied. Copper, which is often a leader for gold rose 4.8% to close over $5. Tariff threats helped copper, along with tightening supply. There have also been disruptions to supply out of China. Copper is heavily used in green energy and EVs.
Gold broke support, suggesting now that it could fall to $3,150, the next good support. Major support is way down around $2,900. We are still questioning as to whether this is an E wave to an ABCDE-type correction that got underway with the high at $3,500. That correction back in October/December saw gold fall just over 9%. A comparable decline today would take gold to $3,185, close to our $3,150 support.
Lots of things could reverse gold back to the upside, including the war in the Middle East resuming or the public fight between Trump and Powell intensifying, causing nervous investors to run to safe havens such as gold. New highs above $3,500 would end discussions of a decline for gold. Gold still remains bullish. But it must work through this correction. Again, this should be the last wave down of the pattern. July lows are not unusual for gold.
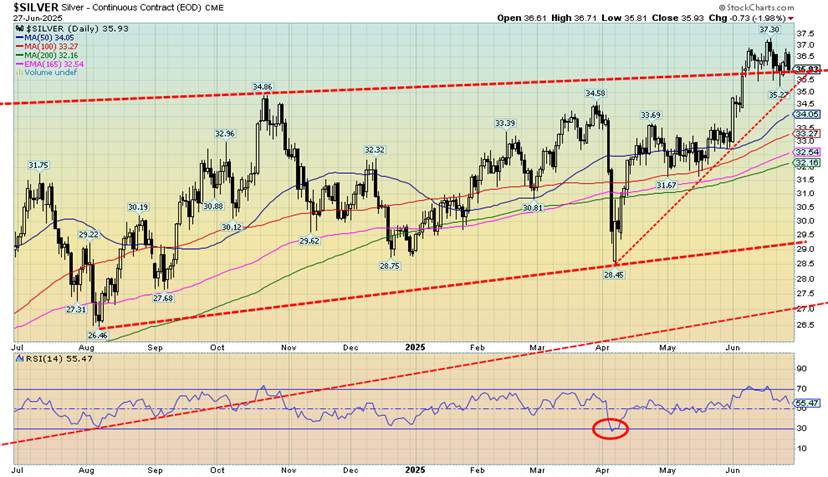
If there is something positive to say about silver, it’s that while silver fell this past week it outperformed gold. Silver fell 0.2%. Gold fell 2.8%. Earlier, silver had moved forward, breaking above $36 and making 52-week highs. Gold did rebound at that time but failed to take out the old high of $3,500. It’s an ongoing divergence. We’d like to say the divergence is in favour of silver. If that’s correct, then new highs for both should occur when this current correction is over. The fear right now is whether that breakout over $36 is a false move.
We didn’t get substantially above to help suggest this was a good move. Now a break back under $35 could end the magic and turn silver down once again. Yes, there is good support down to $32, but we’d prefer not to see that. Under $32 silver is in more trouble. Under $31.50 we could test those last lows at $28.45. We keep hearing silver is about to explode to the upside. The problem is we’ve been hearing that for some time now and we’re still waiting. The breakout target is $44. But to realize that, we need to recover soon and see new highs above $37.30 the high so far. Indicators are for the most part neutral here.
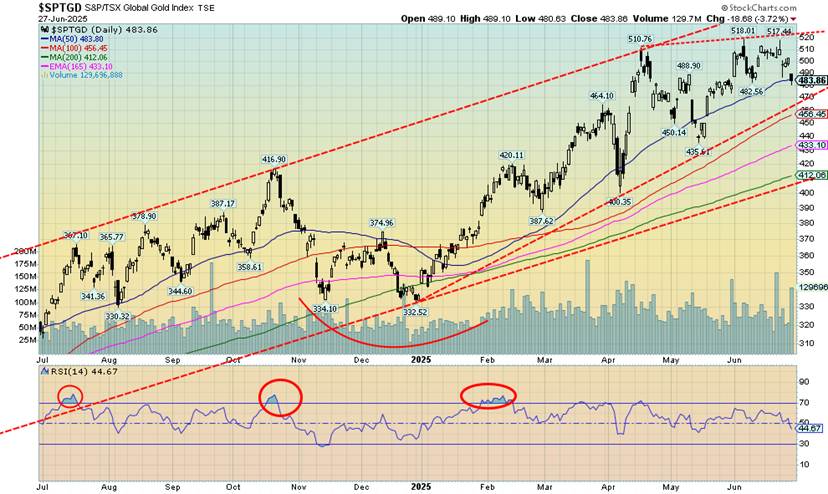
We can’t say we were surprised at the drop in the gold stocks this past week. The chart had been looking a bit iffy as we noted the previous week. Now the question is, how deep will the correction be? On the week, the TSX Gold Index (TGD) fell 3.8% while the Gold Bugs Index (HUI) was down 3.5%. The worst day was Friday, June 27 when the index fell 3.7%. We can see support for the TGD down to 470, but under that the correction could be steeper. After all, the TGD is up 43.8% on the year and the HUI up 47.7%. So, at best, profit-taking is not unusual. But, as we noted with gold itself, we don’t believe the bull is over.
For the TGD we’d have to break back under 412. But we can’t dismiss a possible correction not dissimilar to that October to December decline when the TGD fell 20%. A comparable move now would be a decline to 414 which, coincidently, is just above the 412 point we noted. To put the bull back in place we’d have to break above 520.0. After that low in December, the potential for the TGD was a rise to just over 500. We accomplished that and exceeded it. The trend remains up as long as we hold above 465/470. Under that level, the trend would be weakened and set us up for a steeper correction.
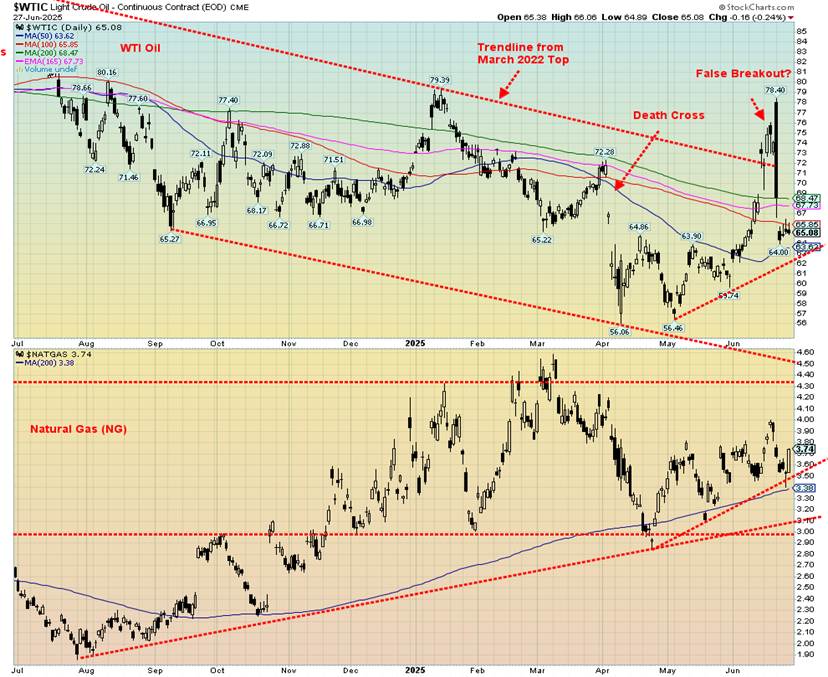
That is one big oopsy! The war is on. They’ll close the Straits of Hormuz. Oops, let’s make peace instead. And then, down we go as if we were never there. That was quite the hiccup. We broke out of that long downtrend line from the 2022 high at the time of Russia/Ukraine war. Then we didn’t. A false breakout? The only good news was at the end of the week we were still holding above that uptrend line from the May low at $56.46. Instead of war, we’re back to OPEC expectations, supply/demand. But will the peace last? Don’t hold your breath. A break of $62 could take us down to test that May low. Natural gas (NG) would have to break under $3.50. What could help keep the price of oil up is that the stocks are close to their five-year average on the low side. They need replenishing.
On the week, WTI oil fell 12.1%. Brent crude was down 12.7%. Natural gas (NG) also reacted negatively to the ceasefire as NG at the Henry Hub fell 3.9% but NG at the EU Dutch Hub dropped a sharp 18.3%. The energy stocks didn’t like any of it but, surprisingly, fared well by comparison. The ARCA Oil & Gas Index (XOI) was down 4.2% while the TSX Energy Index (TEN) fell 5.6%. We’ll take our cue from the stocks and our suspicion is this isn’t over. NG also held an uptrend line. So far, so good. This might be a good case of “buy the dip.”
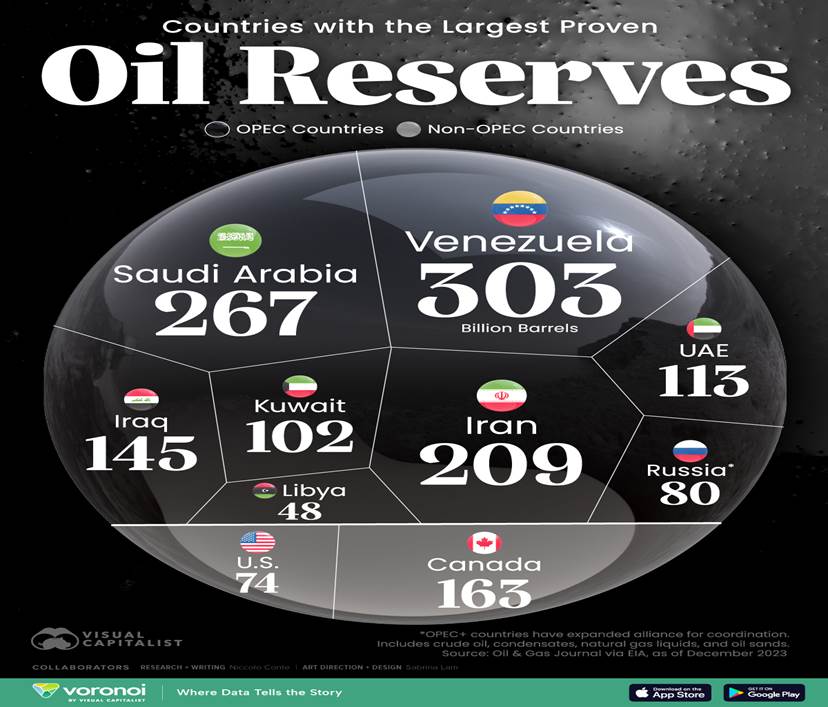
A nice visual showing where the largest oil reserves lie:
__
(Featured image by Jakub Żerdzicki via Unsplash)
DISCLAIMER: This article was written by a third party contributor and does not reflect the opinion of Born2Invest, its management, staff or its associates. Please review our disclaimer for more information.
This article may include forward-looking statements. These forward-looking statements generally are identified by the words “believe,” “project,” “estimate,” “become,” “plan,” “will,” and similar expressions, including with regards to potential earnings in the Empire Flippers affiliate program. These forward-looking statements involve known and unknown risks as well as uncertainties, including those discussed in the following cautionary statements and elsewhere in this article and on this site. Although the Company may believe that its expectations are based on reasonable assumptions, the actual results that the Company may achieve may differ materially from any forward-looking statements, which reflect the opinions of the management of the Company only as of the date hereof. Additionally, please make sure to read these important disclosures.
David Chapman is not a registered advisory service and is not an exempt market dealer (EMD) nor a licensed financial advisor. He does not and cannot give individualised market advice. David Chapman has worked in the financial industry for over 40 years including large financial corporations, banks, and investment dealers. The information in this newsletter is intended only for informational and educational purposes. It should not be construed as an offer, a solicitation of an offer or sale of any security.
Every effort is made to provide accurate and complete information. However, we cannot guarantee that there will be no errors. We make no claims, promises or guarantees about the accuracy, completeness, or adequacy of the contents of this commentary and expressly disclaim liability for errors and omissions in the contents of this commentary. David Chapman will always use his best efforts to ensure the accuracy and timeliness of all information. The reader assumes all risk when trading in securities and David Chapman advises consulting a licensed professional financial advisor or portfolio manager such as Enriched Investing Incorporated before proceeding with any trade or idea presented in this newsletter.
David Chapman may own shares in companies mentioned in this newsletter. Before making an investment, prospective investors should review each security’s offering documents which summarize the objectives, fees, expenses and associated risks. David Chapman shares his ideas and opinions for informational and educational purposes only and expects the reader to perform due diligence before considering a position in any security. That includes consulting with your own licensed professional financial advisor such as Enriched Investing Incorporated. Performance is not guaranteed, values change frequently, and past performance may not be repeated.


Vexuvo Secures €7.4M to Boost Agrivoltaic and Storage Growth
Vexuvo and the Sella Group have reached 7.4 million euros in total funding to support renewable energy growth. A new...


CAR-T Cell Therapy Induces Remarkable Remission in Patient with Multiple Autoimmune Diseases
A 47-year-old woman with three severe autoimmune diseases received CAR-T cell therapy at a German hospital, achieving one-year remission without...

Markets Rebound Briefly as War Risks and Inflation Persist
Artemis II’s safe return contrasted with failed peace talks, ending hopes of a sustained ceasefire. Markets briefly rallied on optimism,...

Dow Jones Near Highs Amid Low Volatility but Caution Signals Emerging
The Dow Jones recently closed near record highs after only a mild 10% correction, suggesting market strength. However, a few...


The TopRanked.io Weekly Digest: What’s Hot in Affiliate Marketing [LiveChat Affiliates Review]
Quick Disclosure: We’re about to tell you how LiveChat Affiliates run a top-notch affiliate program. And we really mean it....
 |
|
 |  |
 |
|
-

 Crypto2 weeks ago
Bitcoin Slides, Ethereum EEZ Emerges, Worldcoin Hits Low
-
 Crypto3 days ago
Bitcoin Stalls as Geopolitical Risks and Crypto Industry Tensions Persist
-

 Africa1 week ago
Casablanca Stock Exchange Profits Surge in 2025 as Growth Momentum Strengthens
-
 Africa5 days ago
Foreign Exchange Markets Walk a Tightrope Amid Geopolitical Tensions and Policy Uncertainty