Markets
Tariffs Have Been Imposed by the U.S. Against a Growing Number of Countries
Key stocks like Nvidia, the leader of the Magnificent Seven, is now down over 20% from their high. The definition of a bear market. Magnificent Seven to Tarnished Seven? But gold is defying rising long-term interest rates and a rising US$ Index with a record close this past week over $2,400. Golds along with materials and metals are holding the TSX up.

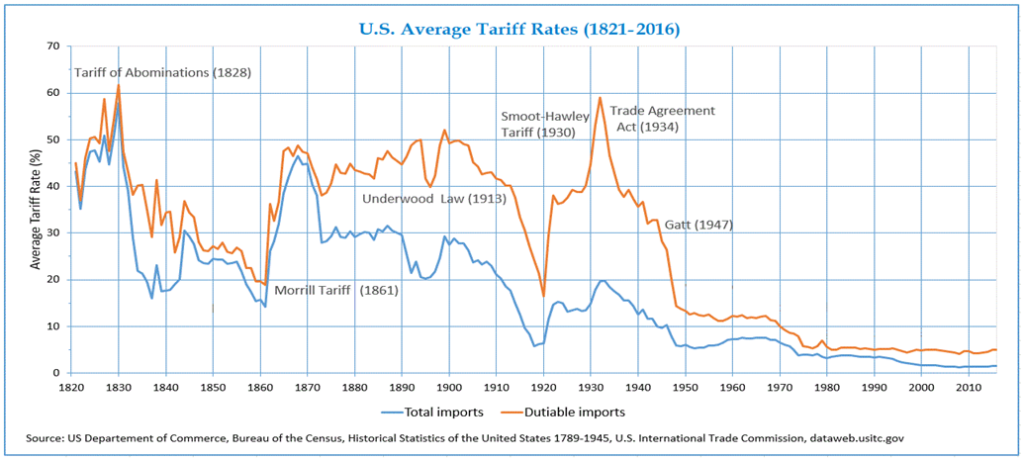
The Tariff Act of 1930,more commonly known as the Smoot-Hawleytariff, was a trade protectionist act passed by the U.S. Congress and signed by President Herbert Hoover. The act raised tariffs on over 20,000 goods. The negative response was almost immediate as numerous countries, including Canada, raised tariffs on American goods. The result was a reduction of 67% on imports and exports for the U.S. and the knock-over effects on other countries. It was noted that the subsequent reduction in global trade was a major contributor to the Great Depression.
As a result, after the war, the world negotiated the General Agreement on Tariffs and Trade (GATT) in 1948 to prevent a Smoot-Hawley fiasco happening again. GATT was replaced by the World Trade Organization (WTO) in 1995. The WTO has 164 member states and covers over 98% of global trade and GDP.
However, all this may increasingly be under attack. The WTO is under attack due to the after-effects of COVID, the rise of e-commerce and digital trade, agriculture subsidies, and dispute settlement reform. Today, the WTO is facing numerous problems related to developed countries vs. developing countries—in particular, how it addresses environmental, diversification, agriculture tariffs, and cultural and social factors that vary from country to country. The WTO has also been accused of being undemocratic, dominated as it is by the countries of the G7—in particular, the U.S. and U.K.
Disruptive to world trade is the growing sanctions regime of the U.S. and the West in general against numerous countries, including Russia, China, Iran, Venezuela, North Korea, and Syria. Noteworthy is that the U.S. brought additional sanctions against Iran for the recent attack on Israel. The U.S. and the U.K. have also imposed a ban on Russian metals, including aluminum, copper, nickel, and uranium. Predictably, it pushed up prices for those metals. If other countries and corporations breach sanctions, they too could be sanctioned.
Tariffs have been imposed by the U.S. against a growing number of countries including Canada, Mexico, Turkey, India, China, and the EU. The result is retaliatory tariffs being imposed by those countries against the U.S. The U.S. has announced the potential for further tariffs against China, particularly its steel industry. That in turn is expected to be met by retaliatory tariffs against U.S. goods. It seems that Smoot-Hawley is alive and well, or at least rising from the dead.
The result is what would be expected: a contraction in world trade and a subsequent negative impact on GDP and employment. Some have estimated that it would shave upwards of 0.4% off U.S. GDP and cost at least 30,000 jobs. Actual numbers may be even higher. https://taxfoundation.org/research/all/federal/tariffs-trump-trade-war/#:~:text=U.S.%20announces%2010%25%20tariff%20on,modeled%20as%20a%2010%25%20tariff
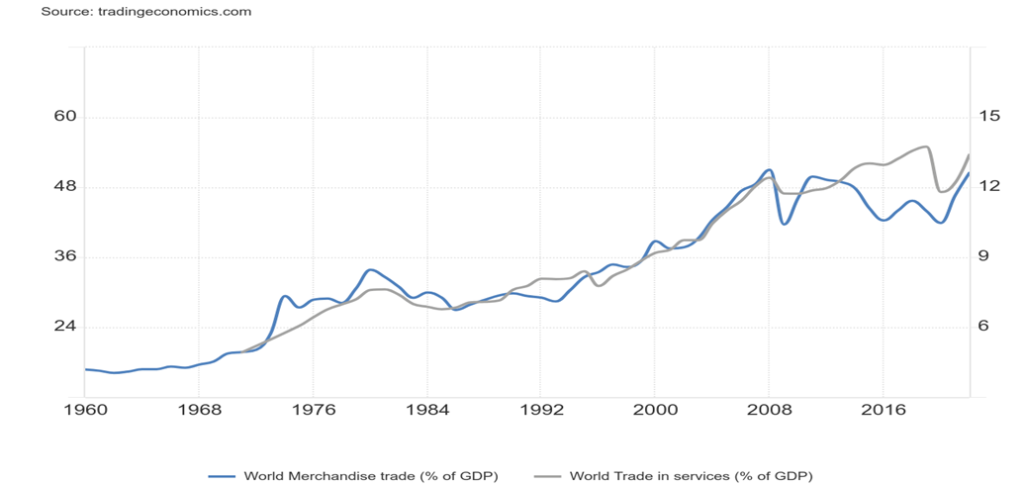
World merchandise trade as a percentage of GDP was 50.45% in 2022. But since 2008 merchandise trade as a percentage of global GDP has basically flatlined, including periods of falling after growing at least 89% from 1986 to 2008. World trade in services was reported at 13.39% in 2022. From 1985 to 2019, world trade in services grew 102% as a percentage of GDP. Since than, primarily because of the 2020 COVID pandemic and increasing sanctions and tariffs it has contracted roughly 2.5% to 2022. The result is that overall global trade is shrinking but has not as yet become a major drag on the world economy. The question is, will it in the future? So far it appears to be growing again but as we’ve seen over the past few years it quickly turns down again. Trade growth since the 2008 financial crisis has mostly flatlined.
World GDP grew almost 700% from 1985 to 2023 and is up over 20% since the COVID pandemic of 2020. But is it sustainable? World GDP did contract after the 2008 financial crisis, and again after the EU debt crisis of 2014 and the pandemic of 2020. Each time it recovered, but ongoing threats to world trade through sanctions and rising tariffs plus rising wars in Russia/Ukraine and Israel and the Middle East threaten to lower global GDP once again. World net income also took a hit after the 2008 financial crisis, the EU debt crisis, and the COVID pandemic. Each subsequent contraction has generally been worse than the previous one.
U.S. Average Tariff Rates 1821–2016
World Merchandise Trade and World Trade in Services as a % of GDP 1960–2022
Since 2008, all U.S. debt (governments federal, state, municipal), corporate (financial, non-financial), and households/consumer has grown almost 95%. U.S. federal debt alone has gone up over 200%. Globally, debt has increased almost 125% while global debt to GDP is now over 300%. Given the growing conflicts in the world due to climate change, geopolitical conflicts, and domestic conflicts, all this could have a negative impact on global GDP, even as global debt grows. The U.S. alone has a total debt to GDP ratio over 350%, a level that has at least steadied after growing, following the 2008 financial crisis.
The ability of the world to respond to a financial crisis on the scale of 2008 has been curtailed by the massive growth of debt since that time. The Fed and other major central banks are between a rock and hard place to combat another crisis on the scale of 2008 or the 2020 pandemic. Endless amounts of QE and pushing interest rates towards zero only resulted in dislocations and financial bubbles particularly in the stock market and housing. While many benefitted with sharply rising prices of assets such as stocks and housing, the risks and disparities are also rising, along with the growing threat of populist solutions. The latter closely resembles the rise of populist solutions in the 1930s, along with the rise of fascism and growing global conflict that resulted in World War II.
It also translates into the potential for a sovereign debt crisis that could plunge the world into a global recession, or worse. A short list of those with credit ratings below BBB (the lowest investment grade rating of S&P) includes countries like Vietnam, Pakistan, Turkey, Bolivia, Argentina, Ukraine, and Sri Lanka. Not rated are Russia and Belarus because of the Russia/Ukraine war. Only 11 countries are rated AAA by S&P, including Canada, Germany, Sweden, and Switzerland. The U.S. is AA+, the EU is AA, while the U.K. is also AA. Japan is A+. Of the G7 countries, Italy is rated the lowest at BBB.
The potential for a global recession is growing as trade friction grows, the costs of climate change grow (due to severe weather events), geopolitical conflicts grow, and domestic political conflicts grow. All have a potentially dampening impact on growth, and the odds are this is likely to get worse before it gets better. And we wonder why we have an inflation problem and purchasing power is falling.
Chart of the Week
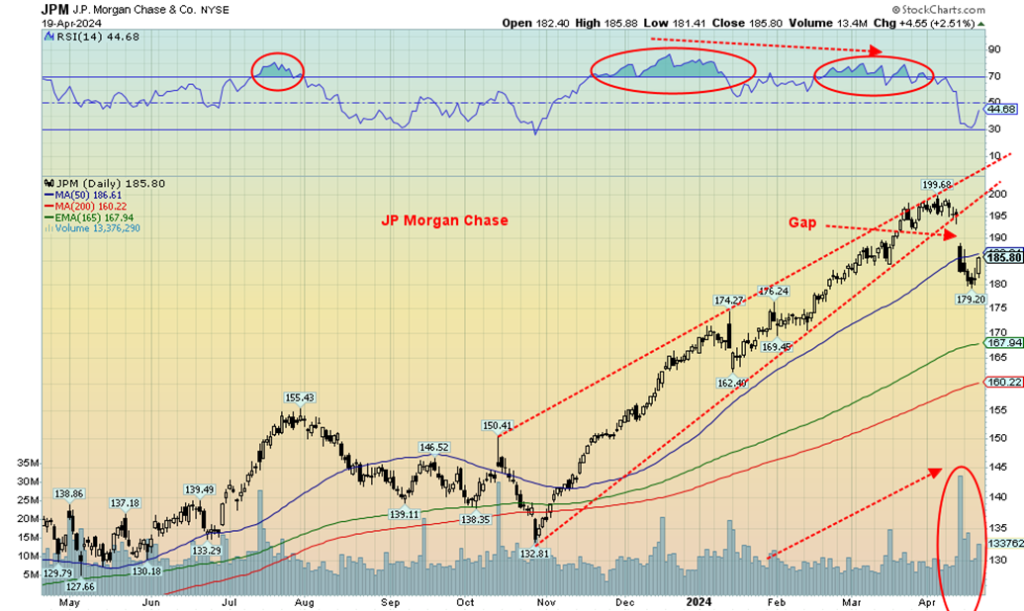
Oops! What happened to JP Morgan Chase (JPM)? It gapped down on April 12, 2024. Why? It missed analyst estimates for net interest income (NII). Gaps down, or in this case breakaway gaps as technical analysts call them are usually a sign of trouble. They also usually signal a top. When they gap up after a long time this usually signals a bottom.
A gap down is usually fatal unless the gap is filled. So far that hasn’t happened and now JPM has broken the 50-day MA. JPM also broke the steep uptrend line and what appears as a huge ascending wedge triangle. JPM also broke the last low on the daily charts at $184.33. JPM still has a way to go to break the weekly low at $162.40 in January 2024 and the monthly low at $132.81 seen in October 2023. Both those points are still a way away. Finally, note the huge volume increase on the gap down day. JPM bounced back Friday, but is nowhere near filling that gap.
JPM is the U.S.’s largest bank and the world’s fifth largest in terms of assets. JPM is the world’s largest bank by market cap with a market cap almost double the second largest Bank of America (BAC).
A breakdown of this nature is not a positive sign. It may be pointing to a broader break down in the stock market. Ascending wedge triangles when they break down often return to where they started. That is the October 2023 low of $132.81, a 30% decline from current levels. Granted, JPM gained 50% from that October 2023 low to the April 4, 2024 high. The combination of a breakaway gap on very high volume is not a positive sign.
Do JPM’s woes translate into the broader bank market?
KBW Bank Index, KRX Regional Bank Index 2014–2024
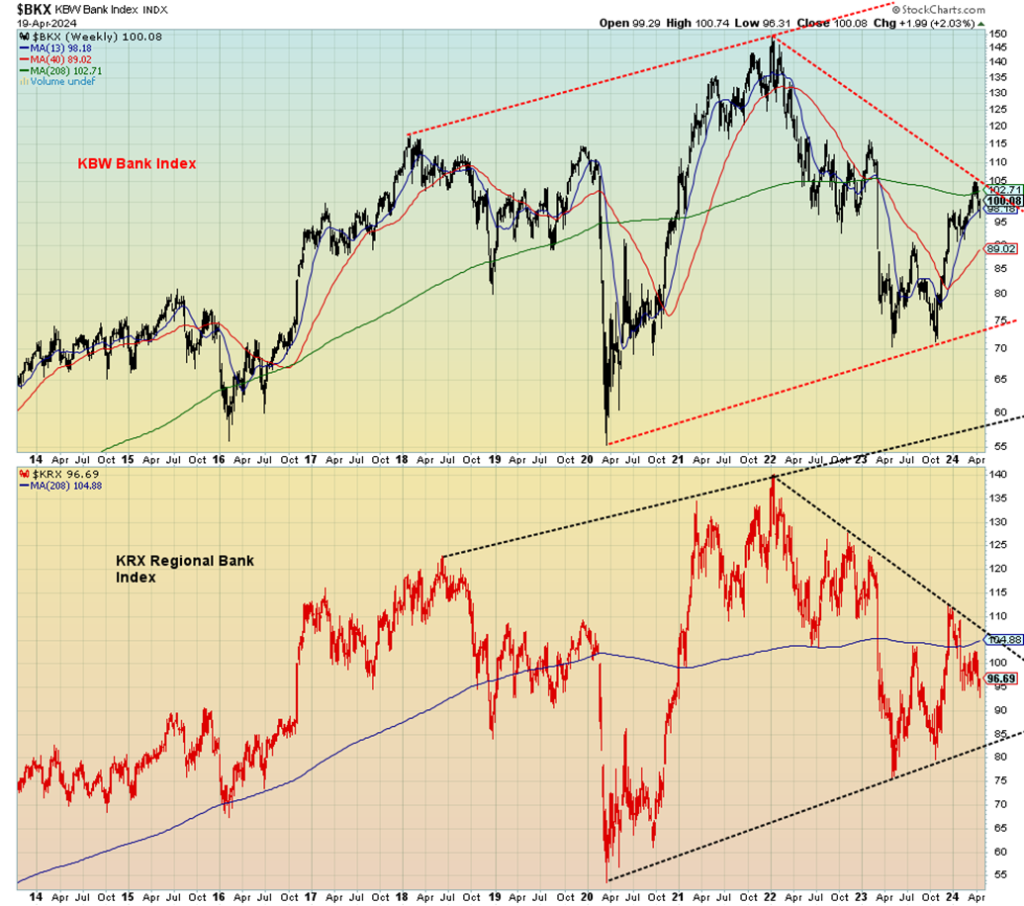
Our chart of the KBW Bank Index (BKX) and the KRX Regional Bank Index (KRX) doesn’t look too healthy, either. Neither one of them made it back to the highs of 2022, despite JPM’s run to new highs. Both indices failed at the 4-year MA.
The regional banks went through a rough time in 2023 with the collapse of Silicon Valley Bank (SVB) and Signature Bank (SBNY) in March 2023 and First Republic Bank (FRC) in May 2023. Then in July 2023 Heartland Tri-State Bank (HLAN) fell, followed by Citizens Bank (CFG) in November 2023. FRC, SVB, and SBNY were the second, third, and fourth largest regional bank failures in the history of the U.S. Washington Mutual (WAMU) was the largest, but it failed the during the 2008 financial crisis.
TSX Financials Index (TFS) 2014–2024
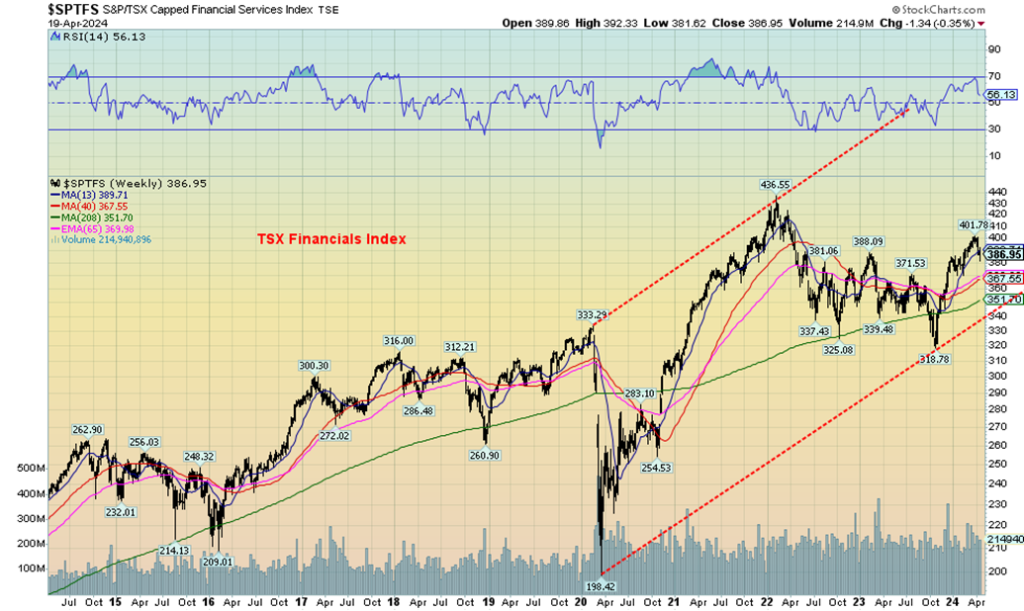
Not to be left out, the TSX Financials Index (TFS) is not looking great either. However, it held up better than the U.S. bank indices, rebounding well past the 4-year MA currently around 351. Nonetheless, TFS has failed to make it back to the high of 2022. Not a good sign. Royal Bank of Canada (RY), Canada’s largest bank, did make it to new highs, but now appears to be rolling over. Canada’s banks are well capitalized and could survive a global financial crisis as they did during the 2008 financial crisis. Nonetheless, that didn’t stop the TFS from falling 60% during the 2008 financial crisis. TFS also fell 40% during the pandemic panic of March 2020. TFS is down roughly 12% from its all-time high in 2022.
Banks are the pulse of the financial system. If banks are in trouble, then it usually means the economy is as well. JPM’s gap down and the failure of the major indices in the U.S. at an important MA are signs that things may not what they appear to be. Short-term JPM is approaching oversold levels. But that doesn’t mean it is going to make a final low. Caution is advised on the financial sector.
Markets & Trends
| % Gains (Losses) Trends | ||||||||
| Close Dec 31/23 | Close Apr 19, 2024 | Week | YTD | Daily (Short Term) | Weekly (Intermediate) | Monthly (Long Term) | ||
| Stock Market Indices | ||||||||
| S&P 500 | 4,769.83 | 4,967.23 | (3.1)% | 4.1% | down | up | up | |
| Dow Jones Industrials | 37,689.54 | 37,986.40 | flat | 0.8% | down | up | up | |
| Dow Jones Transport | 15,898.85 | 15,498.11 | (2.7)% | (2.5)% | down | down (weak) | up | |
| NASDAQ | 15,011.35 | 15,282.01 | (5.5)% | 1.8% | down | up | up | |
| S&P/TSX Composite | 20,958.54 | 21,807.37 | (0.4)% | 4.1% | neutral | up | up | |
| S&P/TSX Venture (CDNX) | 552.90 | 567.02 | (3.5)% | 2.6% | neutral | up | down | |
| S&P 600 (small) | 1,318.26 | 1,253.80 | (1.3)% | (4.9)% | down | neutral | up | |
| MSCI World | 2,260.96 | 2,265.93 | (2.1)% | 0.2% | down | up | up | |
| Bitcoin | 41,987.29 | 63,992.60 | (4.9)% | 52.2% | down | up | up | |
| Gold Mining Stock Indices | ||||||||
| Gold Bugs Index (HUI) | 243.31 | 262.73 | (0.1)% | 8.0% | up | up | up (weak) | |
| TSX Gold Index (TGD) | 284.56 | 314.49 | 0.5% | 10.5% | up | up | up | |
| % | ||||||||
| U.S. 10-Year Treasury Bond yield | 3.87% | 4.63% | 2.4% | 19.6% | ||||
| Cdn. 10-Year Bond CGB yield | 3.11% | 3.77% | 1.9% | 21.2% | ||||
| Recession Watch Spreads | ||||||||
| U.S. 2-year 10-year Treasury spread | (0.38)% | (0.36)% | 5.3% | 5.3% | ||||
| Cdn 2-year 10-year CGB spread | (0.78)% | (0.52)% | 7.1% | 33.3% | ||||
| Currencies | ||||||||
| US$ Index | 101.03 | 106.13 | 0.1% | 5.1% | up | up | up | |
| Canadian $ | 75.60 | 72.78 | 0.2% | (3.7)% | down | down | down | |
| Euro | 110.36 | 106.55 | 0.1% | (3.5)% | down | down | down (weak) | |
| Swiss Franc | 118.84 | 109.83 | 0.4% | (7.6)% | down | down | neutral | |
| British Pound | 127.31 | 123.72 | (0.7)% | (2.8)% | down | down (weak) | down (weak) | |
| Japanese Yen | 70.91 | 64.67 (new lows) | (0.9)% | (8.08)% | down | down | down | |
| Precious Metals | ||||||||
| Gold | 2,071.80 | 2,413.80 | 2.2% | 16.5% | up | up | up | |
| Silver | 24.09 | 28.84 | 2.8% | 19.7% | up | up | up | |
| Platinum | 1,023.20 | 943.80 | (4.7)% | (7.7)% | up (weak) | up | down (weak) | |
| Base Metals | ||||||||
| Palladium | 1,140.20 | 1,026.40 | (3.0)% | (10.0)% | neutral | down (weak) | down | |
| Copper | 3.89 | 4.50 (new highs) | 4.4% | 15.7% | up | up | up | |
| Energy | ||||||||
| WTI Oil | 71.70 | 82.22 | (4.0)% | 14.6% | up (weak) | up | up (weak) | |
| Nat Gas | 2.56 | 1.75 | (1.1)% | (31.6)% | down | down | down | |
New highs/lows refer to new 52-week highs/lows and, in some cases, all-time highs.
- * New All-Time Highs
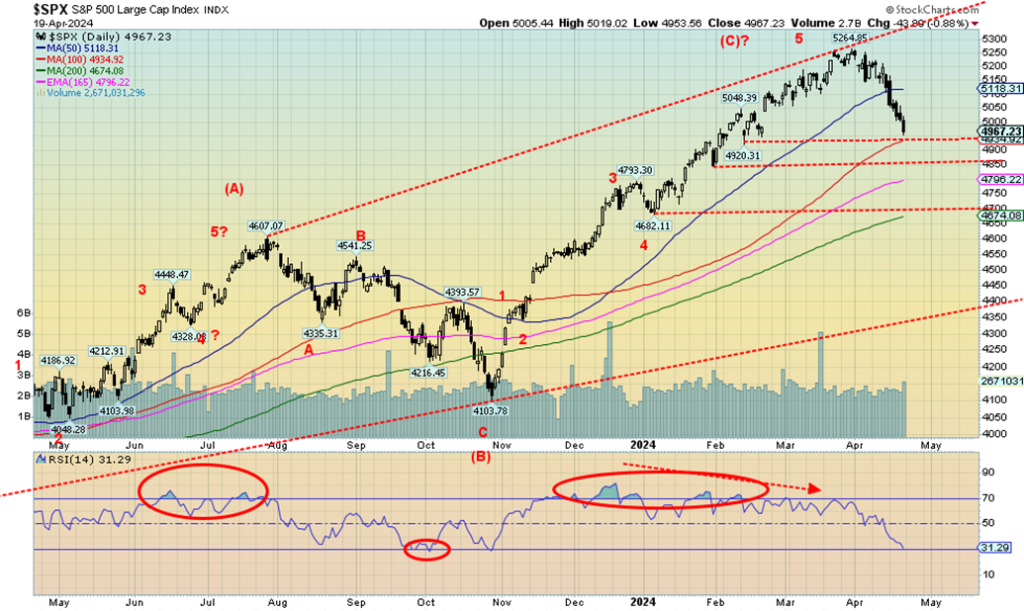
Is the party over? That’s a question we must ask ourselves as the S&P 500 suffered its worst week in 14 months since March 2023. We received our first sell signal on the S&P 500 when it broke under 5,100. Now it is sitting on the cusp of our next breakdown level at 4,900. The odds favour that it should break. On the week, the S&P 500 was down 3.1%, the Dow Jones Industrials (DJI) is benefitting from flight to safety of big blue chips and was flat on the week. Not so lucky was the Dow Jones Transportations (DJT), falling 2.7%. The NASDAQ was the weakest, falling 5.5% as the FAANGs were hit (see next) and the NY FANG Index was down 8.3%. The S&P 400 (Mid) was down 2.2% while the S&P 600 (Small) dropped 1.3%. The S&P 500 Equal Weight Index held up but still fell 1.4%. Bitcoin fell 4.9% and was at one point close to breaking under $60,000.
In Canada, the TSX Composite fell only 0.4% but the TSX Venture Exchange (CDNX) was hit, down 3.5%. In the EU, the London FTSE was down 1.2%, the EuroNext fell 1.0%, the Paris CAC 40 was up a small 0.1%, but the German DAX dropped 1.1%. In Asia, China’s Shanghai Index (SSEC) rose 1.5% but Japan’s Tokyo Nikkei Dow (TKN) fell a sharp 6.2%. Hong Kong’s Hang Seng (HSI) fell 0.8%. The MSCI World Index fell 2.2%. Not a good week all around. And it brings us a step closer to outright sell signals. Under 4,700 would signal it’s all over.
As we noted, the S&P 500 is resting near the next breakdown zone under 4,900. Below that, a break under 4,850 would be further evidence of a breakdown. Nonetheless, as we approach oversold, a counter trend rally could get underway. Below 4,200 is an official bear market as at that point the S& 500 would be down over
20%. There is a rising level of risk in the world with the Russia/Ukraine conflict, the potential for the Middle East war to become the Israel/Iran war, dysfunction and polarization in domestic politics in the U.S. in particular, but also present in the EU and Canada. Add in rising global debt and you have the potential for an accident in the debt market and a major collapse. Rising bond prices could be the trigger for a big failure, whether it be a sovereign debt collapse or the failure of a major bank or corporation.
As to the wars, there are continual rumours of upping the ante in the Russia/Ukraine conflict with calls for NATO troops in Ukraine, even as denials are also strong that would happen. Macron of France mused about it and Orban of Hungary has called for NATO troops in Ukraine to prevent a collapse of Ukraine. Add in the unknowns of severe storms, wildfires, floods, hurricanes, and tornados, and the costs of global warming are rising with polarization as to what to do, ranging from nothing to everything. All in all, it is an increasingly volatile world and a falling stock market is a reflection of the growing uncertainty.
Regaining 5,200 would be positive and suggest new highs ahead. Otherwise, a breakdown under 4,900 looks more likely. The short-term trend (dailies) has turned down. A sign that all is not well?
Consumption Patterns 2023–2024
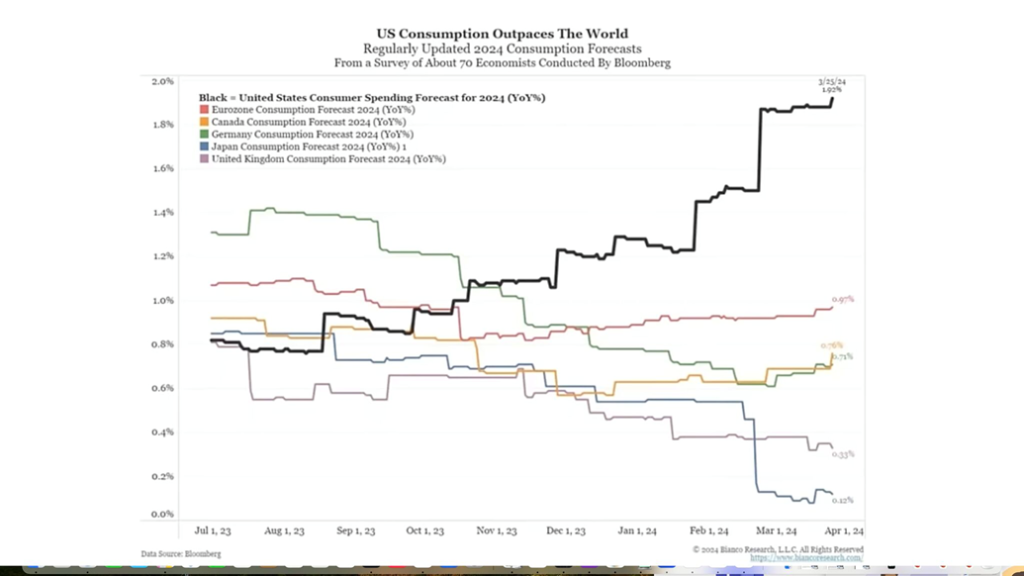
Here is an interesting chart we found. We can only guess this is a good reason why the U.S. is doing so much better than others. Americans consume, more than anyone else. That’s what they do best. Maybe that’s why consumer debt is as high as it is. Canadians also consume and have some of the highest consumer debt to income and GDP in the world. Japan is in a funk that they can’t seem to get out of. The U.K. is just above them. Germany, Canada, and the eurozone are in between. U.S. consumption seems to be going almost parabolic. Parabolics don’t end well.
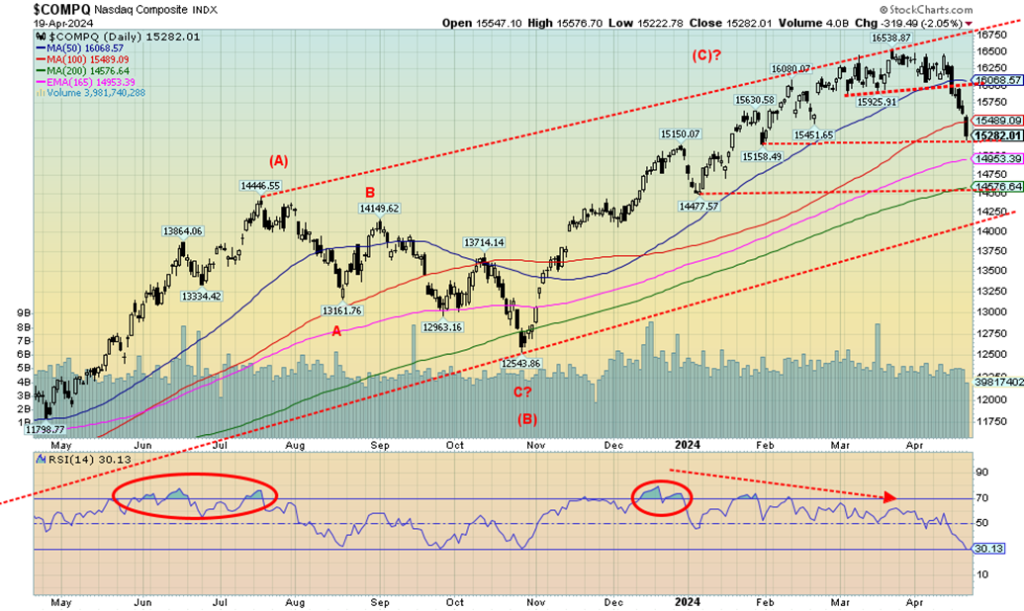
The NASDAQ took it on the chin this past week, falling 5.5%. It was all thanks to the NY FANG Index that dropped 8.3%. Leading the way down was Nvidia, the leader of the Magnificent Seven, that fell 13.6% (see next). NVDA wasn’t alone as Tesla actually led the group down, falling 14.0%. Netflix gapped down, just off 10.9% on the week, Meta fell 6%, Apple was down 6.6%, Amazon was off 6.2%, Microsoft fell 5.4%, and rounding out the group was Google that fell the least, off 2.2%. Other FAANGs of note were Snowflake, down 8.1%, AMD, off 10.2%, Broadcom, down 10.4%, while the Chinese FAANGs Baidu and Alibaba also fell down 2.6% and 3.1% respectively. A most unpleasant week for the Magnificent Seven. We’ll soon start calling them the Tarnished Seven.
The NASDAQ broke down from that topping pattern we noted earlier. It looked like a small head and shoulders top. It quickly fulfilled its target and now the NASDAQ rests on the next breakdown line near 15,160. We are, however, quickly becoming overbought as the RSI is now at 30. But all now looks lower. Below the next breakdown line support comes in at 14,575. Below 14,250 it’s all over. Just remember what goes up fast falls even faster. From the October 2023 low the NASDAQ had gained 31.8%. We’re now down 7.6%. Doesn’t seem like much, but it was the swiftness that caught everyone looking the wrong way. Arguably, we might have a crash pattern forming. The threat of all-out war might do that to the market.
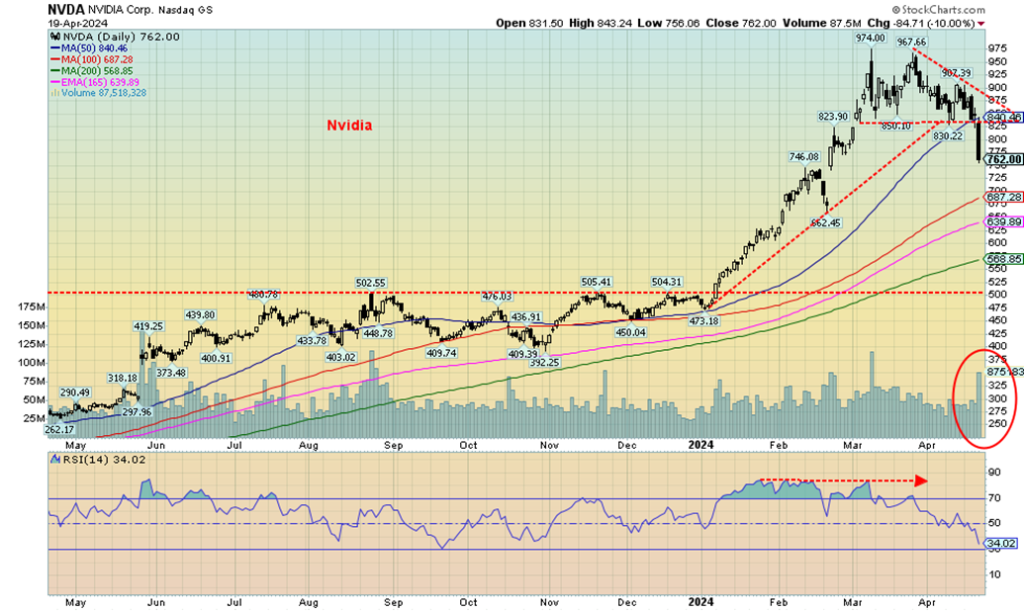
Is it over? Nvidia, the leader of the Magnificent Seven, tipped over this past week, breaking down from a clear topping pattern. Note the uptick in volume as NVDA came apart on Friday. Is the Magnificent Seven becoming the Tarnished Seven? That’s an almost 22% drop from the recent high of $974. We are in bear market territory. We’re under the 50-day MA.
That’s a long drop back to $500 and the top of that breakout zone that formed roughly May to December 2023. At that point we’d be down almost 49% from the high. NVDA fell 13.6% this past week, leading the way down. But it’s still up almost 54% in 2024. Tesla, down 40.8% in 2024, and Apple, off 14.3% in 2024, are the leaders of the Magnificent Seven that are down on the year so far. Snowflake is off 26.9% and AMD just turned negative for 2024 as well, down 0.5%. The party appears to be over.
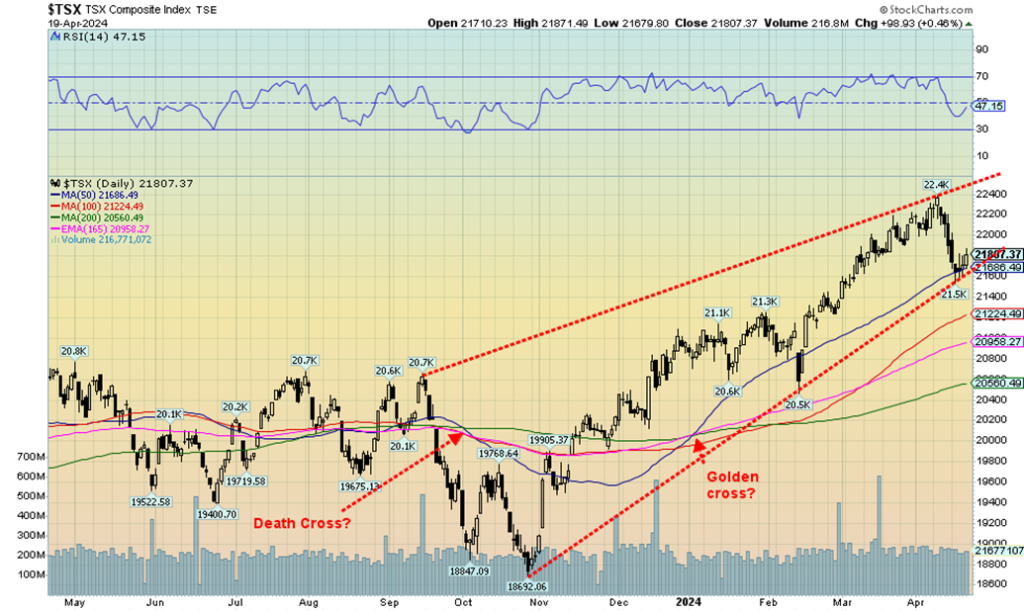
With the major U.S. indices looking a little shaky this past week, the DJI excepted, the TSX Composite looked like a star, falling only 0.4%. It was all thanks mainly to the commodity-driven sector of the TSX as Golds (TGD) and Materials (TMT) held up, gaining 0.5% and 0.6% respectively while Metals & Mining (TGM) fell only 0.1%. Four of the 14 sub-indices gained on the week with Consumer Staples (TCS) up 0.6% and Utilities (TUT) gaining 0.9%, keeping the TSX alive. Leading the downward pack was Real Estate (TRE), losing 2.6%. Most didn’t fall over 1% with the other exceptions being Healthcare (THC), down 1.5%, and Industrials (TIN), off 1.6%.
Energy (TEN) dropped 1.2% while Financials (TFS) was down 0.4%. Over at the small cap TSX Venture Exchange (CDNX), they took it on the chin, falling 3.5%. That was more in line with the U.S. indices. The TSX dropped this past week to the 50-day MA and an uptrend line from the October 2023 low. A firm break now of 21,600 could start the breakdown that could see the 200-day MA near 20,550 quickly. Under 20,500 a more serious drop could develop. New highs back above 22,400 would keep things alive. But with the U.S. markets looking distinctively tippy, the TSX should follow. Whether that takes the Materials sector with it is difficult to say at this time as that sector still looks like the best place to be (Energy, Golds, Metals and Materials).
U.S. 10-year Treasury Note, Canada 10-year bond CGB
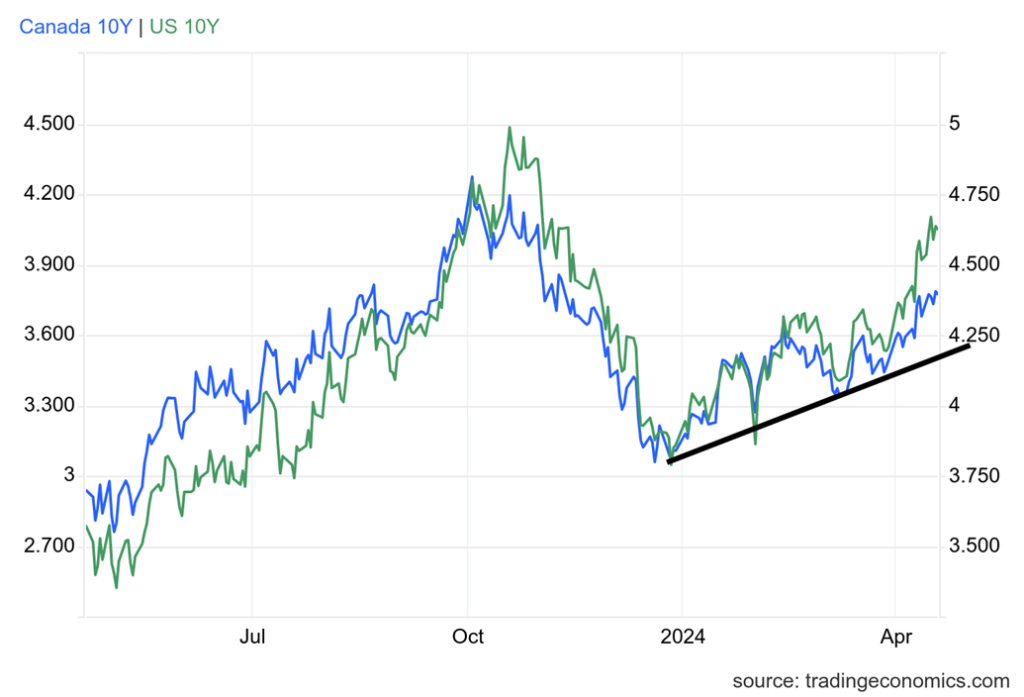
U.S. interest rates keep rising. No, not all interest rates. Just of late long interest rates. While the Fed can manipulate the short-end of the yield curve, it is the market that determines the long end of the yield curve. First, the long end of the curve is responding to continued positive signs in the U.S. economy. Retail sales surprised with a gain year over year (y-o-y) of 4%, well over the expected 2.5%. Initial jobless claims of 212,000 were as expected but, overall, remain lower than what one might expect. Yet other numbers are signaling growing problems.
The NY Empire State Index came in at negative 14.3, below the expected negative 10.0, housing starts disappointed at 1.321 million vs. the expected 1.51 million and 14.7% below the previous month, and industrial production was 0 vs. the expected +0.6. Next week are PCE prices and advanced GDP growth for Q1. PCE prices are expected to be up 2.6% while Q1 GDP growth is expected at 2.3% below last month’s estimate at 3.4%. Volatility and rising government finance needs to fund the huge deficits. The emphasis has been issuing shorter term bills and notes and not long-term bonds. Foreign holdings of U.S. treasuries were pretty flat in February vs. January. However, China fell again, down 22.7 billion in February as de-dollarization continues.
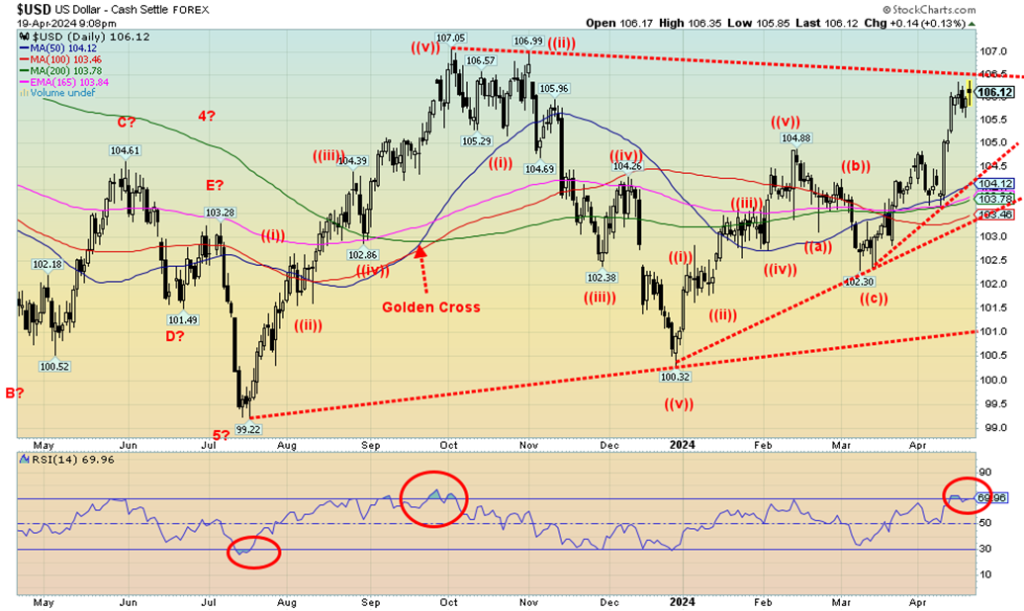
The US$ Index is now up to a key resistance zone near the highs of 2023. At just over 106 the US$ Index appears to be indicating that it could move above the September 2023 high of 107.05. However, remember that the US$ Index does not cover every currency. The US$ Index is made up of euros, pounds, yen, Cdn$, Swiss franc, and Swedish kroners. The Fed’s nominal broad trade-weighted US$ Index adds other U.S. trading partners such as China, Korea, Mexico, and many more. While the chart appears to indicate that the US$ Index should see new highs, the downside risk is a drop to 104.50.
Below that, the index could fall to 103.40. Below 103, the US$ Index could enter a bear market. The bear would be confirmed under 101. So far, the rising US$ Index has not impacted gold which, surprisingly, is rising, even as the US$ Index goes up. On the week, the US$ Index gained 0.1%, the euro was up as well 0.1%, the Swiss franc was up 0.4%, the pound sterling was down 0.7%, while the Japanese yen fell 0.9%. The Cdn$ was up just under 0.2%. The yen in particular is threatening to break to further lows. The yen made fresh 52-week lows this past week.
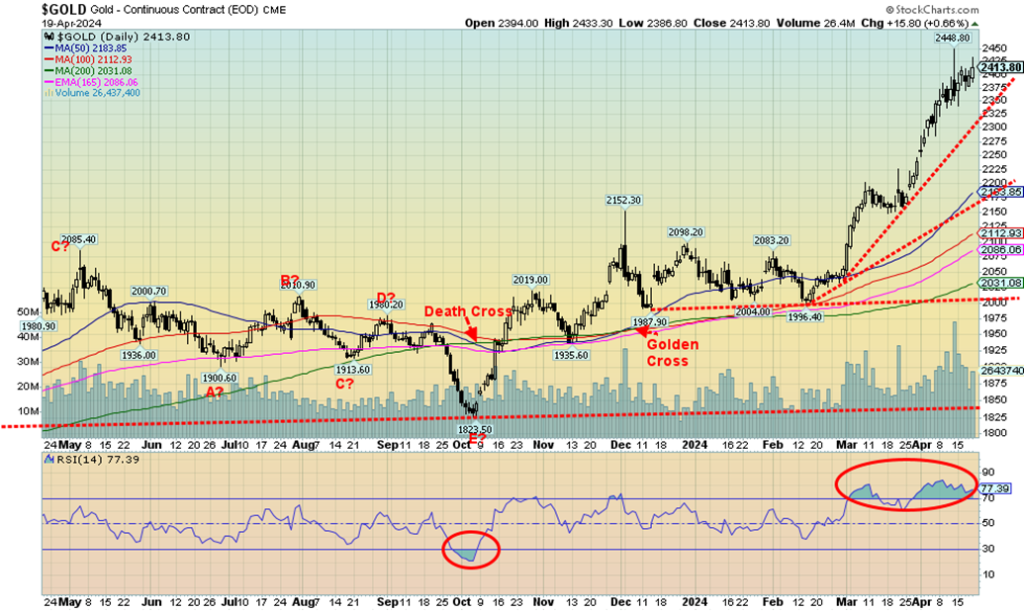
Despite rising interest rates (in the long end of the yield curve) and a rising US$ Index, gold once again managed to go against that, gaining 2.2% this past week. This seems to be prompted by fear of expansion of the Russia/Ukraine war and, increasingly, the risk of a much bigger war in the Middle East as the focus moves from Israel/Hamas to Israel/Iran. The bombing this week of some facilities in Isfahan, Iran sparked concern of a bigger conflict.
While the hit was largely a slap on the wrist, it did have its impact. Corrections along the way would help with the overbought conditions as gold’s RSI has been at 70 or higher now since mid-March. However, a powerful bull market appears to be underway and the RSI can stay higher for longer. The commercial COT is not overly friendly at 27.2%. We’d prefer to see that well over 30. But the 2009–2011 bull saw the commercial COT remain below 30 throughout.
Gold is now up 16.5% in 2024, outpacing the stock market. Silver gained 2.8%, but the metal that was the big winner this past week was copper, up 4.4% to fresh 52-week highs. We expect that copper is going higher, possibly over $5. The all-time copper high was at $5.04 for front month futures set in March 2022. We have now passed the point that suggests new all-time highs lie ahead. Platinum lost 4.7% while palladium was down 3.0%. Both have struggled in 2024, particularly platinum which should be more closely aligned with gold. Platinum is also known as white gold. The gold stock indices were mixed with the Gold Bugs Index (HUI) off about 0.1% and the TSX Gold Index (TGD) up 0.5%. They both seemed to be trading more in line with the stock market that fell this past week.
Gold rising despite rising long interest rates and a rising US$ Index is interesting, as it appears to indicate a shift in sentiment. Yes, we have the fear trade, but we also have inflation eroding all fiat currencies. They are also concerned about the U.S. dollar and the U.S.’s dominance in international bodies such as the IMF. Attempts to take Russia’s assets are also catching their attention, as they believe if it can happen to Russia it could happen to them as well. We also see a rise in demand by central banks to shore up their gold reserves to protect their currency.
We appear to have entered a strong bull market with potential targets now up to $2,500/$2,600. A drop through $2,350 now could signal a correction. Below $2,250 would give a better sell signal. But with this strong market and a background conducive to gold, our expectations are for higher prices. A reminder that gold has no liability, it has been currency and money for over 5,000 years, it’s real (unlike Bitcoin), and when confidence is flagging against government it acts as a hedge.
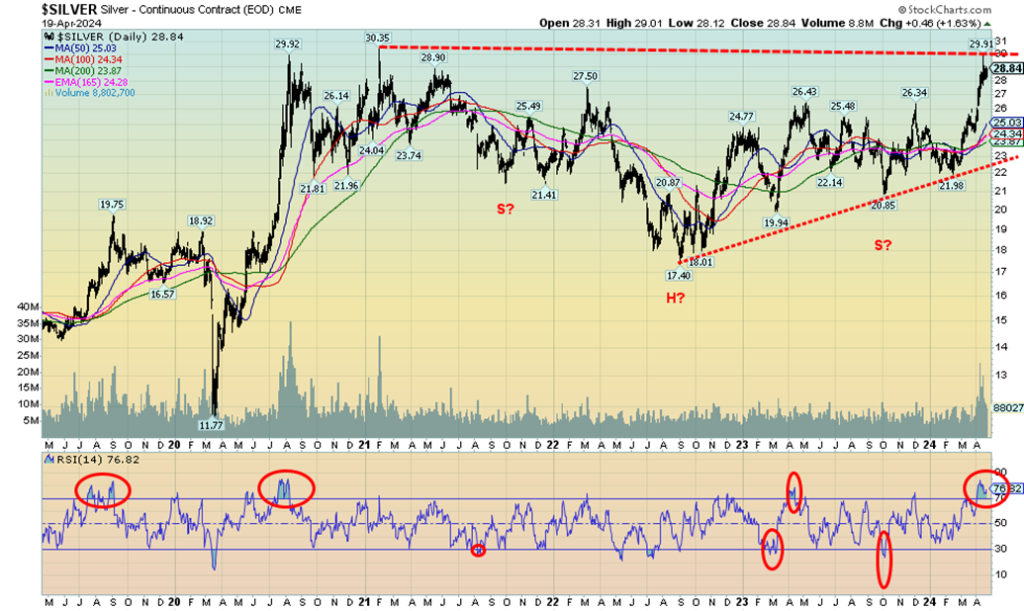
Silver enjoyed another solid week up, gaining 2.8%. Silver is now up 19.7% in 2024. Silver is the poor man’s gold and, with gold soaring to over $2,400, many are instead shifting to silver. That in turn has helped the gold/silver ratio that has fallen to 83.68 last vs. a high of 92.41 in February 2024. Still, that is a long way from the 31.53 seen at the 2011 high and especially the 14.57 level seen at the 1980 high. The latter is more closely aligned with the gold/silver ratio in nature. To reach those levels, silver would need be at $76 to equal 2011 or $164 to equal the 1980 ratio. It assumes gold at $2,400. What’s key for silver will be breaking above $30 and the February 2021 high of $30.35.
That in turn could spark a sharper run-up with potential to reach as high as $43 and at least $39/$40, according to that head and shoulders pattern visible on the charts. We’ve noted before the huge potential of a what appears to as a multi-year cup and handle pattern that could project to $75. Global silver demand is projected to reach 1.2 billion ounces in 2024, roughly the same as 2023. Industrial demand and, increasingly, demand for investment purposes are driving prices higher. Production in 2023 was 25,831 metric tonnes but demand was 37,168 metric tonnes.
The shortfall of 11,377 metric tonnes has to be made up with melt of old silver (scrap silver). Demand could be higher in 2024. India had record imports in 2023. The commercial COT isn’t too friendly at 27.8%. We’d prefer to see that over 40%. Volume has picked up recently, suggesting buying power behind the up move. We’re optimistic that silver prices should soon be through $30.35 and then move to higher targets near $40. A drop back through $27.50 would be our first sell signal. Back under $26 would confirm a breakdown.
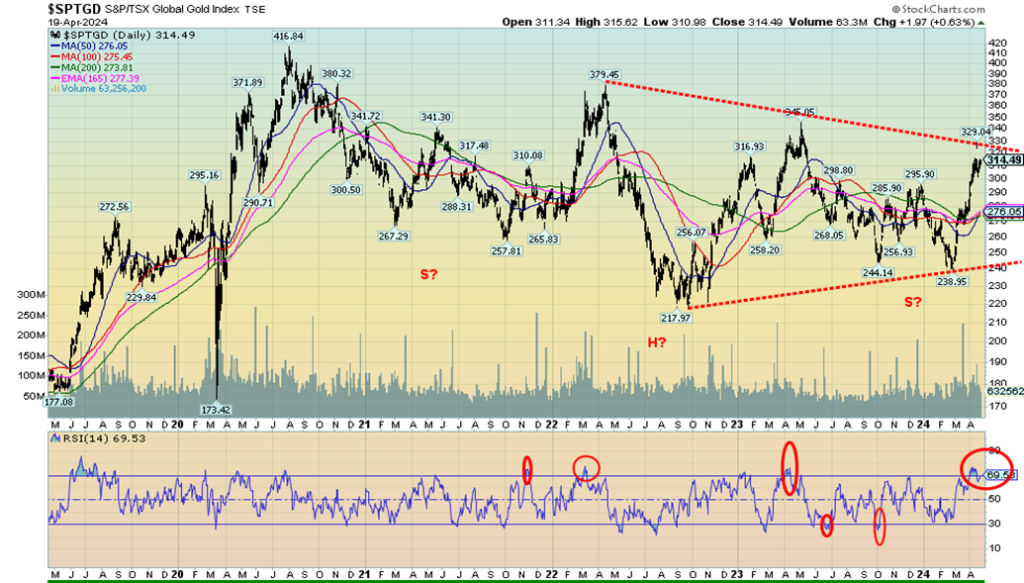
The gold stock indices did not do a lot this past week, despite an up week from both gold and silver. In that respect they underperformed. They may have been influenced by the weak broader stock market that sold off. On the week, the TSX Gold Index (TGD) gained 0.5% while the Gold Bugs Index (HUI) lost about 0.1%. It was the second down week in a row for the HUI. However, the declines were very small. The TGD gained both weeks but not a lot. This leaves the TGD hanging above the 300 breakout point but under another breakout over 330. We seem to be indicating that we should break above the May high of 345.
The rather awkward-looking head and shoulders bottom reversal pattern (awkward as usually the right shoulder does not fall below the left shoulder; thus, it makes the pattern somewhat suspect) points to potential targets up to around 425/430. The all-time high of 455 was set in 2011. The 417 high of August 2020 was the closest we’ve been since. We did get a little overbought, but not seriously. The odds continue to favour higher prices for the gold stocks that remain grossly undervalued vs. the price of gold. And, as we note next, gold and gold stocks make up a very small proportion of global assets.
Ergo, that’s why these indices can be volatile as the market is quite small by comparison. The gold miners remain cheap despite the recent run-up. And they remain cheap vs. gold as well with the Gold/HUI ratio at 9.19. At its lows through 2003–2006, lows were seen at 1.6. Even in gold stock rallies in 2016 and 2020 the ratio got between 4.75 and 5.30. 5.30 today would imply that the HUI would be 450/455. The HUI’s all-time high was 639 in 2011. Today, that would imply a Gold/HUI ratio of 3.75. If we ever got down to those 2006 lows, the HUI would be at 1,500. Instead, today it is at 263 while gold is at $2,400. We have a way to go.
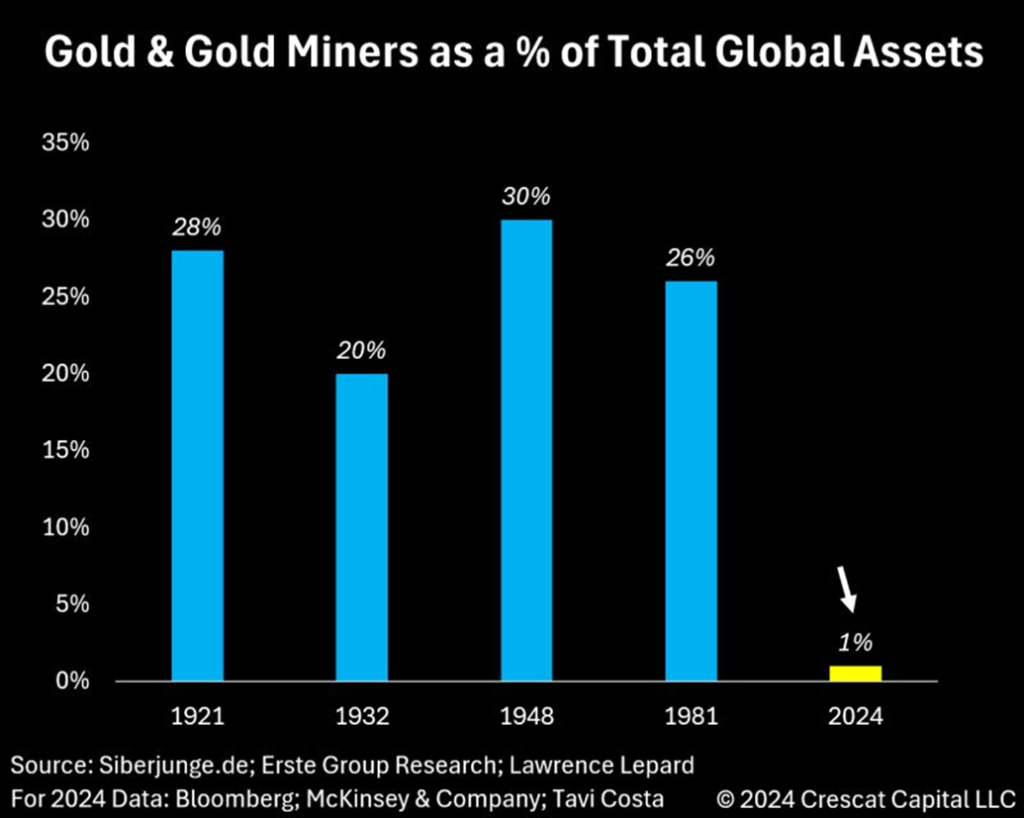
We’ve always said that gold and gold miners were a small percentage of total global assets. Now here is a chart that appears to support that thesis. According to this chart, gold and gold miners are at their lowest point in the past century as a share of global assets. This also fits our own thoughts that the past decade since the top in the gold and gold miners’ market in 2011 has, for the most part, been in a depression. We are now seeing signs that this could be changing. Could it be another false hope as was seen in 2016 and again in 2020/2021 or are we to embark on an historical bull market as we saw from 2001 to 2011? The market is small and it wouldn’t take much of shift from the broader market into gold and the gold miners to move the market higher quickly.
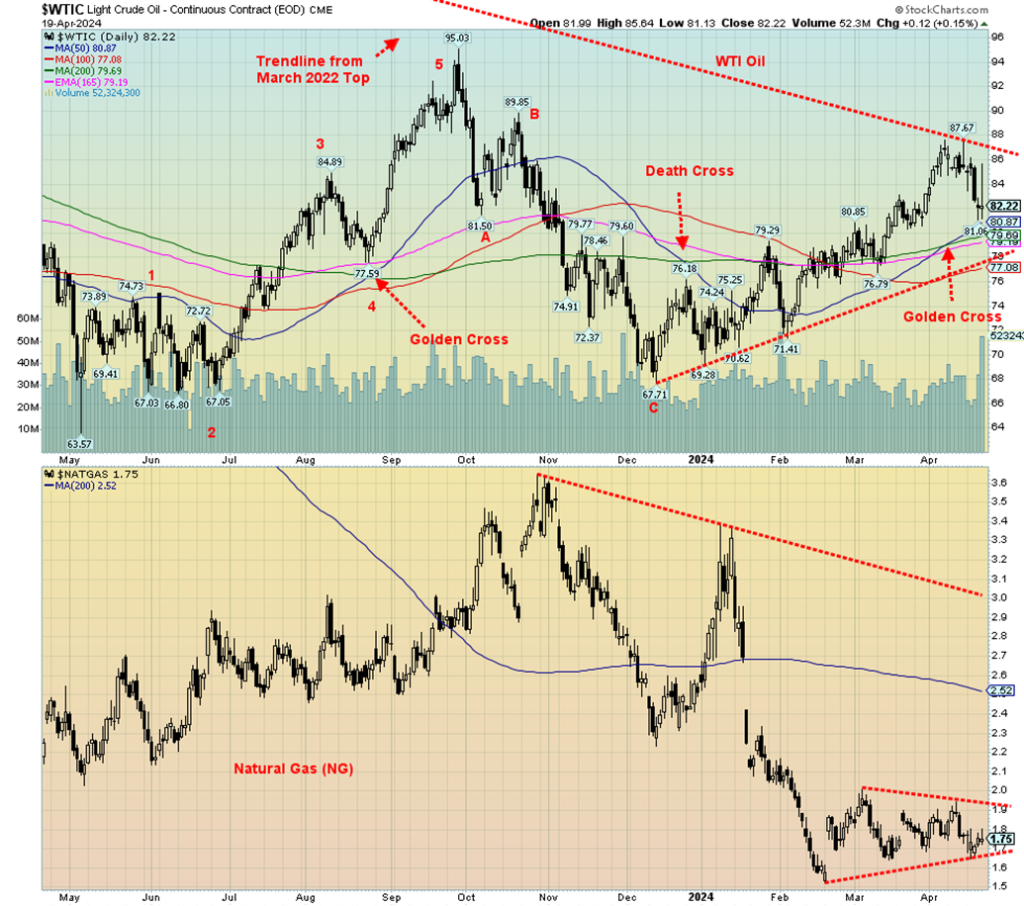
WTI oil and Brent crude may have spiked higher on the news that Israel had hit Iran, but it didn’t last long when everyone discovered this was merely a tap. What saw both oils spike quickly turned sour and they finished basically unchanged. That came after a weak week that saw WTI oil fall 4.0% while Brent crude dropped 3.5%.
Natural Gas (NG) joined the down parade, losing 1.1% while NG at the EU Dutch Hub fell a small 0.3%. The energy indices weren’t spared as the ARCA Oil & Gas Index (XOI) dropped 2.5% and the TSX Energy Index (TEN) was off 1.2%. The fear of an outbreak of war in the Middle East where 31.5% of the world’s oil is produced is offset by plentiful supply, despite sanctions vs. Russia and Iran and production cuts by OPEC and U.S. reserves creeping back to full capacity. Right now, U.S. WTI reserves are back to about 85% where they are normal on a seasonal basis.
Despite the drop in NG both at the Henry Hub and the Dutch HUB, both came back at the end of the week. There is some fear growing that Russia could target Ukraine’s NG underground storage facilities. Japanese LNG buyers are also trying to stock up quickly just in case things break down. Still, supplies are good in both the EU and North America.
If good weather prevails, it also lowers demand. Oil prices are volatile because of the goings-on in the Middle East and Russia/Ukraine, but good supplies are keeping things steady for the moment. That could all change quickly if things really heated up against Iran and, instead of a slap on the wrist as we saw with the attack on Isfahan, Iran, it results in a full-out pounding.
Technically, we are testing the former breakout zone at $82/$84. We now need to break out over $87.50 to send us to higher levels. A breakdown under $77 could send oil prices sharply lower. We note we saw a Golden Cross this past couple of weeks as the 50-day MA crossed the 200-day MA. Whipsaws can occur, but usually the signal lasts a few weeks at minimum. We’d be concerned if we fell back under $80. Nonetheless, our expectation is that we should eventually take out the recent high near $87.70 and head over $90. The dangerous Middle East dance is just getting underway.
Copyright David Chapman
__
(Featured image by cocoparisienne via Pixabay)
DISCLAIMER: This article was written by a third party contributor and does not reflect the opinion of Born2Invest, its management, staff or its associates. Please review our disclaimer for more information.
This article may include forward-looking statements. These forward-looking statements generally are identified by the words “believe,” “project,” “estimate,” “become,” “plan,” “will,” and similar expressions. These forward-looking statements involve known and unknown risks as well as uncertainties, including those discussed in the following cautionary statements and elsewhere in this article and on this site. Although the Company may believe that its expectations are based on reasonable assumptions, the actual results that the Company may achieve may differ materially from any forward-looking statements, which reflect the opinions of the management of the Company only as of the date hereof. Additionally, please make sure to read these important disclosures.
David Chapman is not a registered advisory service and is not an exempt market dealer (EMD) nor a licensed financial advisor. He does not and cannot give individualised market advice. David Chapman has worked in the financial industry for over 40 years including large financial corporations, banks, and investment dealers. The information in this newsletter is intended only for informational and educational purposes. It should not be construed as an offer, a solicitation of an offer or sale of any security. Every effort is made to provide accurate and complete information. However, we cannot guarantee that there will be no errors. We make no claims, promises or guarantees about the accuracy, completeness, or adequacy of the contents of this commentary and expressly disclaim liability for errors and omissions in the contents of this commentary. David Chapman will always use his best efforts to ensure the accuracy and timeliness of all information. The reader assumes all risk when trading in securities and David Chapman advises consulting a licensed professional financial advisor or portfolio manager such as Enriched Investing Incorporated before proceeding with any trade or idea presented in this newsletter. David Chapman may own shares in companies mentioned in this newsletter. Before making an investment, prospective investors should review each security’s offering documents which summarize the objectives, fees, expenses and associated risks. David Chapman shares his ideas and opinions for informational and educational purposes only and expects the reader to perform due diligence before considering a position in any security. That includes consulting with your own licensed professional financial advisor such as Enriched Investing Incorporated. Performance is not guaranteed, values change frequently, and past performance may not be repeated.

-

 Cannabis7 days ago
When a Cutting Becomes a Cannabis Plant: Court Clarifies Germany’s Three-Plant Rule
-

 Africa2 weeks ago
Ivory Coast Development Plan 2026–2030: Investment, Growth, and Strategic Reforms
-
 Africa3 days ago
MASI Surge Exposes Market Blind Spot: The SAMIR Freeze and Hidden Risks
-

 Crypto1 week ago
Bitcoin Rebounds Above $70K as Crypto Markets Show Fragile Signs of Recovery


