Featured
The FOMC Revealed That Higher Interest Rates Are Coming
Have the stock markets topped? That is the message we are receiving from the stock market action over the first five days of 2022. The first five days acts as an early warning system for the January barometer. We explain in our main essay. If correct then 2022 is lining up to be a potentially difficult year. It reminds of 1973 and the “Nifty Fifty” rally. This time it has been the FAANGs rally.

2022 is starting off where 2021 left off. The Omicron variant is rampaging, setting records for cases. Comparatively, however, it is not setting records for deaths. The Russia/U.S./Ukraine/NATO tensions continue with daily postings that Russia is about to invade Ukraine. The drama continues in Washington with the January 6 committee. Many of the high-profile Republicans subpoenaed continue to defy the committee, keeping alive the numerous stories we have seen posted that U.S. democracy is at serious risk and the country could descend into civil war. There are, as we know, precedents. As well, we have our first possible climate change event of the year with a freak snowstorm that stranded hundreds of motorists along the I95 in Virginia for up to 24 hours. As to the stock market—well, things did not go well there either.
It’s January. The beginning of a New Year. It’s the month for the January barometer. So, what is the January barometer? It was devised by Yale Hirsch of the Stock Trader’s Almanac (www.stocktradersalmanac.com) in 1972. The barometer says, “as the S&P 500 goes in January, so goes the year.” Since 1950, it has had only 11 major errors for an incredible 84.5% accuracy ratio. The years it was out were: 1966, 1968 (Vietnam), 1982 (bottom of the 1966–1982 bear), 2001 (9/11), 2003 (invasion of Iraq), 2009 (end of the 2000–2009 bear), 2010 (QE2), 2014 (QE3), 2016 (bear sell-off averted), 2018 (Trump trade wars), and 2020 (COVID). We can’t help but note that five of the 11 occurred following the 2008 financial crash and 2007–2009 Great Recession. There were also eight flat years. Bear markets continued when January was down.
Of course, it’s too early to determine the January barometer. But we are now completing the first five days and that normally acts as an early warning system. For up years, the first five days were accurate 38 times out of 46 for an 82.6% accuracy ratio. As to when the first five days were down, that barometer was not as accurate with only 11 right out of 25 (44%). So, what happened in the first five days? The S&P 500 put in an outside key reversal week to the downside. The S&P 500 made new all-time highs and then reversed, falling below and closing below the low of the previous week. On the week the S&P 500 fell 1.9%. So, does that portend a down month or a down year?
The early warning system appears to be suggesting yes. The suggestion is that 2022 will be a difficult year. It was not a great start. But, the month is not over yet. However, we could not help but notice some possible comparisons. The reminder is 1973. We bring back the ghost of the “Nifty Fifty” rally of 1972. Yes, 1972: Watergate, geopolitical tensions as the war in Vietnam continued, Israel/Palestine tensions even as the U.S. sought détente with Russia and China. 1973 brought us more Watergate, the Arab/Israeli war, and the Arab oil embargo that saw oil prices triple and long lineups at the pumps. The S&P 500 made its final top on January 11, 1973. Over the next two years the S&P 500 fell 48%, bottoming in October 1974.
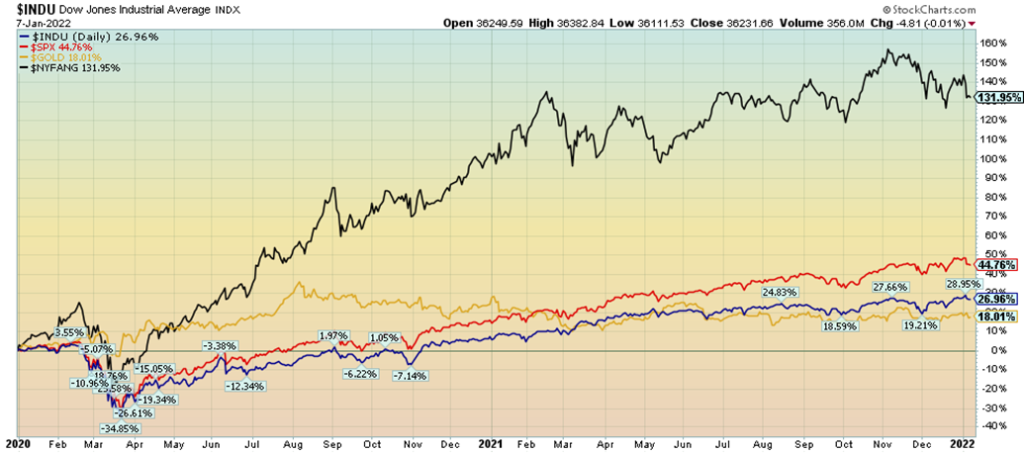
Today we have deteriorating market breadth. Even as the S&P 500 continued to make new all-time highs, the number of stocks participating in the rally became fewer and fewer. By December 2021, the number participating had fallen to 42%, down from 90% earlier in the year. The number of new highs less new lows peaked in May 2021 and has been falling generally ever since. The FAANGs have dominated with a return of 132% since the beginning of 2020 while the S&P 500 gained about 45% and the Dow Jones Industrials (DJI) rose roughly 27%. Gold rose only about 18%. Are the FAANGs today’s “Nifty Fifty”? Just five technology stocks accounted for 24% of the S&P 500’s advance in 2021. They are Microsoft, Apple, Nvidia, Alphabet (Google), and Tesla. In Canada it is much the same. Ten stocks dominate the TSX Composite accounting for 37% of its market capitalization. The ten are: Royal Bank, TD Bank, Shopify, Bank of Nova Scotia, Brookfield Asset Management, CN, CP, Enbridge, Bank of Montreal, and Thomson Reuters.
The FAANGs have Dominated—Comparative Performance 2020–date
Instead of Watergate we have the January 6, 2021 investigation. Like Watergate, the investigation is threatening to tear the country apart. Only this one is more serious. Unlike Richard Nixon who was soundly rejected following Watergate, the former president continues to be embraced by millions that the election was stolen. Geopolitically, we have U.S./Russia tensions and U.S./China tensions. As noted, stories abound that Russia is about to invade Ukraine and China is about to invade Taiwan. As to the likelihood of that happening, that remains to be seen as the geopolitical games are played out.
We also have rising oil prices. Brent crude’s average price in 2021 was $71/b, the highest in three years. Production has lagged demand and there have been only slow increases in supply from OPEC. Investment in oil has been falling and weather (hurricanes, cold weather) have negatively impacted supplies. Inventories have been falling and countries like China have been building up their strategic reserves, putting further pressure on demand. Oil prices have gone up only 27.5% since January 2020 but are up almost 1,100% since the depths of pandemic crash in March 2020.
To add to the woes, the Omicron variant of COVID is seeing record numbers globally and particularly in the U.S. and a number of EU countries. Hospitals are being overwhelmed and the situation is being exacerbated by health care workers coming down with Omicron or worse, quitting. Health care workers are not the only ones being negatively impacted as teachers, police, and more are also facing staff shortages. The impact of the Omicron, however, most likely will not manifest itself until the January economic numbers are released in February.
S&P 500 1998–2022 Monthly
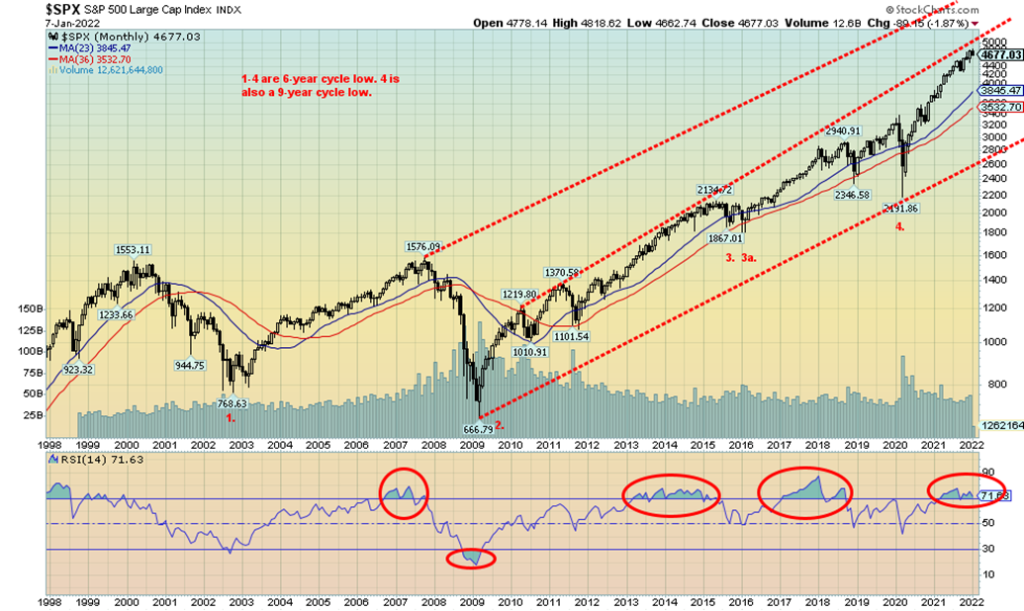
Our monthly chart of S&P 500 1998–2022 shows the 6-year cycle lows (range 5–8 years). The 6-year cycle low is 1/3 of the 18-year cycle. Those lows occurred in 2002, 2009, 2015/2016, and 2020. The 18-year cycle (range 13–21 years) last bottomed in March 2009 with the 2007–2009 Great Recession. From the key 1932 low we do note examples of the 18-year cycle low in 1949 (17 years), 1970 (21 years, it is a bit of a stretch to 1974 given it is 25 years from 1949), 1987 (17 years), and 2009 (21.3 years). The next 18-year cycle low is due anywhere from 2022-2030. The question is, are we cresting for the second half-cycle? The March 2020 low was likely a half cycle low coming 11 years after 2009. If so, the fall could be very hard, in the range of 40% to 50%. We appear to approaching the top of a channel that has topped the market since 2010/2011. If this is the crest of the market, we admit it is early but it is possible, especially given the down week to start the New Year.
A more well-known cycle is the 4-year cycle (range 36–56 months). Within the 18-year cycle there are usually five 4-year cycles: 2011, 2015/2016, 2020. 2022 could mark the fourth since the low of 2009; however, the low is likely to be seen later in the year. Even in 1973, while the market topped in January, it wasn’t until October that a more serious decline got underway following the Arab oil embargo and the Arab/Israeli war.
Adding to the woes is a hawkish Fed. The FOMC minutes, which shouldn’t have been a surprise, supported the premise that the Fed is taking away the “punch bowl.” The current QE program could be over by March. There is now talk that the Fed could start to cut its balance sheet (QT) by actually selling securities to the market. Market participants are pricing in at least three rate hikes in 2022 and some are pricing in four rate hikes. Four rate hikes would raise the Fed rate to 1.00%. Doesn’t sound like much, but when one considers it has been for all intents zero percent since the COVID recession of 2020, a rise to 1.00% is a big jump. In January 2020, before the COVID panic, the Fed Fund’s rate was at 1.55% after hitting a peak of around 2.40% in January 2019.
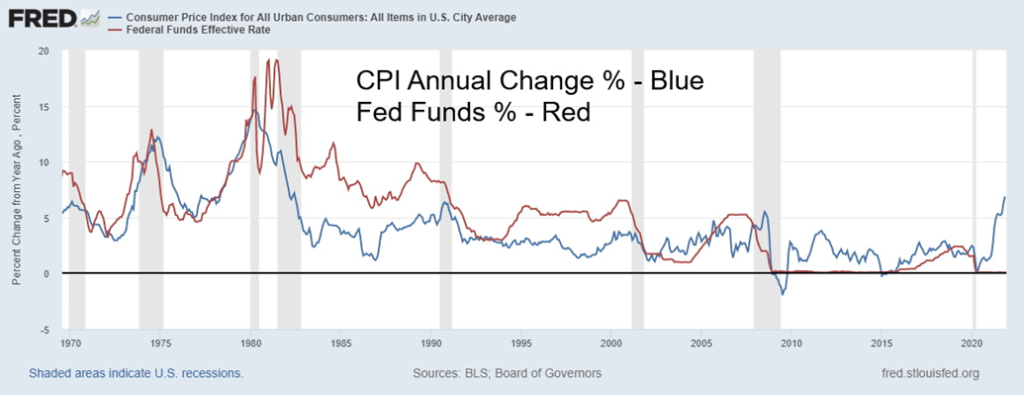
The Fed has been citing the rise in inflation that has seen prices jump their highest in nearly forty years. The jump in the CPI has sparked one of the widest spreads between Fed Funds and CPI ever seen currently at negative 6.80%. Not even during the great 1970s inflation did the spread between Fed Funds and CPI reach those levels. Inflation has been rising due to supply disruptions and sudden sharp increases in demand sparked by the COVID crisis which is now reaching unheard-of proportions.
In turn, the potential for higher interest rates has sparked a jump in bond yields globally. The U.S. 10-year treasury note has jumped from 1.35% in early December to 1.76% today. Japan’s 10-year treasury (JGBs) is up to 0.08% from 0.035%, while the German 10-year bund has leaped to negative 0.12% from negative 0.38%. In the U.S., the overnight swaps rate is suggesting a 0.25% jump in rates by March.
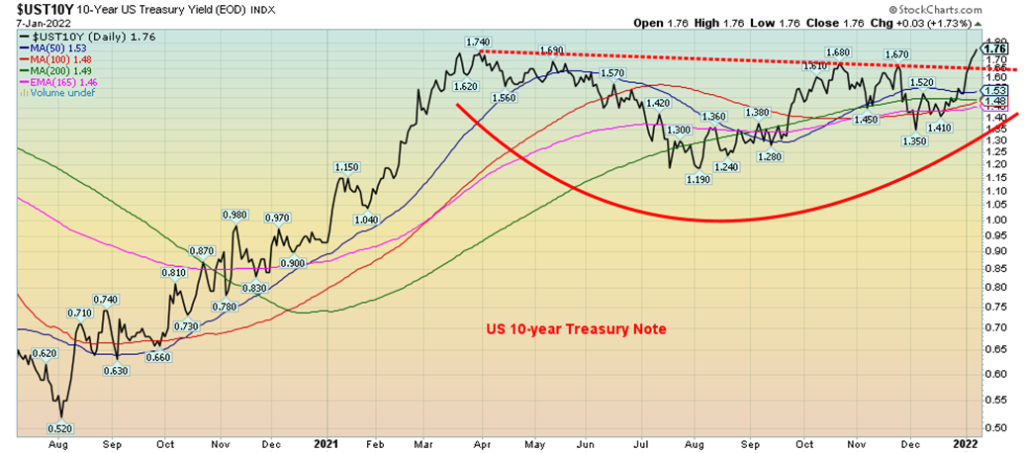
Could the U.S. 10-year treasury note be poised to break out to higher levels? It shows a potentially awkward-looking head and shoulders pattern. It’s questionable because the left shoulder (if any) is small by comparison to the right shoulder. Irrespective of this, a firm breakout to new highs above 1.74% could point to a rise to at least 2.25% for the 10-year.
The Fed, however, is trapped. Typically, the Fed hikes rates too little late and then they overshoot. Taking away the “punch bowl” by hiking rates, slashing QE, and even conducting QT (selling securities) could spark a stock market panic and a housing market collapse. After all, if one wants to see where the real inflation is, one need look no further than the price rise of stocks and houses over the past few years. Gold has negatively responded to the potential for interest rate hikes as it makes gold less attractive. Bitcoin is also falling as a result of the Fed’s hawkish stance. The expectation is that a combination of rate hikes and easing of supply disruptions could bring down the rate of inflation and narrow the current wide negative spread. At least the U.S. did not fall into the trap of negative interest rates as the EU did. Negative rates have effectively destroyed the EU’s bond market.
2022, it would seem, is not off to a good start.
Chart of the Week
US Job Numbers
The December jobs report turned out to be a bit of a yawn. We say that because of the reaction to the report, not the report itself. Markets, for the most part, appeared to be hesitant as to what to do next. Nonfarm payrolls came in at half the expectation at 199,000 when the market was looking for at least 400,000. November reported 249,000 jobs. Not good. But hold on. The unemployment rate (U3) fell to 3.9% which was great because they had expected it to decline to only 4.1% from November’s 4.2%. At 3.9% we are not far from the February 2020 rate of 3.5%. All of this was impressive in that the labour force participation rate was unchanged at 61.9%. The participation rate grew for women (56.5% vs. 56.3%) but fell for men (67.7% vs. 67.8%). The employment population ratio rose to 59.5% from 59.3% but still sits behind the 61.2% seen in February 2020. The all-time high was 64.7% in April 2000. Wages grew by 4.8% year over year, well above the expected 4.1% gain.
With the unemployment rate falling to the lowest level since the start of the pandemic, some are claiming we are now almost at full employment. However, that would be seriously misleading, given that the U.S. is still short 3,572 thousand jobs from the levels seen in February 2020. As well, note that the labour force participation rate has fallen to 61.9% from 63.4% in February 2020. Note, the civilian labour force has fallen 2,289 thousand since February 2020. A lower civilian labour force coupled with a lower participation rate translates into a lower unemployment rate. All this makes things look better than they really are.
So, was this a good report, or a not so good report? Job creation lagged expectations, but the unemployment rate fell and wages rose. That is what the market focuses on. By mid-morning the markets were yawning, it seems, as stocks and gold traded on either side of unchanged but bond yields rose as expectations of a Fed rate hike remained firmly in place. But, as the day wore on, stock prices faded and gold prices bounced back. As to the rate hikes, well, it is still at least three rate hikes and some say four. The first one is expected in March. Rising bond yields could still sink the market as the 10-year broke out to new highs.
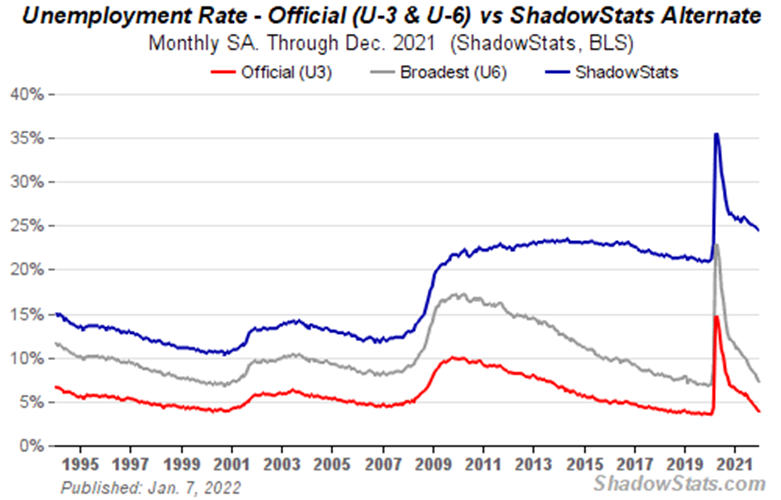
But what about other numbers? The U3 unemployment rate fell and so did the U6 unemployment rate (U3 plus short-term discouraged and other marginally attached persons plus those working part-time who want full-time) as it dropped to 7.3% from 7.7%. The Shadow Stats (www.shadowstats.com) number which is U6 plus long-term discouraged workers and those defined out of the work force in 1994 also slipped to 24.5% from 24.7%. Despite a gain of 199,000 nonfarm, employment levels as we noted earlier remain 3,572 thousand jobs short of where they were in February 2020. The civilian labour force level rose to 162,594 thousand vs. 162,126 thousand in November but it was again, as we noted earlier, 164,583 thousand in February 2020.
Surprisingly, quits in the market keep rising. Some 4.5 million workers quit or changed jobs in November, the highest ever recorded. The reality is poor wages, fear of COVID, having to quit work to take care of kids at home from school or be a caregiver to those infected by COVID are all part of the reasons so many quit or have dropped out of the labour force. Also, a large number of older workers just packed it in and won’t be returning to the work force as they are retired. The quits only make up about 3% of the workforce.
Helping the quits, we suspect, was that there were 10.6 million job openings reported for November. That’s down from the October peak of 11.1 million. Officially, there are 6.8 million unemployed (U3) but a more realistic number is 11.8 million (U6). However, if one uses the Shadow Stats rate, the number unemployed jumps to 39.4 million. Those reported to be not in labour force was 99.8 million in December down only slightly from November’s 99.9 million. Some 56.1 million are retired and another 9.2 million are disabled. Another large group is full-time students.
Those working full-time rose to 130,191 thousand from 129,388 thousand but part-time workers fell to 25,681 thousand from 25,956 thousand. Job losses were heavily in those sectors such as leisure and hospitality that employ part-time workers.
We should also note that all of the data for these reports is closed off by mid-month so it does not reflect the recent sharp rise in Omicron-related closings and cancellations. That will impact the January report due out the first Friday in February.
While, no doubt, the actual nonfarm payroll number disappointed, the official unemployment rate at 3.9% is not far from the 3.5% recorded in February 2020. As well, with wage growth jumping (now 6% annualized over past six months), the suggestion is that the labour market is tight. And tight labour markets, along with rising inflation, has the Fed feeling it can act on interest rates. No wonder the 10-year jumped.
Canada Job Numbers
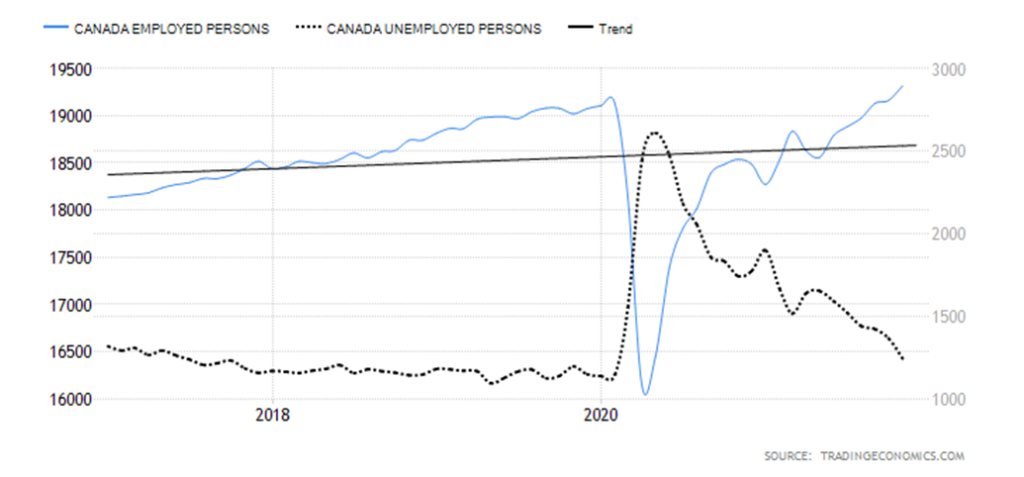
It is only logical that as the number of employed persons rises the number of unemployed persons falls. December was true to form for Canada as the amazing job creation growth continued. Canada reported that there were 54,700 jobs created in December while the unemployment rate slipped to 5.9% from 6.0%. That’s not far from the 5.7% rate seen in February 2020. The 54,700 jobs created was more than double the 25,000 that were expected. Full-time jobs leaped 122,500 as part-time jobs fell 67,700. Canada has now well surpassed the February levels currently sitting at 240,500 jobs above the levels of February 2020. Canada created 886 thousand new jobs in 2021, a record. The R8 unemployment number which includes discouraged workers, workers waiting to be called back, and involuntary part-time workers was unchanged at 7.6%. That rate is better than the 8.6% recorded in February 2020. Celebrations all around. Okay, the 10-year bond rose to 1.73% and the expectations of an interest rate hike from the Bank of Canada are rising. Could, however, they hike sooner than expected?
As with the U.S., these numbers do not include the recent shutdowns due to the sharp rise in Omicron. February’s report may not be as rosy. The participation rate was essentially unchanged at 65.3%. But in a surprise the year-over-year gain for hourly wages was only 2.7% vs. an expected gain of 3.1%. In October the year-over-year gain was 2%. Arguably, one could say this is a government job creation machine as the number of people employed in the public sector rose 31,600 in December. Public sector employees are now 307 thousand above pre-pandemic levels. Public sector includes health care workers and teachers.
Another indication of strong job creation was the fact that the labour force increased by only 23,000 last month. That helped push the unemployment rate down. A big chunk of the gain in employment was in Ontario
where 47,000 jobs were created. Employment in B.C. was fairly steady despite the massive flooding the province saw.
Overall, this was a great report, adding to the previous month’s great report. But a reminder, it does not reflect the impact of closings due to the latest round of COVID.
MARKETS AND TRENDS
| % Gains (Losses) Trends | ||||||||
| Close Dec 31/21 | Close Jan 7/22 | Week | YTD | Daily (Short Term) | Weekly (Intermediate) | Monthly (Long Term) | ||
| Stock Market Indices | ||||||||
| S&P 500 | 4,766.18 | 4,677.03 (new highs) | (1.9)% | (1.9)% | neutral | up | up | |
| Dow Jones Industrials | 36,333.30 | 36,231.66 (new highs) | (0.3)% | (0.3)% | up | up | up | |
| Dow Jones Transports | 16,478.26 | 16,268.77 | (1.3)% | (1.3)% | neutral | up | up | |
| NASDAQ | 15,644.97 | 14,935.90 | (4.5)% | (4.5)% | down | up | up | |
| S&P/TSX Composite | 21,222.84 | 21,084.45 | (0.7)% | (0.7)% | neutral | up | up | |
| S&P/TSX Venture (CDNX) | 939.18 | 911.46 | (3.0)% | (3.0)% | down | down | up | |
| S&P 600 | 1,401.71 | 1,384.44 | (1.2)% | (1.2)% | neutral | up | up | |
| MSCI World Index | 2,354.17 | 2,342.27 | (0.5)% | (0.5)% | neutral | up (weak) | up | |
| NYSE Bitcoin Index | 47,907.71 | 41,344.18 | (13.7)% | (13.7)% | down | down (weak) | up | |
| Gold Mining Stock Indices | ||||||||
| Gold Bugs Index (HUI) | 258.87 | 243.35 | (6.0)% | (6.0)% | down | down | neutral | |
| TSX Gold Index (TGD) | 292.16 | 273.86 | (6.3)% | (6.3)% | down | down | neutral | |
| Fixed Income Yields/Spreads | ||||||||
| U.S. 10-Year Treasury Bond yield | 1.52% | 1.76% (new highs) | 15.8% | 15.8% | ||||
| Cdn. 10-Year Bond CGB yield | 1.43% | 1.73% | 21.0% | 21.0% | ||||
| Recession Watch Spreads | ||||||||
| U.S. 2-year 10-year Treasury spread | 0.79% | 0.90% | 13.9% | 13.9% | ||||
| Cdn 2-year 10-year CGB spread | 0.48% | 0.66% | 37.5% | 37.5% | ||||
| Currencies | ||||||||
| US$ Index | 95.59 | 95.72 | (0.3)% | (0.3)% | down | up | up (weak) | |
| Canadian $ | .7905 | 0.7914 | 0.11% | 0.11% | up | down | up (weak) | |
| Euro | 113.74 | 113.58 | (0.1)% | (0.1)% | up | down | down (weak) | |
| Swiss Franc | 109.77 | 108.88 | (0.8)% | (0.8)% | up (weak) | neutral | up | |
| British Pound | 135.45 | 135.95 | 0.4% | 0.4% | up | down | up (weak) | |
| Japanese Yen | 86.85 | 86.52 | (0.4)% | (0.4)% | down | down | down | |
| Precious Metals | ||||||||
| Gold | 1,828.60 | 1,797.40 | (1.7)% | (1.7)% | down (weak) | neutral | up | |
| Silver | 23.35 | 22.40 | (4.1)% | (4.1)% | down | down | up (weak) | |
| Platinum | 966.20 | 956.50 | (1.0)% | (1.0)% | down (weak) | down | neutral | |
| Base Metals | ||||||||
| Palladium | 1,912.10 | 1,921.60 | 0.5% | 0.5% | neutral | down | neutral | |
| Copper | 4.46 | 4.41 | (1.2)% | (1.2)% | up (weak) | neutral | up | |
| Energy | ||||||||
| WTI Oil | 75.21 | 78.90 | 4.9% | 4.9% | up | neutral | up | |
| Natural Gas | 3.73 | 3.92 | 5.1% | 5.1% | down (weak) | neutral | up | |
New highs/lows refer to new 52-week highs/lows and, in some cases, all-time highs.
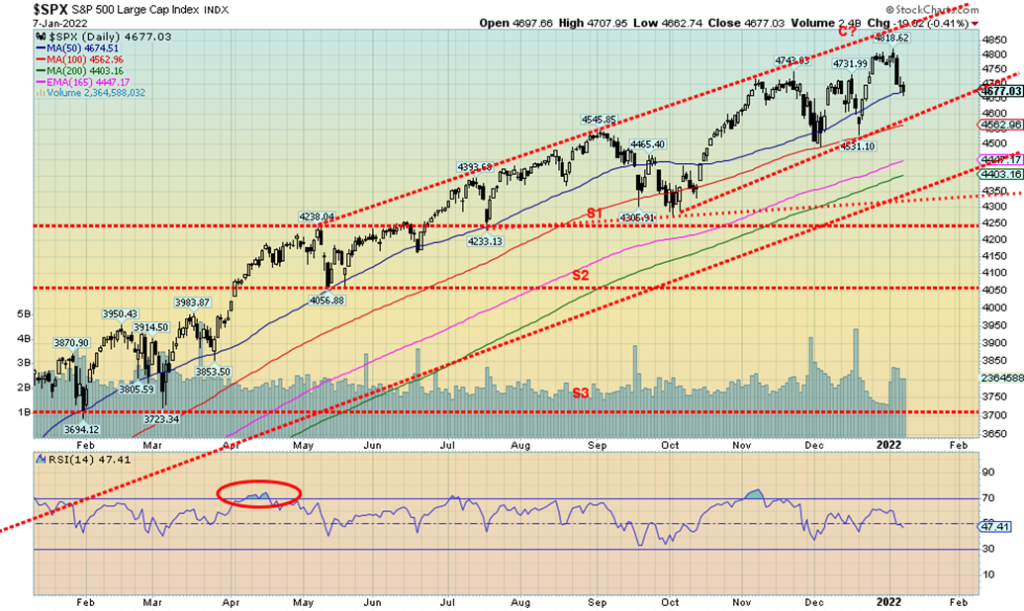
Is the bull market over? We alluded to that in our main essay, comparing it with the “Nifty Fifty” rally of 1972 that topped in early January 1973. Instead, this has been the FAANGs rally and the top may have been made on January 4, 2022 at 4,818.62. That was an all-time high. Then the S&P 500 reversed course and put in an outside reversal week to the downside. That’s a potential key reversal week and it is bearish. It is noteworthy that the Dow Jones Industrials (DJI) also made new all-time highs this past week, then reversed and closed lower. However, unlike the S&P 500 the DJI did not put in a key reversal week as the low and close of the week was above the low of the previous week. Others making fresh all-time highs this past week were the S&P 100 (OEX), and the Russell 1000 and 3000. All closed lower on the week.
On the week the S&P 500 fell 1.9%, the DJI dropped 0.3%, the Dow Jones Transportations (DJT) continued to diverge from the DJI, coming nowhere near its former highs and losing 1.3% on the week. The NASDAQ was the biggest loser, down 4.5%. The S&P 500 Equal Weight Index lost 0.6%, suggesting that the heavyweights in tech weighed down the S&P 500. Small caps were hit as well as the S&P 600 lost 1.2% but notably outperformed the S&P 500. In Canada, the TSX Composite fell 0.7% and the TSX Venture Exchange (CDNX) lost 3.0%.
Overseas in the EU the markets rose instead with the London FTSE up 1.4%, the Paris CAC 40 up 0.9% and the German DAX up 0.4%. Asia wasn’t so lucky with China’s Shanghai Index (SSEC) down 1.7% and the Tokyo Nikkei Dow (TKN) off 1.1%. The MSCI World Index lost 0.5%. Finally, Bitcoin and the cryptos fell hard, with Bitcoin down 13.7%.
It was not a good start to the year. The first five days January barometer is giving a sell signal—or is it more properly a stand aside signal? Take profits, cut losses, raise stops? The last daily low was 4,531 so if that breaks it suggests we are going lower. Support would be down to 4,400. The last weekly low is also 4,531 with a more important one at 4,495. The last monthly low was 4,495 so that number is important. A break of that level could suggest a further fall to 4,300/4,400. Currently, we are 2.9% off the top. A bear market officially starts under 3,850. Only regaining back above 4,800 could turn this market back up and see new highs.
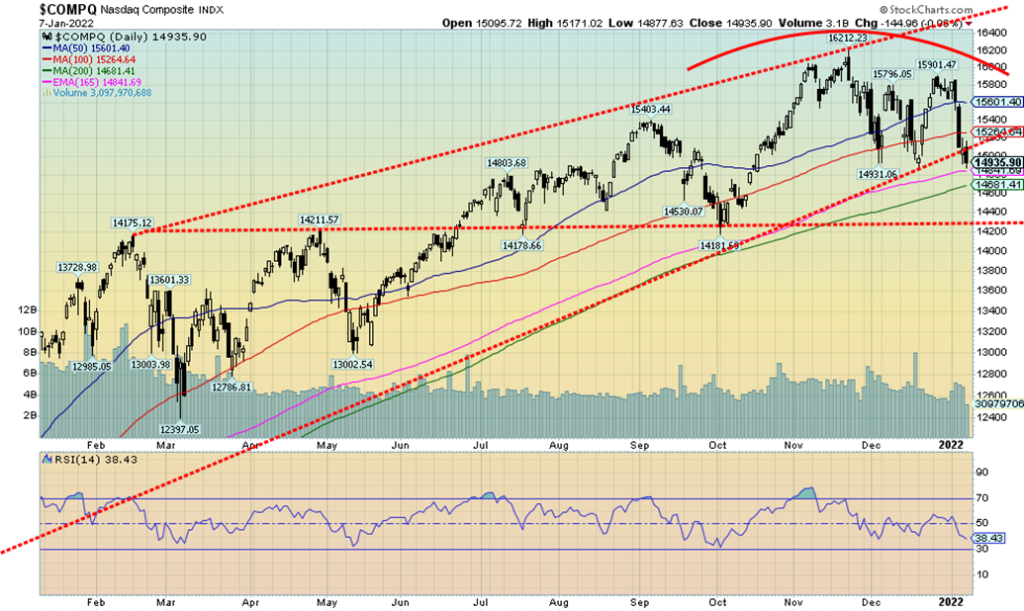
Goodbye NASDAQ? The tech-dominated NASDAQ took it on the chin this past week, falling 4.5%, the worst of the major indices. The FAANGs that led the way up appear to be now leading on the way down. Meta (Facebook) fell 1.4%, Apple -3.0%, Amazon -2.5%, Netflix -10.2% (ouch), Google -5.3%, Microsoft -6.6%, Tesla -2.8%, Twitter -8.2%, and Nvidia -7.4%. The surprises were the Chinese companies Baidu and Alibaba that rose 3.1% and 9.3% respectively. So, it was a week that saw tech down but value up. Oh yes, Berkshire Hathaway rose 6.6% on the week to new all-time highs. Buffett beats Bezos, Musk, and Zuckerberg. The chart of the NASDAQ does not look particularly rosy. The NASDAQ appears to be breaking its uptrend line from the March
2020 low. If that’s correct, then a fall to 14,300 could be next. That’s only 12% down from the all-time highs. So that would not be a killer. The killer would come if we broke down under 14,200 as the next stop could be sharply lower. We have on the NASDAQ what looks like a failed high and a failed breakout. If Friday’s breakdown is correct, the NASDAQ could fall further this coming week. Interim support is between 14,600–14,700. Targets could be 13,600/13,700. Only regaining back above 15,600 might change this scenario. Really, we need to see the NASDAQ regain back above 15,900 to convince us we could be going higher.
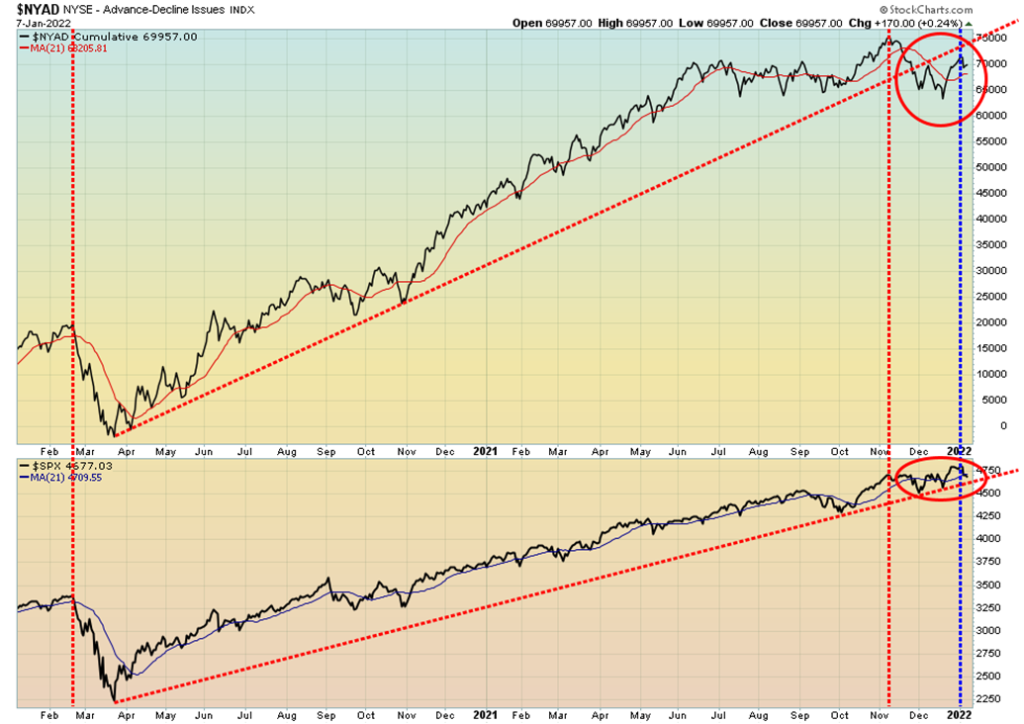
We won’t center on a lot of indicators but the NYSE advance-decline is worth noting. That the AD line is falling is no surprise. And it is probably no surprise that the AD line diverged with the S&P 500 at the recent highs. The S&P 500 was making a higher high while the AD line made a lower high—a divergence. The AD line has already broken its uptrend line from the March 2020 low while the S&P 500 could be on the cusp of breaking its uptrend line. Divergences abound with falling participation in the market and rising volatility. It’s a warning sign and doesn’t tell us when we will fall, only that we should fall—and soon. We may already be underway.
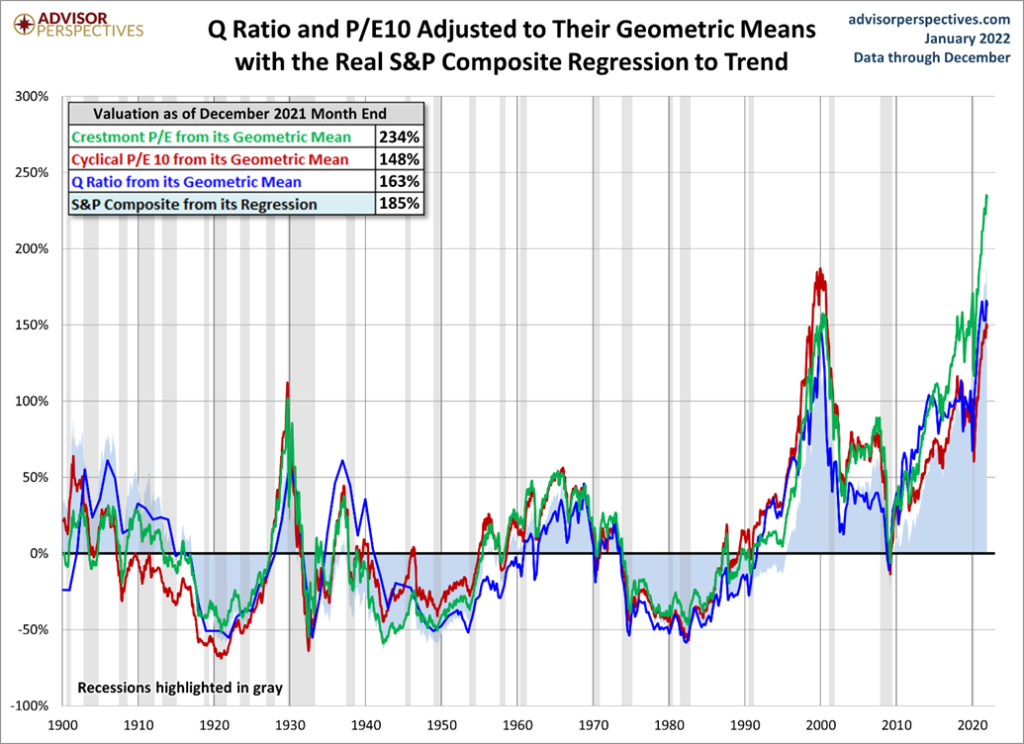
Above are the market valuation indicators from Advisor Perspectives (www.advisorperspectives.com). The four valuation indicators are: 1. The Crestmont Research PE Ratio, 2. The cyclical PE ratio using a trailing 10-year earnings as a divisor, 3. The Q Ratio, which is the total price of the market divided by its replacement cost, and 4. The relationship of the S&P Composite price to a regression trendline. Yes, it is all a bit mathematical.
We won’t go into all the other mathematical machinations that AP does. What we do note is that the four have shot ever higher into record territory, taking out the 1929 highs, the 1966 highs, and the 2000 highs. In other words, it is already in nosebleed territory and is moving into head-bursting territory. So, can the market keep going up? Yes. But will it? That is the question. The markets faltered this past week. The signal was a sell signal for 2022. The above chart is a regression to its geometric mean but the picture looks the same using a regression to its arithmetic mean. Quite simply, no matter how one looks at it we are seriously in overvalued territory. History suggests that when the collapse comes, it will be swift.
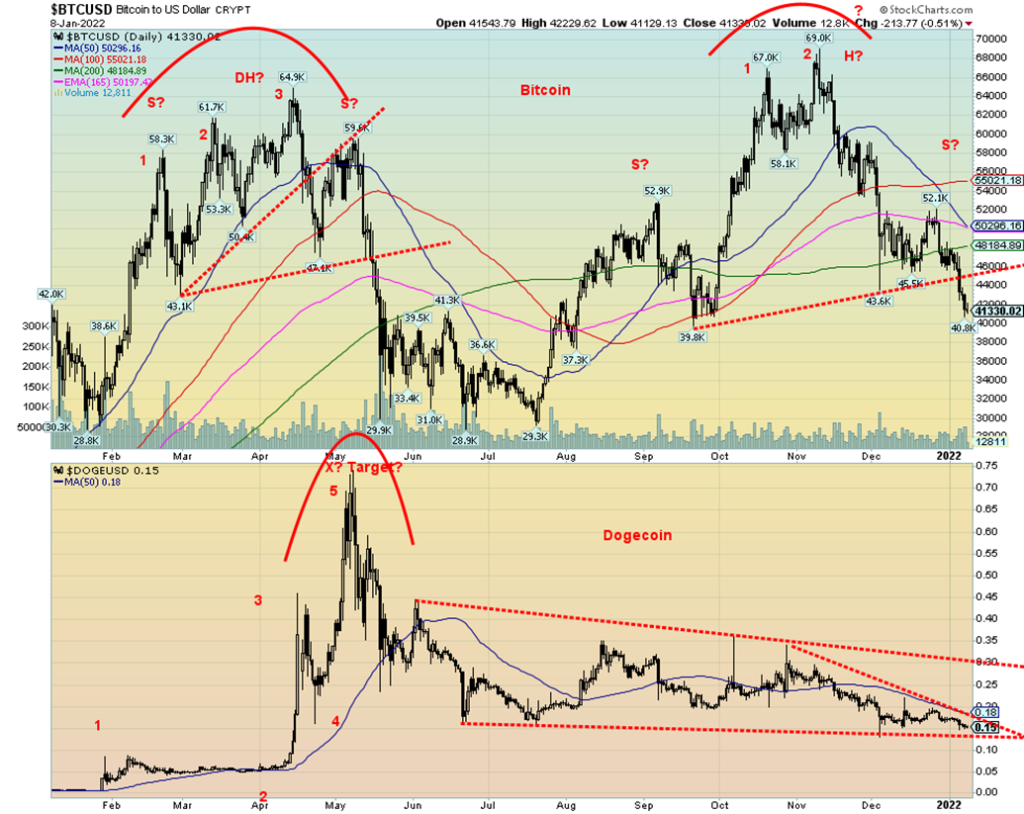
Is Bitcoin poised to take a big tumble? Bitcoin appears to be making a potential head and shoulders top pattern. If so, we have already broken the neckline of the pattern and could now be projecting down to 15,800 with minimum objectives down to 38,100. Dogecoin, the admitted joke of a crypto with a market cap of $20.2 billion appears to be forming a descending triangle. A breakdown under $0.1475 could project down to $0.08. Other cryptos are showing similar patterns. Maybe the cryptos are getting thrown out also due to inflation fears or maybe everyone is realizing they may never go anywhere with widespread usage. Amazingly though, that didn’t stop the market cap of the crypto market from rising to over $2 trillion and Bitcoin over $1 trillion at one point (only $780 billion today).
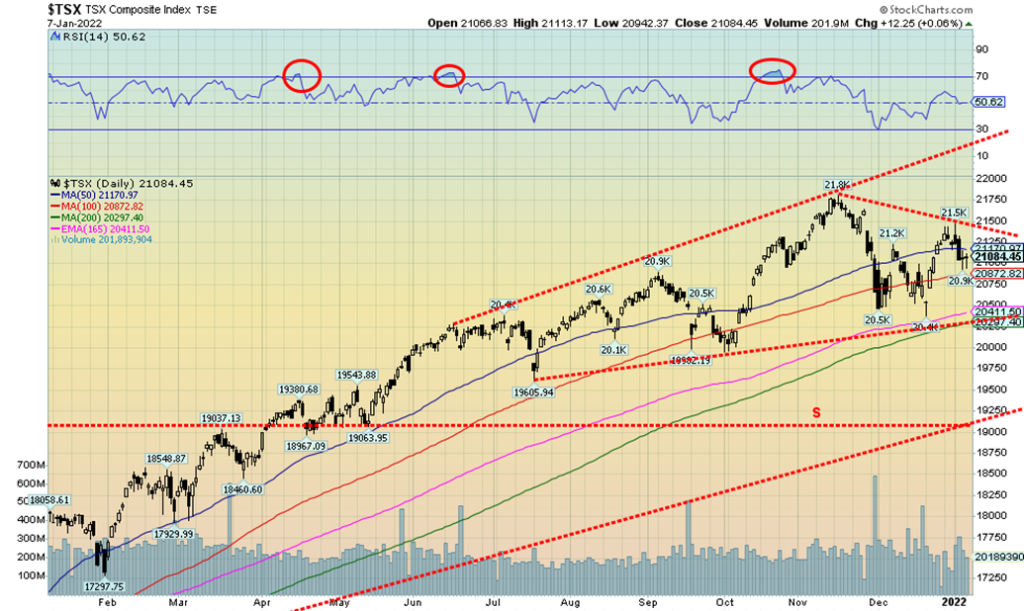
The TSX Composite joined everyone to the downside this past week, although on the whole the TSX outperformed the U.S. indices. The TSX fell 0.7% this past week. The small cap TSX Venture Exchange (CDNX) dropped 3.0%. The TSX Composite was buoyed by the strong performance of the TSX Energy Index (TEN) and the TSX Financials Index (TFS). Both hit new 52-week highs this past week and both held on to their gains. The TEN was up 8.3% and was the clear star on the week for the TSX while the TFS gained 2.8%. Despite the strong performance of these two indices, only two other indices finished in the green. Telecommunications (TTS) gained 0.3% while Metals & Mining (TGM) was up 0.4%. Leading the downside parade was Information Technology (TKK), down 9.3%. Golds (TGD) were off 6.3%. Materials (TMT) -5.0% and Real Estate (TRE) -3.5% were other significant losers. The TSX has put in what appears to be failed attempt at the highs. These swing patterns could project down to 19,000–19,300 if we break back under the recent low at 20,382. We note key support down to 20,250. New highs above 21,500 would end any discussion of a drop and then new highs could be possible. But failed highs usually signal that a more significant drop could lie ahead.
U.S. 10-year Treasury Bond/Canadian 10-year Government Bond (CGB)
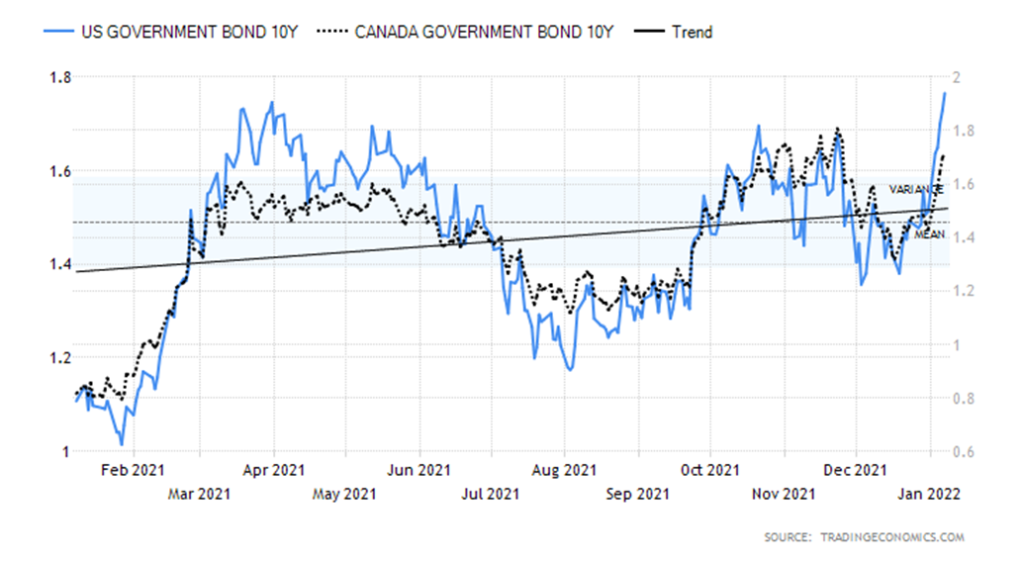
The U.S. 10-year treasury note broke out this past week over its earlier highs of 1.74%, hitting as high as 1.77% before closing at 1.76%. The Canadian 10-year bond followed the U.S. to the upside but at 1.73% remains short of its earlier high at 1.80%. As we noted in our main essay, the pattern for the U.S. 10-year now suggests a potential move to 2.25%. The catalyst is rising inflation, coupled with some signs the U.S. economy is still growing. The unknown now is the sharply rising Omicron variant where the U.S. is recording staggering daily numbers, often setting a new record every day. The 7-day average is now an astounding 650 thousand. At that rate, the U.S. will hit a 100 million cases in two months. Deaths are slower and could take upwards of three months to hit one million dead. The U.S.’s COVID numbers represent 20% of all cases and 15% of all global officially recorded deaths. The U.S. has less than 5% of the world’s population. The U.S. job numbers didn’t help push rates down on Friday as the bond market recognized wage growth and the falling unemployment rate more than the miss on nonfarm payrolls. The fall to 3.9% unemployment which is not far off the 3.5% unemployment seen before the start of the pandemic helped sustain thoughts that the Fed will hike interest rates faster. But we have noted that the Fed is trapped. Raising rates too fast and too high could tip the stock and housing market over. A 20% decline in the stock market would catch the Fed’s attention. Other economic numbers were mixed this week. The JOLTS job numbers surprised sharply on the upside. But the ISM Manufacturing prices index at 68.2 for December was a big miss from the expected 82. The $80.2 billion trade deficit for November is also a negative as a higher trade deficit suggests the potential for a slowing economy. Factory orders for November also rose more than expected, up 1.6% vs. an expectation of a rise of 1.3%. However, the focus is on inflation and the potential for interest rate hikes. And that has the 10-year rising.
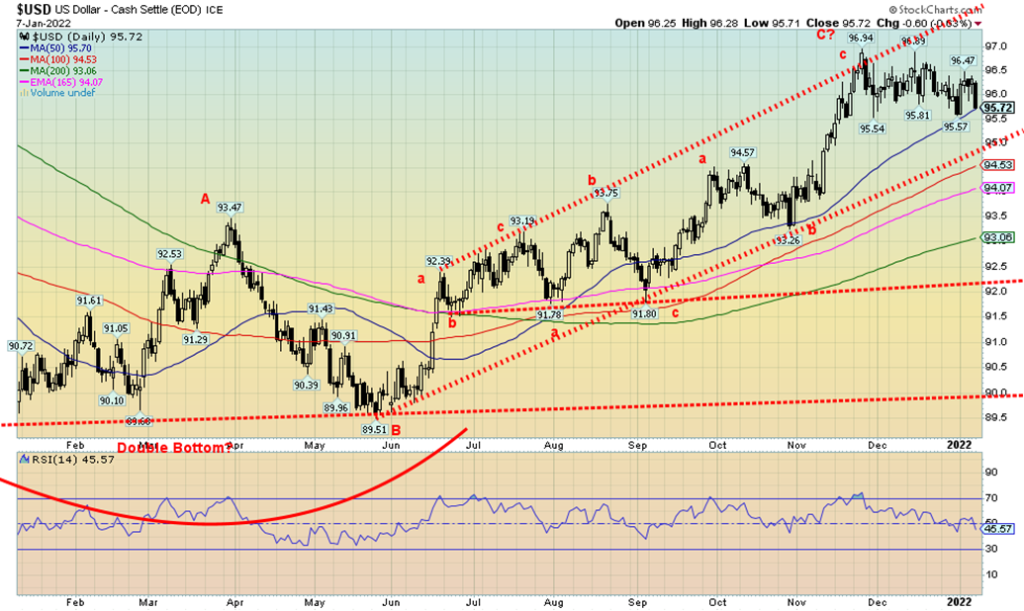
If gold is to go higher, then the US$ Index needs to go lower. The US$ Index fell 0.6% on Friday following release of the December job numbers that were weaker than expected. Surprisingly, the US$ Index did not respond to the falling unemployment rate or the rising wage levels. Friday’s fall reversed what would have been a slight up week. In the end the US$ Index closed down 0.3%. Oddly, the euro fell as well, down 0.1%, the Swiss franc was down 0.8%, the Japanese yen was hit, down 0.4%, but the beleaguered U.K. saw the pound sterling rise 0.4%. The Canadian dollar rose 0.1% on the week thanks to higher oil prices. The US$ Index has started what appears to be a small downtrend. A break under 95.50 would suggest further declines to significant support at 95. Under 95 the dollar decline could accelerate with significant support down at 93 and 92. Under 92 things could open up further and the declines could be sharper. The last high was seen at 96.94 in what appears as a channel overthrow. That was seen in November. Since then, the US$ Index has been is a slow back and forth decline. We can’t help but note that the commercial COT for the euro is the most bullish we’ve seen in two years. But that doesn’t necessarily rule out a thrust once again to new highs for the US$ Index and a thrust once again to new lows for the euro. Ideally, only one of them makes a new high or a new low, thus setting up potential divergences. Friday’s reversal to the downside is bearish, but we need to see follow-through this coming week. A break of 95.50 would go a long way to resolving the next move. To the upside, a break above 96.50 would suggest that new highs are possible.
It was not a very good week for the precious metals. Gold fell 1.7%, silver was whacked, down 4.1%, and platinum was off 1.0%. The near precious metals were mixed as palladium actually rose 0.5% but copper fell 1.2%. The gold stock indices were taken down with the Gold Bugs Index (HUI) off 6.0% and the TSX Gold Index (TGD) dropping 6.3%. The catalyst for the drop was the FOMC minutes, which indicated that the Fed continued to signal interest rate hikes. As well the 10-year rose to new highs. This spooked gold as gold is sensitive to rising interest rates which increases the costs of holding non-yielding bullion. Gold did respond positively to the weaker than expected job numbers on Friday and put in what might be an upside reversal day. Follow-through on this coming week will be very important. As we have noted, the job numbers were mixed with lower-than-expected nonfarm payroll jobs. However, the unemployment rate fell to its lowest level since February 2020 and wages jumped sharply, adding to inflation fears and the Fed hiking interest rates.
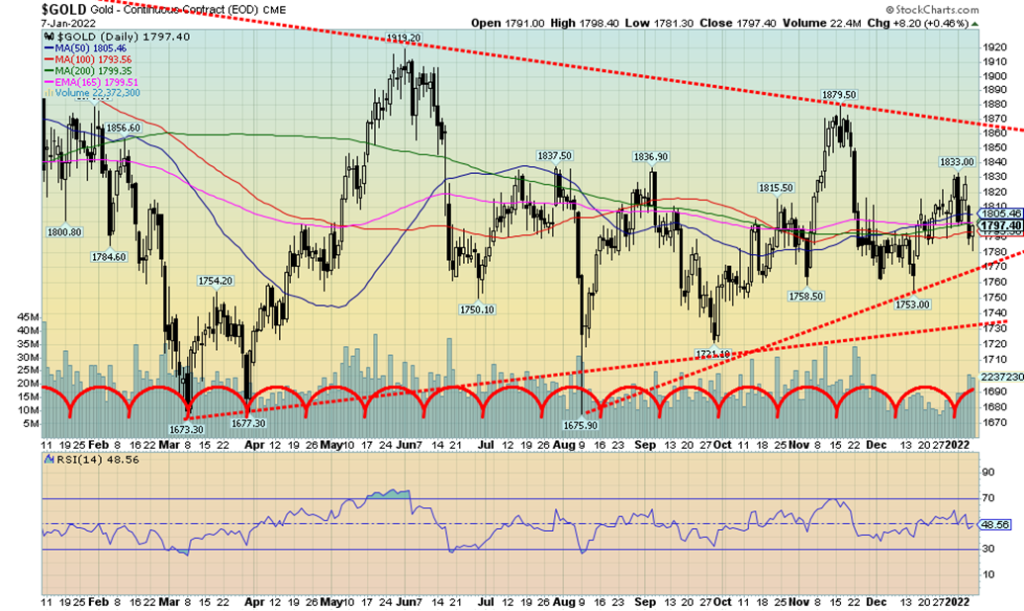
Gold is forming a very ambiguous pattern that on one hand could be a bottom pattern and on the other hand could be a topping pattern. Unfortunately, we will have to await firm breaks. To the downside, gold could be forming what appears to us as a very awkward-looking head and shoulders top. We don’t believe it’s real, but it does need to be noted. A solid breakdown under $1,750 and especially under $1,675 could, in theory, project gold to fall to $1,550. While it is still early, we have noted we are eventually looking for our 7.83-year cycle low and our 23.5-year cycle low. Neither are expected until at least 2023/2024 but we are in the early stages for it. We continue to believe we are still coming out of the 31-month cycle low that made a potential double bottom near $1,675 in March and August. That’s why this rally is so important. And, yes, gold remains
in an uptrend for the moment at least. But it’s tenuous, especially if we break under $1,770 and $1,750. This rally, which we still expect, could be a failure rally that fails to see new highs above the August 2020 high of $2,089 or it could be more like a runaway move to new highs and targets up to $2,300 to $2,400. Many gold analysts are predicting the latter, but we warn it could be the former. Gold still needs to break over $1,820 to suggest a move to $1,850/$1860 resistance. Once over that level things are looking up, but then breaking over $1,900 will become the next important point. Ultimately, gold needs to break out over $2,000 to begin to suggest new highs ahead.
We are at a difficult point here. With the Fed shifting to fighting inflation rather than keeping the party going with QE and zero percent interest rates forever, it does raise the risks for gold. Gold does not appear to be responding to the current geopolitical tensions or to the ongoing January 6 investigation, but that could change. Gold did respond somewhat positively to the lower-than-expected job numbers, but that was tempered by falling unemployment rate and rising wages. Gold was the one area that was positive on Friday as eventually the stock markets succumbed to selling while both gold, silver, and the gold stocks finished mildly in the green. But if the stock market would turn sharply to the downside, then gold and precious metals could follow because then it becomes a liquidity event and positive fundamentals for gold are thrown out the window as everything gets sold. Follow-through to the upside this coming week will be helpful for our more bullish scenario, but we really need to clear above $1,820 to begin to suggest that a low is in. So far, we have done nothing but fail the level.
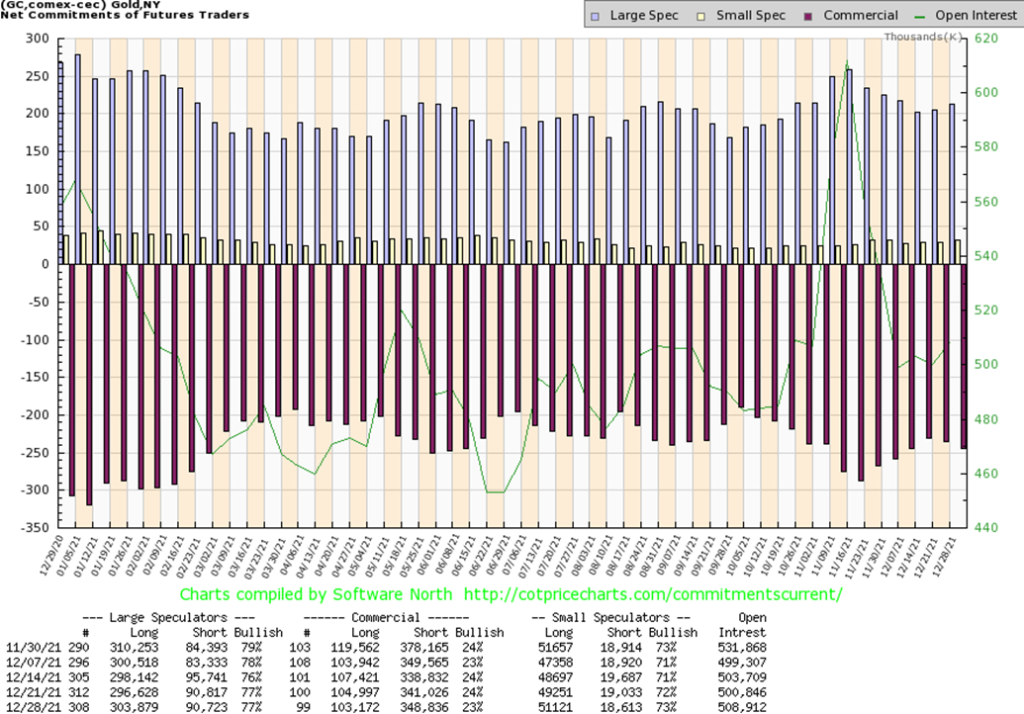
The gold commercial COT (bullion companies and banks) fell this past week to 23% from 24%. It was a disappointing COT report. Long open interest fell almost 2,000 contracts while short open interest rose almost 9,000 contracts. The large speculators COT (hedge funds, managed futures, etc.) was unchanged at 77% while overall open interest rose roughly 8,000 contracts during a down week. This may be a temporary position as the report does not capture the action seen at the end of the week when gold prices fell. Next week’s report could be more telling.
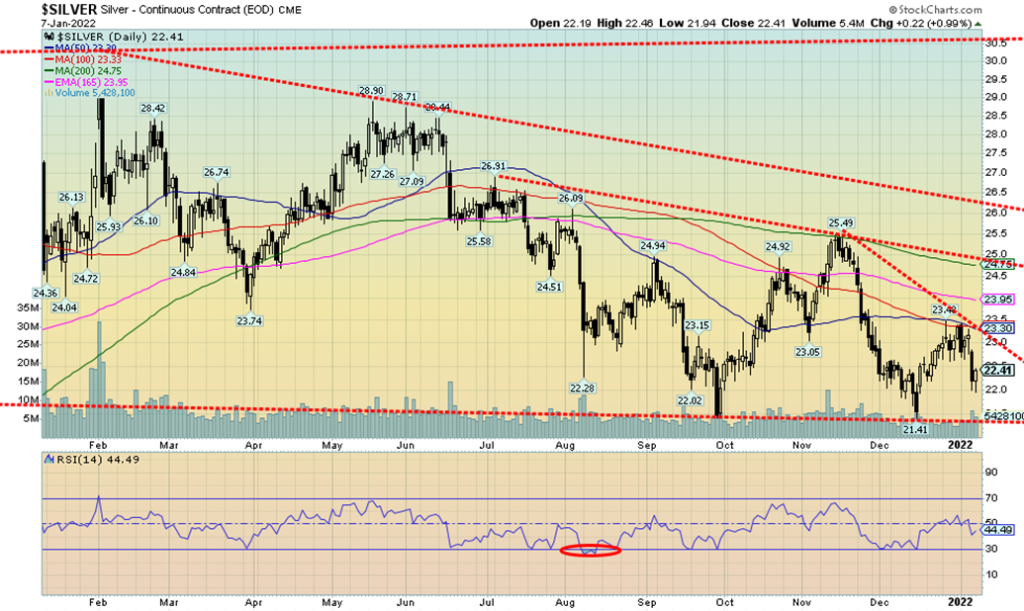
Silver did not have a good week, falling 4.1%. Most of the damage was done on Thursday following the release of the FOMC minutes that suggested faster interest rate hikes. Friday’s weaker than expected job numbers helped silver rebound, closing up roughly 1% on the day. If Friday’s low of $21.94 holds going forward there is a chance for silver to regain back above $23 resistance. Verification of a low would come, however, only on a close over $24. Further resistance is seen up to $25 but over $25 things are looking up for silver. The next line would be at $26 and above there an assault on the February high of $30.35 could unfold. In the interim, the risk is to the downside. We have what appears as a double bottom at $21.41 seen in late September and again in mid-December. Triple bottoms are, however, rare and if silver were to break under $22 again then the odds would begin to favour a further breakdown under the recent $21.41 low. Targets could then be down to $17.25. That’s not to set off alarm bells but act as a warning if things become unglued for the precious metals. Friday’s upside reversal is, however, encouraging but we need follow-through this coming week. There is considerable ambiguity in the silver pattern that makes forecasting the next move difficult. That’s why we warn of the potential downside risks. Elliott Wave International has noted the same thing. New lows under $21.41 could draw silver prices sharply lower. A firm break over $23 and especially over $23.30 would start to end any thoughts of a breakdown.
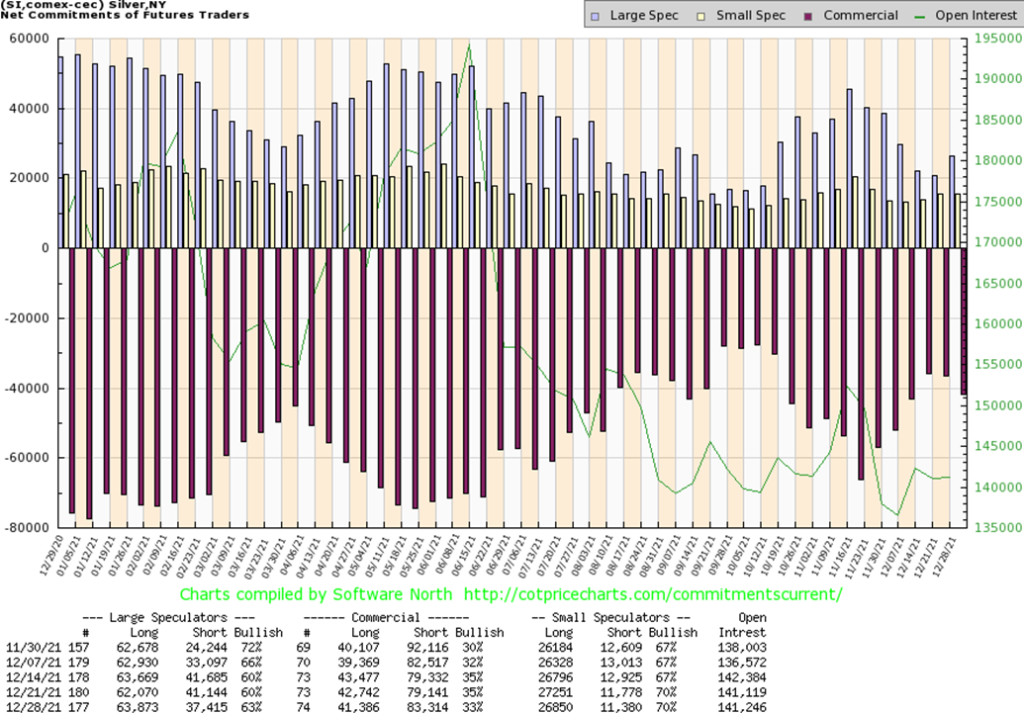
As with the gold commercial COT, the silver commercial COT slipped this past week to 33% from 35%. Long open interest was down over 1,000 contracts while short open interest rose just over 4,000 contracts. These numbers do not reflect the action seen at the end of the week when both gold and silver fell harder. Not surprisingly, the large speculators COT rose to 63% from 60% as the large speculators primarily slashed their short positions. Except they are now caught with the market falling rather than rising. Overall open interest was flat on the week which is somewhat positive, considering the drop silver experienced.
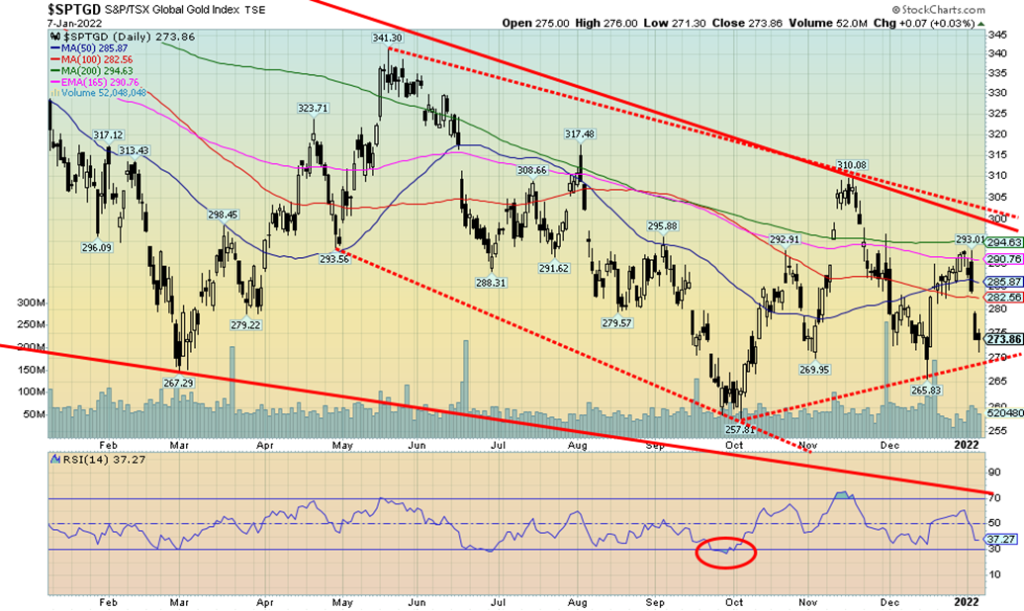
It was a most unpleasant week for the gold stocks. The TSX Gold Index (TGD) fell 6.3% this past week while the Gold Bugs Index (HUI) dropped 6.0%. The TGD did gap down on Thursday but gaps of this nature are not unusual for the index. The HUI, on the other hand, did not show the same gap down. As a result, we do not read a lot into the gap and it is most likely what we call a common gap, not a breakaway gap or running/measuring gap. Continued breakdowns could change that scenario. The TGD has support down to 270, but below that it could retest the early October low near 258. The current pattern is rather ambiguous as we could interpret it as either a topping or a bottoming pattern. Arguably, we could say it has formed a potential head and shoulders. The neckline would be at 270 and a breakdown could project down to 215/220. At this point the risk is downside. To negate the somewhat bearish-looking pattern the TGD needs to regain above 293 the recent high seen at year-end. The gold stocks are negatively responding to the weakness in gold and silver as they react negatively to the potential for higher interest rates into 2022.
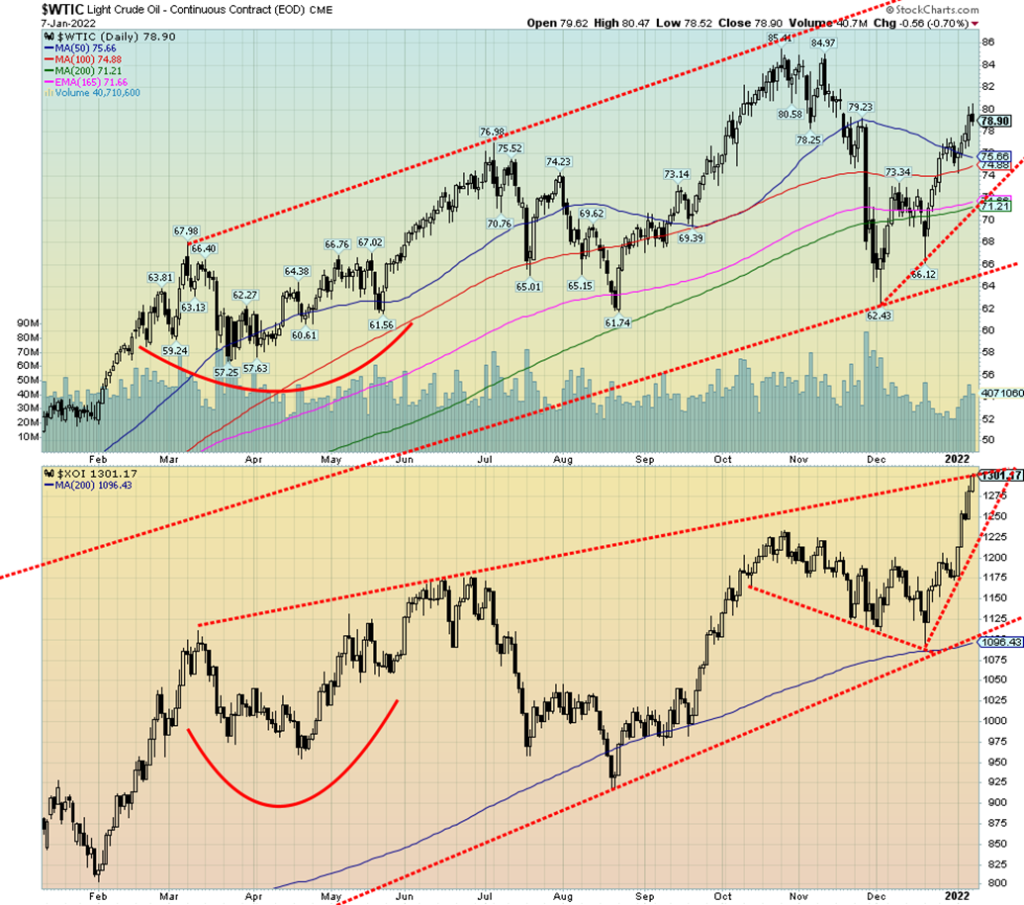
Oil prices are on the move once again. This past week both Brent and WTI oil pushed passed $80/b. WTI pulled back closing at $78.90 while Brent closed at $81.93. The catalysts? Geopolitical uncertainty sparked by the unrest in Kazakhstan. Oh yes, Kazakhstan, the ninth largest country in the world that many would have trouble identifying on a map. Kazakhstan is the world’s 17th largest oil producer and has the 12th highest reserves. Kazakhstan is also a major coal and natural gas producer. Add in the ongoing problems in Libya whose oil production has been cut by two-thirds, Russia’s stagnating crude production, and Iran still under sanctions and only able to export a small portion of its oil and you have supply constraints. Couple that with increased demand and you have rising oil prices. The demand, however, could be tempered by the rising wave of Omicron. The unrest in Kazakhstan was triggered by the government doubling the price of the already heavily subsidized price of motor fuel.
On the week WTI oil prices rose 4.9%. Natural gas (NG) didn’t sit still as NG rose 5.1%. That helped spark a rally in the energy stocks as both the ARCA Oil & Gas Index (XOI) and the TSX Energy Index (TEN) leaped to fresh 52-week highs. The XOI gained 10.4% and the TEN was up 8.3%. The gains in the energy stocks helped prevent the S&P 500 and the TSX Composite from falling more than they did.
As noted, Friday did see a pullback in WTI oil as it made new highs for this move and then closed lower. A pause might be in order. Support appears good back to $75/$76. Below that level, however, WTI could fall back towards $72 and stronger support. We note that the XOI has reached the top of a channel and that could be a constraint going forward. The XOI has long-term support back to 1,100 and good interim support near 1,200. The TEN has support back to 170 and below that to 155. Both indices could be forming rising or ascending wedge patterns which is bearish. However, that pattern is not seen on the chart of WTI oil. NG could be forming a bottom here but it is tenuous. A break of $3.50 would be quite negative; however, a break to the upside over $4.25 and especially over $4.75 would be quite positive. NG did achieve most of its double top targets with a low of $3.52 to date. Although we do note that the potential target zone was $3 to $3.25.
Easing of the tensions in Kazakhstan might help ease oil prices. With lockdowns becoming more frequent again, we might also see a drop in demand. Both would help push oil prices lower once again. A continued rise, however, that eventually sees new highs over $85.50 could target WTI oil up to as high as $108 with minimum objectives up to $91. Rising oil prices have been a significant contributor to inflation.
__
(Featured image by sergeitokmakov via Pixabay)
DISCLAIMER: This article was written by a third-party contributor and does not reflect the opinion of Born2Invest, its management, staff, or its associates. Please review our disclaimer for more information.
This article may include forward-looking statements. These forward-looking statements generally are identified by the words “believe,” “project,” “estimate,” “become,” “plan,” “will,” and similar expressions. These forward-looking statements involve known and unknown risks as well as uncertainties, including those discussed in the following cautionary statements and elsewhere in this article and on this site. Although the Company may believe that its expectations are based on reasonable assumptions, the actual results that the Company may achieve may differ materially from any forward-looking statements, which reflect the opinions of the management of the Company only as of the date hereof. Additionally, please make sure to read these important disclosures.
David Chapman is not a registered advisory service and is not an exempt market dealer (EMD) nor a licensed financial advisor. He does not and cannot give individualised market advice. David Chapman has worked in the financial industry for over 40 years including large financial corporations, banks, and investment dealers. The information in this newsletter is intended only for informational and educational purposes. It should not be construed as an offer, a solicitation of an offer or sale of any security. Every effort is made to provide accurate and complete information. However, we cannot guarantee that there will be no errors. We make no claims, promises or guarantees about the accuracy, completeness, or adequacy of the contents of this commentary and expressly disclaim liability for errors and omissions in the contents of this commentary. David Chapman will always use his best efforts to ensure the accuracy and timeliness of all information. The reader assumes all risk when trading in securities and David Chapman advises consulting a licensed professional financial advisor or portfolio manager such as Enriched Investing Incorporated before proceeding with any trade or idea presented in this newsletter. David Chapman may own shares in companies mentioned in this newsletter. Before making an investment, prospective investors should review each security’s offering documents which summarize the objectives, fees, expenses and associated risks. David Chapman shares his ideas and opinions for informational and educational purposes only and expects the reader to perform due diligence before considering a position in any security. That includes consulting with your own licensed professional financial advisor such as Enriched Investing Incorporated. Performance is not guaranteed, values change frequently, and past performance may not be repeated.


Bitcoin Stalls Near $60K as Strategy Moves, ETFs Outflow, and EU MiCA Rules Take Effect
Bitcoin hovers near $60,000 with ETF outflows, while Strategy boosts reserves, sells BTC, and raises dividends to reassure investors. Ethereum...


Cannabis Dominates Global Drug Use: Trends, Risks, and Shifting Markets
Cannabis remains the world’s most widely used illicit drug, with 256 million users in 2024, surpassing all others combined. Growth...


Italy Approves First Hydrogen-Powered Train for National Rail Network
ANSFISA has approved Italy’s first hydrogen-powered train, the Alstom HMU214, for use on the Brescia–Iseo–Edolo line. Capable of 140 km/h,...


Cotton Market Weakness Persists Despite Brief Rebound
Cotton prices fell to new lows last week before a modest rebound. USDA data shows crop conditions remain worse than...


Eli Lilly Hits $1 Trillion Valuation Amid Strong Bullish Momentum
Eli Lilly stock hit a record high, surpassing $1 trillion market value after strong product demand. Shares surged over 7%,...
 |
|
 |  |
 |
|
-

 Crowdfunding2 weeks ago
Wyrmgold Launches Crowdfunding Campaign for Believe in me! (please)
-
 Business2 days ago
Dow Jones Near Highs Signals Strength Until Volatility Returns
-
 Crypto1 week ago
XRP Under Pressure Amid Macro Forces, Fed Policy, and Regulatory Shifts
-

 Markets6 days ago
Commodity Markets Pause as Oil Falls, Metals Correct, and Grains Show Mixed Signals