Markets
Barbie and Spice and All Things Nice: The Goldilocks Economy Is Here
Despite Thursday’s reversal day, the markets continue to rise, hinting at a Goldilocks economy. That said, the inverted yield curve is a concern; a recession typically follows 6-12 months after. Interest rates are also rising, with 10-year yields poised to increase. This week, the focus lies on the release of July employment numbers for Canada and the U.S., as well as manufacturing PMIs.
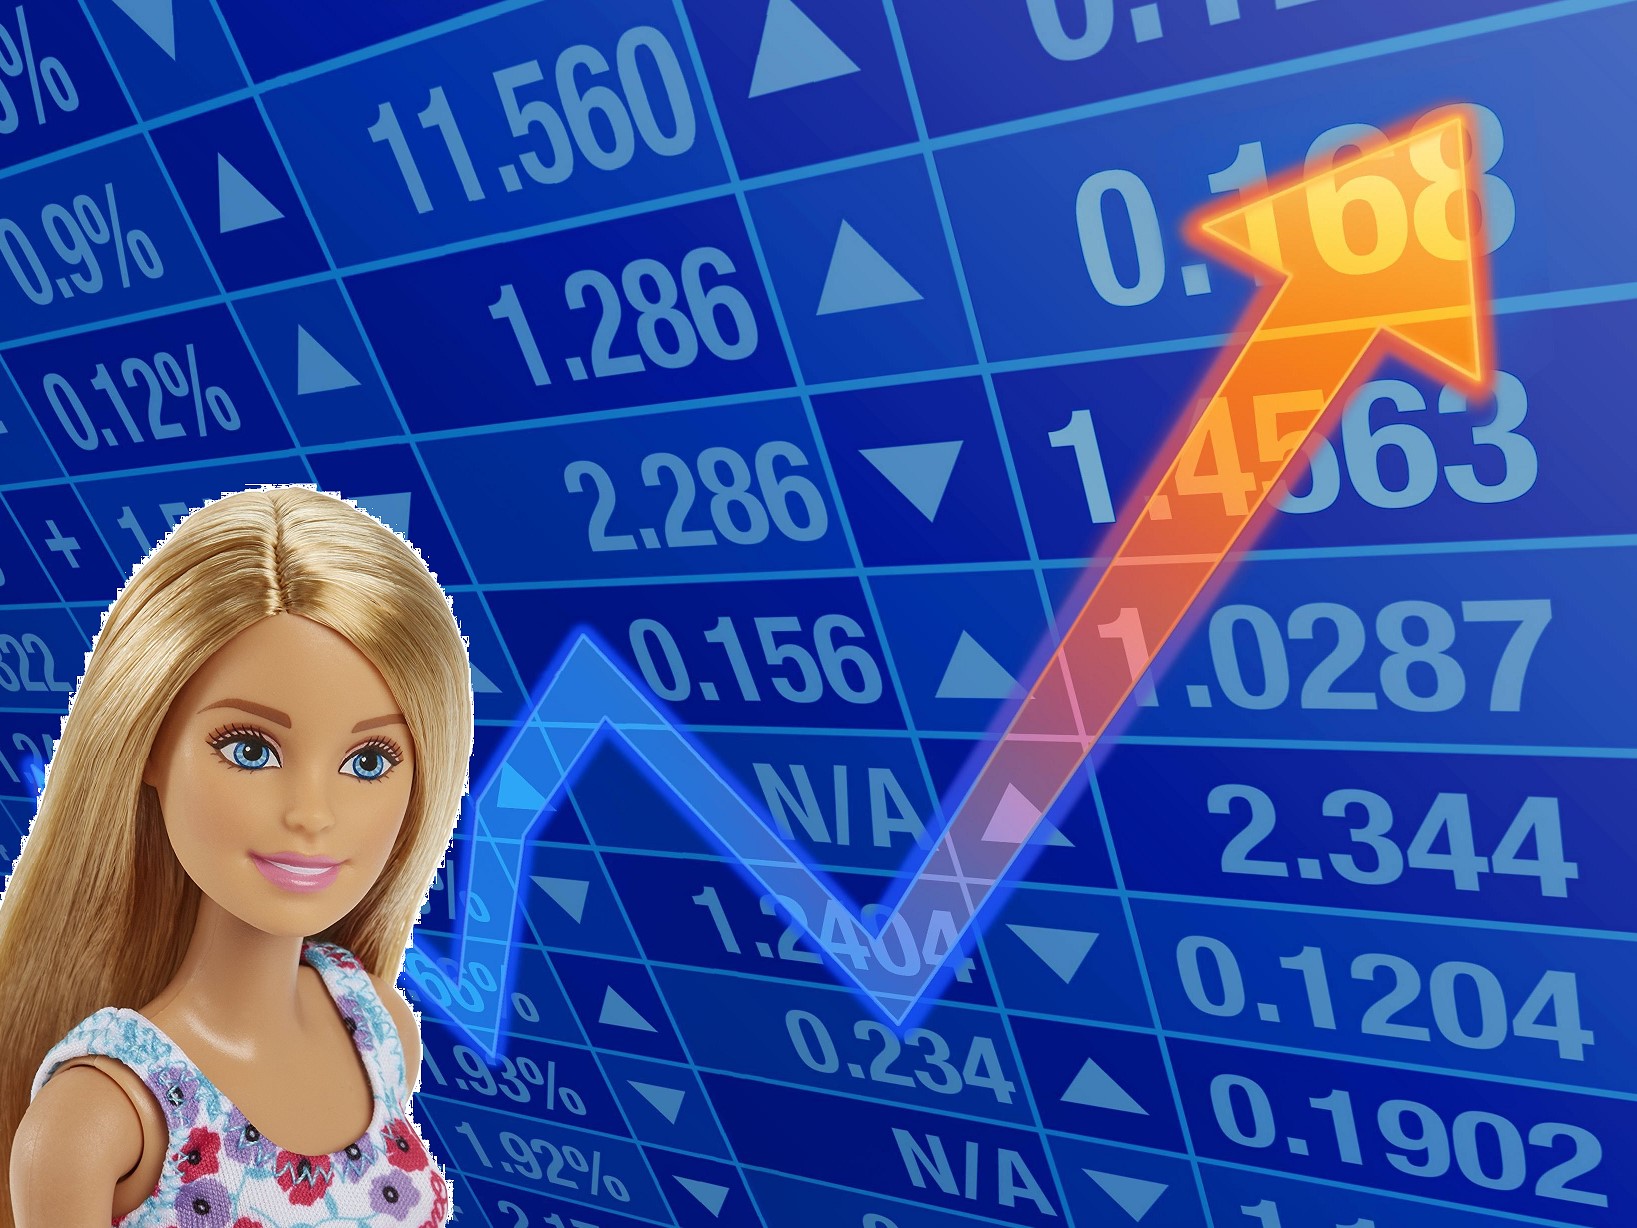
Move over Goldilocks. Barbie mania is here. It’s a Barbie world, or was it a Spice world? Somehow, calling the economy a Barbie economy doesn’t sound right. But maybe it is a Barbie economy and a Spice economy. Also, we could throw in a Swift economy as in Taylor Swift, who is Barbie and the Spice Girls all rolled into one. What do we do with the old Goldilocks economy?
Oh yes. The Goldilocks economy. Just what is that? Well, the definition of it is that it is an economy that is not expanding or contracting by too much. An economy that is not too hot, or too cold. It’s just right. And the numbers that are being reported are confirming that.
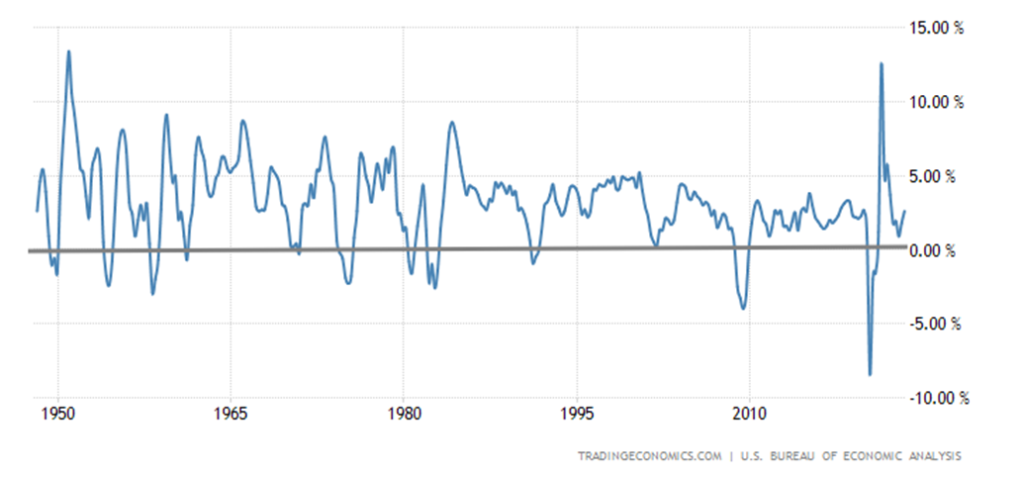
On the other hand, maybe we should say that the economy is sizzling. Okay, maybe that’s an exaggeration, but the U.S. Q2 GDP came in at 2.4% when the market had only expected 1.8% vs. the previous estimate of 2%. As well, durable goods orders came in at 4.7% for June, well above the forecast of 1%. Even PCE prices (another measurement of inflation) came in better as Q2 advance was 2.6% below the forecast of 3.8%. However, core PCE prices (ex-food and energy) came in at 3.8%, just below the expected 4%. Core prices remain sticky. Markets responded by rising as gold fell, the US$ Index rose, and bond yields jumped. Goldilocks is at work. Then stock markets reversed and closed lower. Recession, what recession? Then came Friday and some downside surprises as personal income was below expectations at +0.3% vs. the expected +0.5% and personal spending was up 0.5% vs. expected up 0.4%. Markets rebounded.
The Fed hiked rates another 25 bp at the July 26 FOMC, as was widely expected. The surprise was that, instead of hinting at a pause, they hinted that they are leaving things open to further hikes if required. That kept the 2-year–10-year spread at around 100 bp. Until that spread bottoms, the odds of a recession remain dim. Typically, in the past, a recession did not get under way until 6–12 months later and by that time the inverted yield curve is mostly normalized.
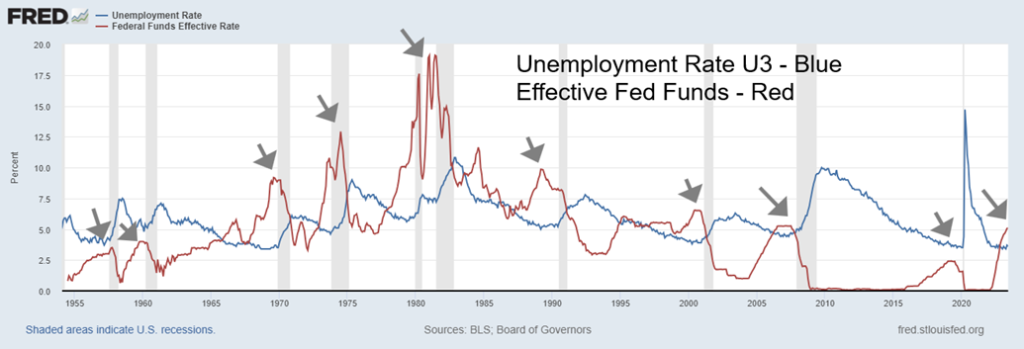
The labour market remains strong with the unemployment rate (U3) remaining near a multi-year low at 3.6%. Even the next level of unemployment (U6) (includes people who want to work, but have given up searching and those working part-time because they cannot find full-time employment) remains at a multi-year low at 6.9%.
The chart below shows the unemployment rate, comparing it with the effective Fed funds rate. Note how the economy goes into recession not long after or sometimes coinciding with a peak in the Fed funds rate. Have we peaked?
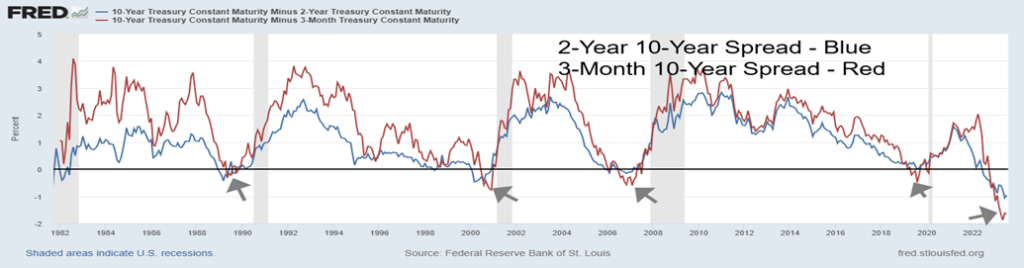
This next chart looks at the inverted spreads. Since the early 1990 recession, the economy falls into recession on average just under 12 months after the 2-year–10-year spread bottoms and just over 8 months after the 3-month–10-year spread bottoms. To date we cannot claim a bottom. If this were the bottom, a recession would not get underway until at least March 2024 out to July 2024. But, we emphasize, we do not as yet have a confirmed bottom. Going back even further, the inverted yield curve has a 100% record of predicting a recession. Yet it is no surprise we read those who dismiss the inverted yield curve and suggest we will only have a mild recession or even no recession. The debate continues on this; however, record-low inverted yield curves do not make us feel warm and fuzzy.
The rise in interest rates has been one of the fastest and even steepest recorded. Even the rate hikes in the 1970s were not as rapid and they did start from a higher base. Interest rates of 5% today seem rather quaint when we recall that rates back in the 70s rose to 20%. However, those rate hikes of the 70s did produce the steepest recession at the time (1980–1982) since the Great Depression.
The U.S. economy has been humming along so far, defying predictions of an impending recession. Some are predicting a steep recession and a debt collapse might be the driver. The world last reported some $305 trillion of debt (governments, corporations, and households). The U.S. has roughly one-third of it. According to the U.S. debt clock (www.usdebtclock.org), total debt in the U.S. has now reached $101.5 trillion. Of that, $32.7 trillion is U.S. federal debt, $3.6 trillion is state and local debt, $24.6 trillion is household debt, and the remaining $40.6 trillion is corporate debt. The world also has $1.2 quadrillion of notional face value derivatives. The U.S. has roughly half of that. The gross risk amount of that is at least $25 trillion. These numbers should scare everyone. Maybe even Barbie.
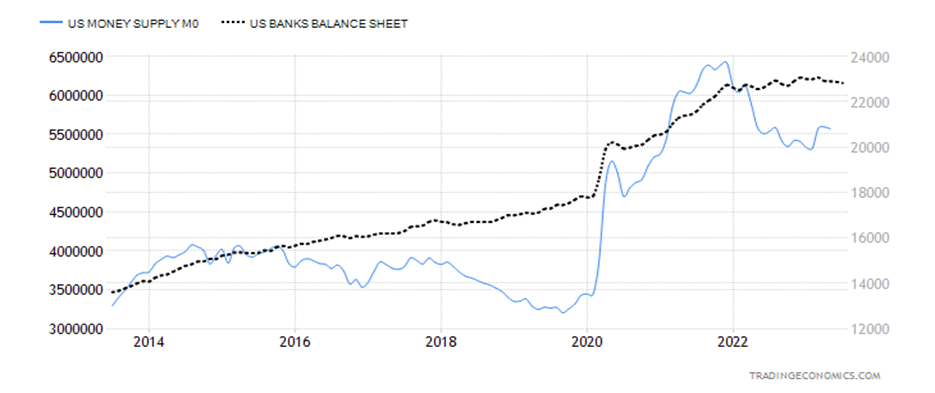
Bankruptcies have been on the rise, but have not as yet reached critical levels. There are considerable risks of sovereign debt collapse, but they resolve it by pushing out the terms and providing IMF loans to maintain what are essentially zombie countries forever indebted to the West. The U.S. debt ceiling wars may raise their ugly head again, but once again it may be resolved by suspending it as they have in the past. The Fed has been downsizing its balance sheet and bank lending is also falling, resulting in contracting bank balance sheets. This means money supply is also falling. The Fed and the banks are effectively withdrawing. Ultimately, that should result in a slowing economy. We have a financial system under stress but, so far, it’s not showing it.
The war without end continues in Russia/Ukraine and could escalate further into a global war, involving NATO/West vs. Russia/China. Political instability has been on the rise with right-wing extremist governments gaining power in a number of countries. There has been the potential for a dangerous coup in Russia, deep political divisions in the U.S. with a potentially disruptive election in 2024, and the deep divisions in Israel, threatening the only democracy in the Middle East. All are nuclear-armed countries. Climate change or, should we just say, extreme weather events are not stopping either and are expected to get worse. The costs to deal with wildfires, hurricanes, extreme heat waves, tornadoes, floods, and droughts is estimated conservatively to exceed $100 billion annually, along with tens of thousands displaced, and is a driver of mass migration. Insurance companies are taking note and those living in areas where floods, wildfires, hurricanes etc. are taking place are finding they can no longer get insurance. Scientists are noting that July has been the hottest on record and the oceans have never been so hot.
It may look like a Goldilocks economy, but behind the veneer lurks trouble. However, if you are Taylor Swift, you’d definitely be in the camp of “recession, what recession.” Her tour is expected to bring in at least $1 billion in ticket sales, plus another $4.6 billion in U.S. consumer spending. Consumers seem to be prioritizing entertainment over goods. The Fed got into the game, mentioning her in the recent Beige Book. And Barbie (the film not the doll) joined the party, generating a record $155 million on her first weekend. However, when Barbie and Ken left Barbie Land and discovered the real world isn’t all pink, things didn’t look quite so good. Maybe The Doors have the final say when they wrote “This is the End.” Oh yes, that played over the appropriately named Apocalypse Now (1979–United Artists, produced and directed by Francis Ford Coppola).
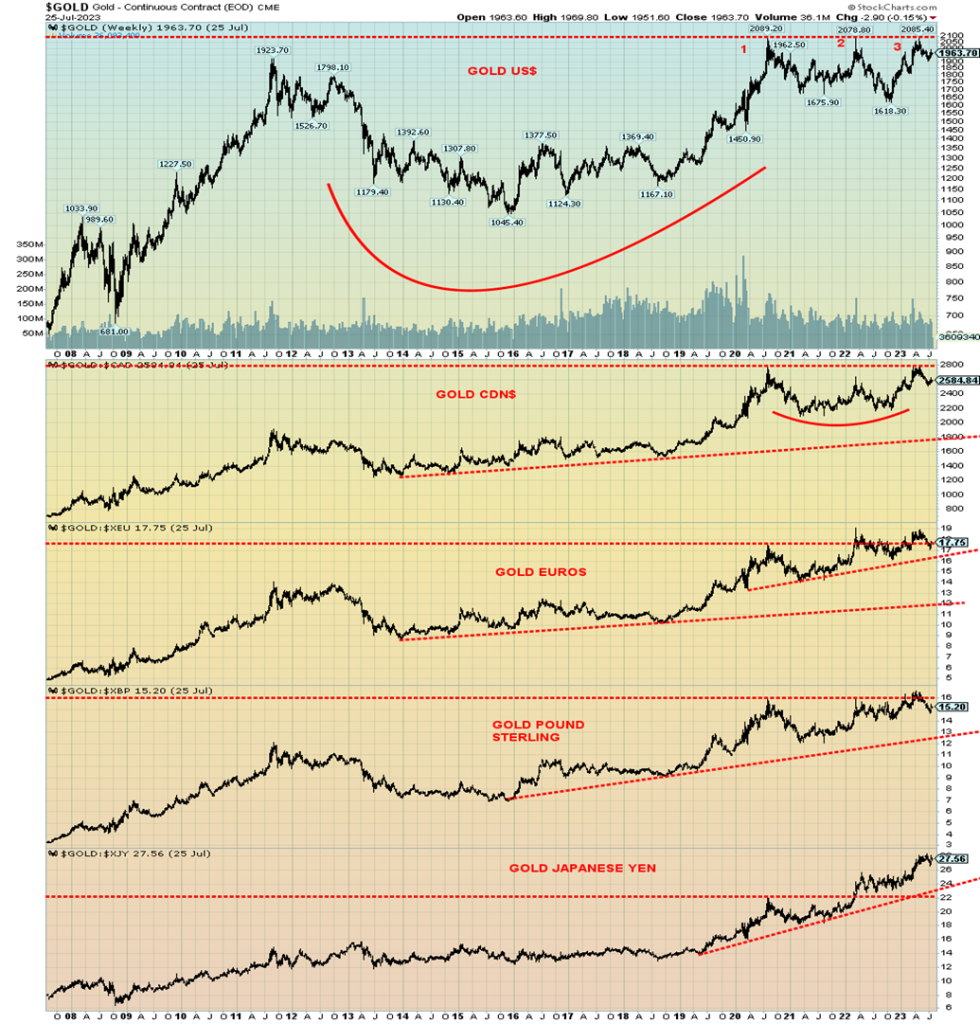
When most people think of gold, they think of it only in terms of U.S. dollars, as that is what they are used to. All commodities are quoted in U.S. dollars, so this not only not new, it is normal. Unfortunately, here in Canada we also mostly think of gold in terms of U.S. dollars when we should be thinking of it in terms of Canadian dollars. In the EU, think of it in terms of euros, in Japan in Japanese yen, and in the U.K. in terms of pound sterling. In any country, one should be thinking of gold in terms of their currency, not in U.S. dollars.
When they say gold hasn’t made new highs in years, they are referring to gold in U.S. dollars. And they are correct. But if Canadians thought of gold in Canadian dollar terms, they’d realize that gold did make new highs back in May 2023. Not by a lot, but new highs nevertheless. In Japanese yen, gold has been making new highs for the past couple of years thanks to a sinking yen. In many lesser currencies, gold has soared to new highs. An interesting, more recent one is gold in Israeli shekels. As the situation in Israel deteriorates with protests against the Israeli government’s judicial reform, the shekel has been falling in value. But in terms of gold, it has been rising to new highs.
The shekel has been falling and confidence in the government has been falling—those are perfect conditions for gold. Note, not in terms of inflation or deflation but confidence in government. Gold rises and falls, but in a real bull market gold is rising in all currencies, not just a few. The August 2020 post-pandemic high was important, but not all have taken it out. The U.S. is waiting with its third visit to that high. But $2,089 remains intact, even as it also rose to $2,078 in March 2022 and again to $2,085 in May of 2023.
In Canadian dollars, gold poked briefly to new highs but it wasn’t sustained. In euros, it did rise to new highs but has since pulled back; ditto with gold in pound sterling. However, with gold in Japanese yen, it broke out in March 2023 and hasn’t really looked back. Two currencies that have been under pressure are Russia and Turkey. Russia is involved in a war; sanctions have bit as the economy falls into recession and there have been internal problems over conducting the war. The ruble has fallen, but gold in terms of rubles has soared. Ditto for Turkey where, while there are internal problems, gold in terms of the Turkish lira has soared. Falling currency and confidence in government are two things to get gold to rise. There are many other examples.
Canada, the EU, the U.K., and Japan are amongst the world’s largest economies. When gold starts hitting new highs in all those currencies plus U.S. dollars, we will know we are in a bull market. What is interesting for gold in U.S. dollars is we have tested that high three times. We labeled them in the chart as 1, 2, and 3. Triple tops are rare. But, yes, it could be.
That last low was seen in November 2022 at $1,618. Was that our 7.83-year and 23.5-year cycle low? We can’t assume that just yet. Not until we at least start to see new highs above $2,100. Is the fourth time a charm? Triple tops are rare, and it is that rareness alone that makes it potentially weak. We thought that the November 2022 low was early for our cycles. A low further out to, say, December 2023, would be more appropriate. But if we do have a low at that point and it is higher than the November 2022 low, then the odds favour a big rally to get underway. The alternative is seeing that rare triple top come into play and a breakdown under the November 2022 low of $1,618 could see gold fall to as low as $1,100/$1,200. We don’t believe we’ll see that, but it remains a possibility until we see new highs above $2,100 and gold rising in all currencies. Will the fourth time be a charm?
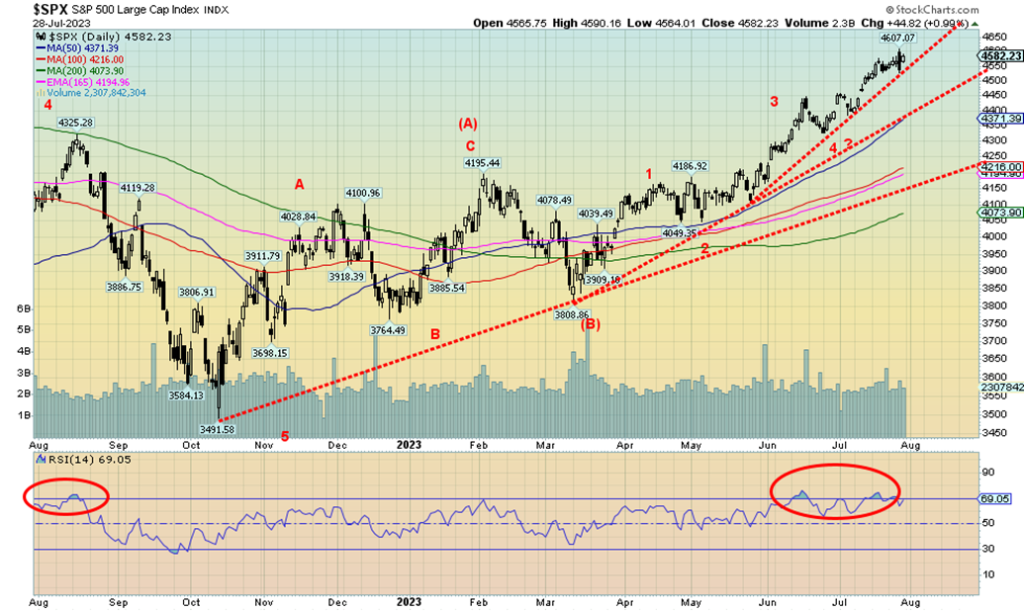
Is the market topping? A lot of people got pretty excited over Thursday’s reversal day that saw the S&P 500 (and others) make new highs, then reverse and close lower. A key reversal? Key reversals are usually off of all-time highs. So, this was just a big reversal day. Disappointingly, the market failed to follow through to the downside on Friday as cooling inflation helped offset the fears of the Fed hiking rates and the stronger than expected Q2 GDP. Still, it is something to consider.
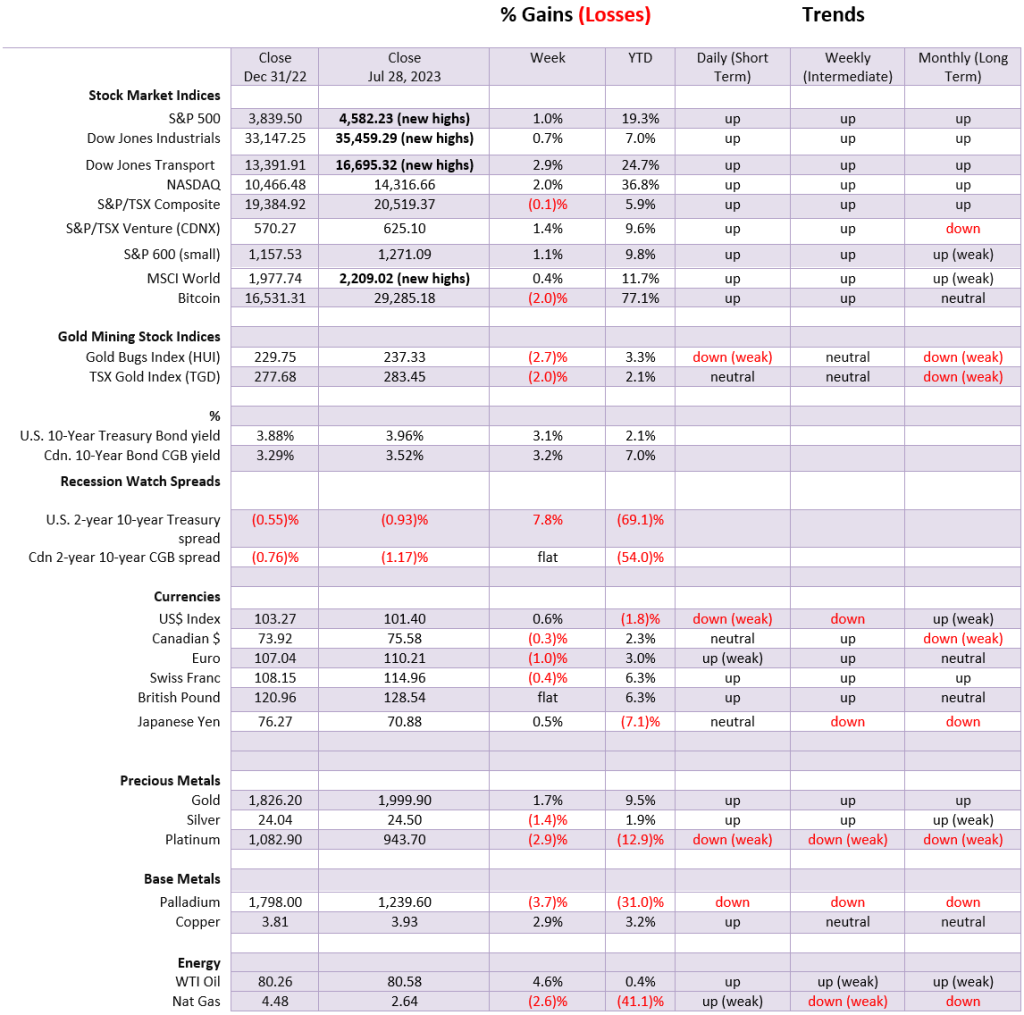
On the week, the S&P 500 gained 1.0% to new highs, the Dow Jones Industrials (DJI) also hit new highs, up 0.7%, while the Dow Jones Transportations (DJT) joined the new highs party up 2.9%. The DJT is now up 24.7% on the year. The S&P 500 is up a healthy 19.3%. The NASDAQ did not join the new high party, but still it gained 2.0%. The S&P 400 (Mid) did make new highs, up 0.4%; however, the S&P 600 (Small) did not make new highs but still gained 1.1%. The NY FANG Index gained 3.3% but no new highs. Warren Buffett’s Berkshire Hathaway did see new highs, gaining 1.0%. Bitcoin appears to be rolling over as it fell 2.0% but remains above $29,000.
In Canada, the TSX Composite definitely was not in a party mode as it was the only major index to fall, off 0.1%. The junior TSX Venture Exchange (CDNX) gained 1.4% and could be on the cusp of breaking out. The MSCI World Index was up to new highs, gaining 0.4%. In the EU, the London FTSE was up 0.5%, the Paris CAC 40 gained 3.4%, the EuroNext gained 0.9%, while the German DAX did make new highs, up 1.8%. In Asia, China’s Shanghai Index (SSEC) jumped 3.4%, the Tokyo Nikkei Dow (TKN) gained 1.4%, while Hong Kong’s Hang Seng (HSI) was a big winner, up 4.4%.
We are maintaining our target of 4,800 for the S&P 500. This past week we hit 4,600, so we are getting there. We have noted that tops in July to September are not unusual. But we do not have a sell signal, despite numerous growing divergences. It is not suggested that one should be buying at this point in time. Our first minor sell signal could come under 4,500. But a better sell signal would be seen with a break of 4,400 and definitely under 4,300. Long-term support comes near 4,200 and the 200-day MA is just under 4,100. Nevertheless, we believe that once a new down wave gets underway it would be our intermediate C wave to the downside that could take us to new lows below the October 2022 low of 3,491. That remains speculative at this time, as the growing consensus of a “nothing but a mild recession” is taking hold. The risks are there, but the market’s focus is on earnings, continued good economic numbers, and slowing inflation. All music to the ears of the stock market. It just ignores the huge debt, climate change, wars, and deep political divides.
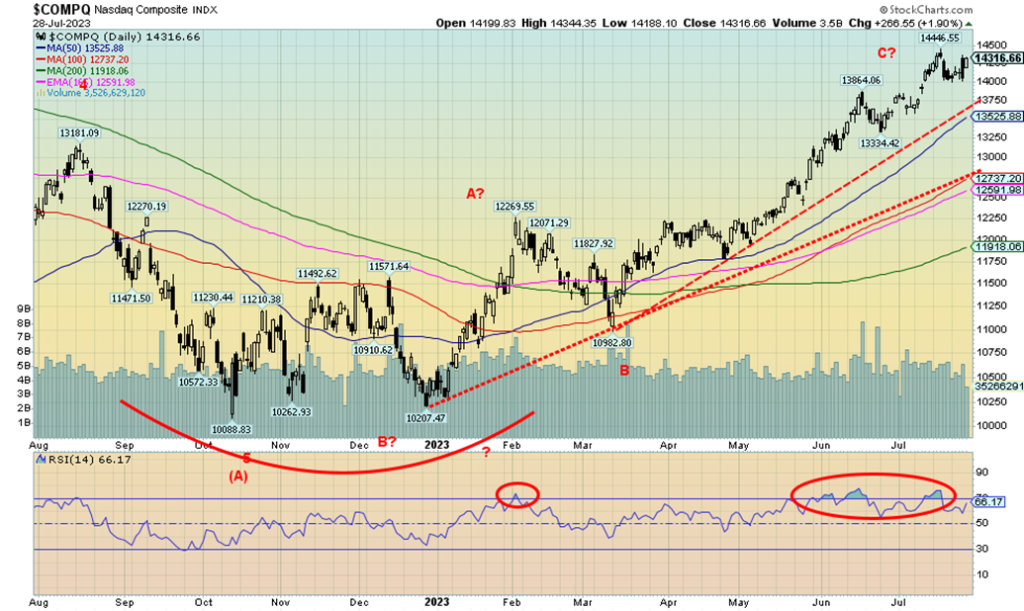
The NASDAQ was the only major index that did not make new highs this past week. A divergence? Another sign of a potential top? The NASDAQ did gain 2.0%. The NY FANG Index was up 3.3% and it is the FAANGs that took the NASDAQ higher. The big winners of the FAANGs were Meta, once again making all-time highs, up 10.6% on the week. Google also gained 10.6% and it too saw all-time highs. But the gains for the others were more muted. Netflix lost 0.4%. Baidu gained 9.8%, and Alibaba was up 9.1%. The big winner on the year, Nvidia, was up 5.5% but did not make new highs. The Chinese stocks are still alive as was witnessed by a good gain this past week by the Shanghai Exchange (SSEC). While the NASDAQ is off its highs, we still don’t have a good sell signal. A number of indicators are making negative divergences. Ones like the MACD indicator are in a slow sell mode on the dailies (short-term trend) but nowhere near a sell signal on the weeklies (intermediate trend). The short-term trend is more important to traders, while the intermediate trend is more important to investors. We’d have a short-term sell signal if we break the recent low near 14,000, but a better one would come in under that uptrend line near 13,750 and the most recent good low at 13,334. Support is seen down to 12,750. The 200-day MA support is well down at 11,900. So far, all this pullback has done is ease the overbought situation. But it has yet to give us a clear sell signal. New highs would end any discussion of a top.
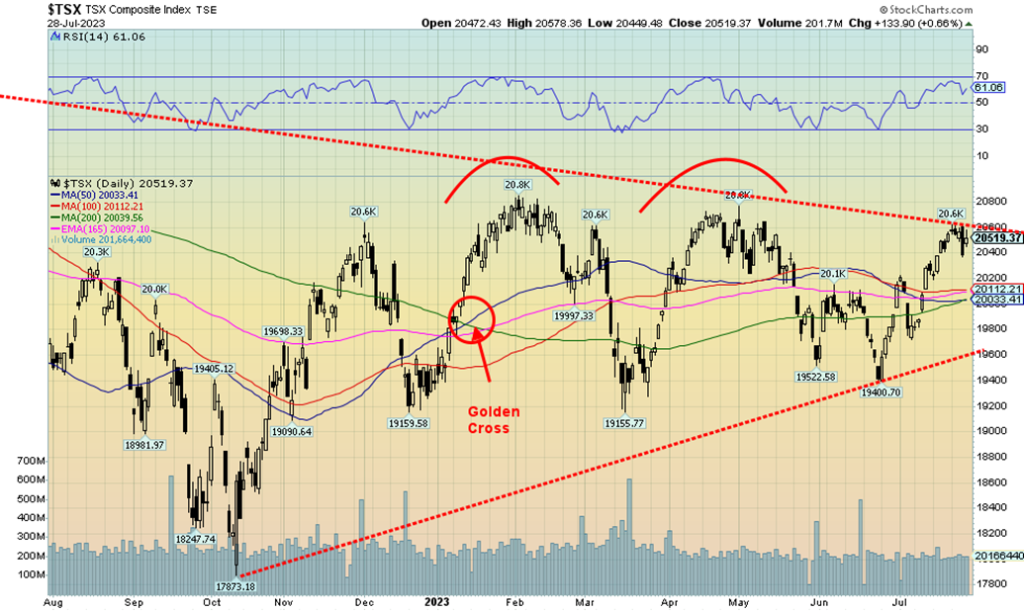
The TSX Composite appears to be having all sorts of problems trying to bust above that downtrend line. It did get over it briefly, only to fall right back. We call that a false breakout. What you want to see is a break of those January and May highs near 20,800 to confirm that we have broken out. That hasn’t happened yet, but it can’t be ruled out. A break now of 20,400 could give us a sell signal and see us fall to that conglomeration of support between 20,000 and 20,100. On the week, the TSX was an underperformer. While everyone else gained, the TSX fell 0.1%. The junior TSX Venture Exchange (CDNX), however, enjoyed a good up week, gaining 1.4%. The CDNX still appears to be trying to form a consolidation bottom pattern. We noticed a number of junior mining stocks had a decent up week.
Eight of the 14 sub-indices were down on the week and one was flat. Consumer Discretionary (TCD) was flat after making fresh 52-week highs, the only sub-index to do so this past week. The leader to the downside was Consumer Staples (TCS), down 2.2%. Telecommunications (TTS) fell 2.1% and Golds (TGD) were down 2.0%. The big winner was Health Care (THC)—last year’s dog is the big star this year. THC gained 8.7%. But it’s a small component. Of the larger components, Energy (TEN) was up 4.3%, the only other big winner. Financials (TFS), the largest component in the TSX, fell 0.4%.
Given that many of the U.S. indices appear to be rolling over, the TSX, if it is stay alive, must take out that downtrend line and the aforementioned highs. Energy and Materials (Golds, Metals, etc.) could save it.
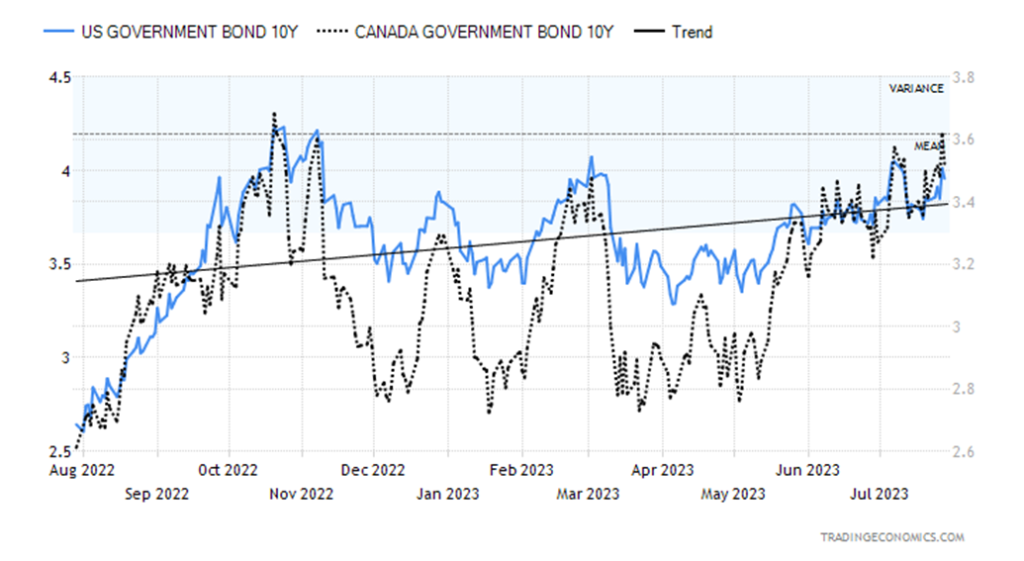
Given all the talk of a soft landing and a persistent inverted yield curve, interest rates may not yet be ready for a major rally. After weeks of range trading between roughly 4% on the upside and support down to around 3.40%, the U.S. 10-year treasury bond could be poised to break out to the upside rather than break down. We know the long downtrend from the 1981 high in interest rates has been broken. We are entering a new period of higher interest rates rather than a return to the ultra-low interest rates many got used to. To move higher now, we need a firm breakout above 4% and then above the last high at 4.25%. The U.S. 10-year rose 3.1% this past week from 3.84% to 3.96%. The Canadian 10-year Government of Canada bond (CGB) jumped to 3.52% from 3.41% up 3.2%. The U.S. 2-year 10-year spread dropped slightly to 93 bp, but remains at or near low levels. Ditto for Canada as the 2–10 spread remained unchanged at 117 bp. We continue to note that no recession could take place until 6–12 months following a bottom in the inverted yield curve. Until that happens, there will be no recession until later in 2024. That a recession could happen is a given, we believe, as the inverted yield curve has a 100% accuracy rate.
The big number this coming week are the job numbers on Friday, August 4. Expectations are for nonfarm payrolls to be up 200,000 vs. 209,000 in June. The unemployment rate should be steady at 3.6%. In Canada, they are looking for a rise of 20,600 jobs vs. 59,900 jobs in June and an unemployment rate of 5.5% vs. 5.4% in June. A number of ISM numbers and PMI numbers are also out earlier week. All that could keep the coming week busy. Good numbers would be positive for the stock market and potentially USDX and negative for gold, but would be good for oil prices.
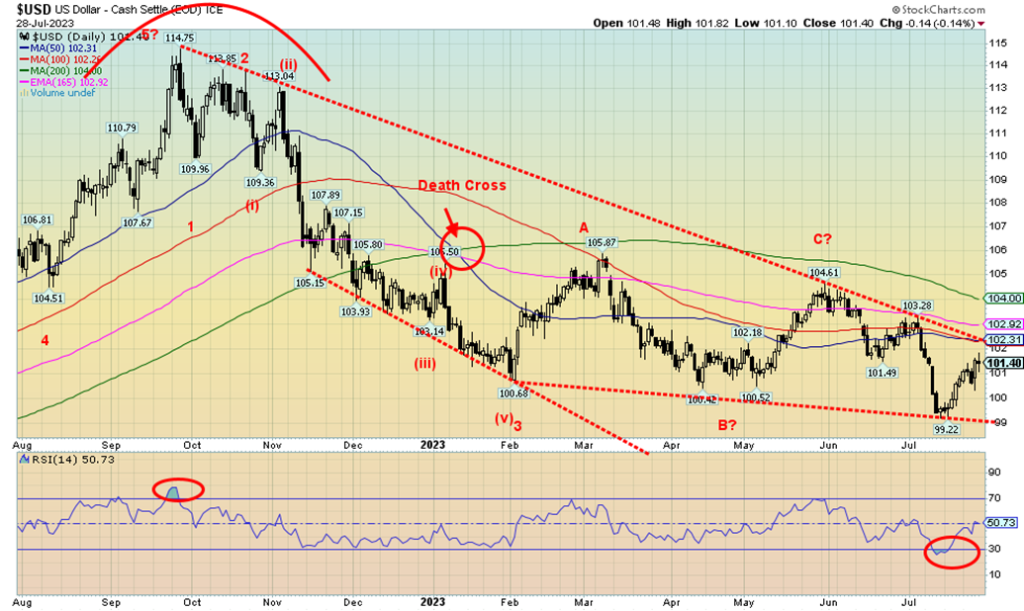
Thanks to another hike in the Fed rate, along with some decent economic numbers such as durable goods and Q2 GDP, the US$ Index (USDX) jumped again this past week. It was steadied on Friday when PCE prices continued to point to a decline in inflation. On the week, USDX gained 0.6%, the euro lost almost 1.0%, the Swiss franc was off 0.4%, the pound sterling was flat, while the Japanese yen gained 0.5%, thanks to suggestions from the BOJ that they could let interest rates rise. What the BOJ did was suggest that 0% for the 10-year was no longer feasible and that the ceiling of 0.5% was not fixed. All that suggested that the BOJ could let interest rates rise, which in turn was positive for the Japanese yen. The Canadian dollar lost 0.3% on the week. USDX remains in a downtrend despite the rebound. Resistance is above near 102.30. A break of that level could see USDX rise to 104 and the 200-day MA. Our key support is at 99. That break of 100 proved to be a false breakdown. Will USDX be so lucky the next time? We could be forming a descending triangle, so a break of 99 could prove fatal. A falling USDX is positive for gold.
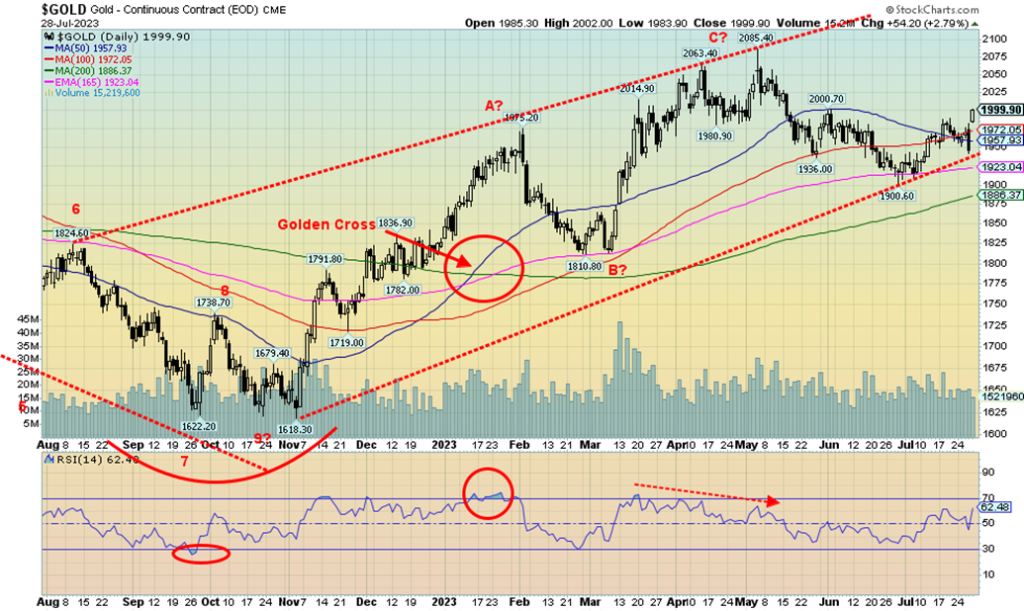
Has gold broken into our resistance zone of $1,980/$2,000? It appears to have done so, as we closed at $1,999. But then we note that they changed the front month of gold futures to December. The September or even August futures, which we had assumed was the front month, remain at $1,970 and $1,960, respectively. But it’s the front month futures we (and others) follow, so on paper we are now into our $1,980/$2,000 resistance zone. A firm break over $2,000 this coming week would be helpful for the bulls. The result of all of this is gives us different interpretations as to where the next move takes us. Using the December futures as our front month, we still need to break out over $2,040/$2,050 to suggest new highs above $2,085. As we noted in our Chart of the Week, the fourth attempt to break what appears to be a triple top could be the charm that finally takes us over $2,100. The drop this week, including the outside reversal day on Thursday (higher high, lower low, lower close), tested our uptrend line from the November 2022 low of $1,618. So far, that remains the low of this cycle, but the cycle low can only be confirmed with a firm breakout above $2,100. In the interim, we will assume that break into our resistance zone of $1,990/$2,000 is underway but a close over $2,000 this coming week is essential to confirm this.
On the week, gold gained 1.7%, thanks to the front month switch. However, no one else did. Silver lost 1.4%, platinum has been stuck in a rut and was down 2.9%, and the near precious metals did no better. Palladium lost 3.7% but copper, buoyed by thoughts of a mild recession, rose 2.9%. The gold stocks fell with the Gold Bugs Index (HUI) down 2.7% and the TSX Gold Index (TGD) off 2.0%.
With gold needing to confirm a breakthrough above $2,000, we have to keep an eye on the downside in the event of a failure. We have been buoyed by the fact that $1,940/$1,950 held on the last pullback but a break of that zone could soon see us at $1,900, with further support ranging down to $1,885. A break of the $1,940/$1,950 zone would ensure a break of the uptrend line from November 2022 and officially end this rally for the time being. Gold was reacting negatively to the Fed’s rate hike when they didn’t confirm a pause but, instead, they were keeping their options open. Continued strong economic numbers such as the Q2 GDP and durable goods are not helping. Next week we have the July job numbers and, unless we see an uptick in unemployment and a drop in nonfarm payrolls, that could also hurt gold. The US$ Index was up this past week and that did not help gold. The only thing helping gold was the switch to December futures.
Our biggest hope is the so-called triple top (August 2020, March 2022, and May 2023 at $2,089, $2,078, and $2,085) is broken. Is four times the charm? Meanwhile, $1,940/$1,950 needs to continue to hold.
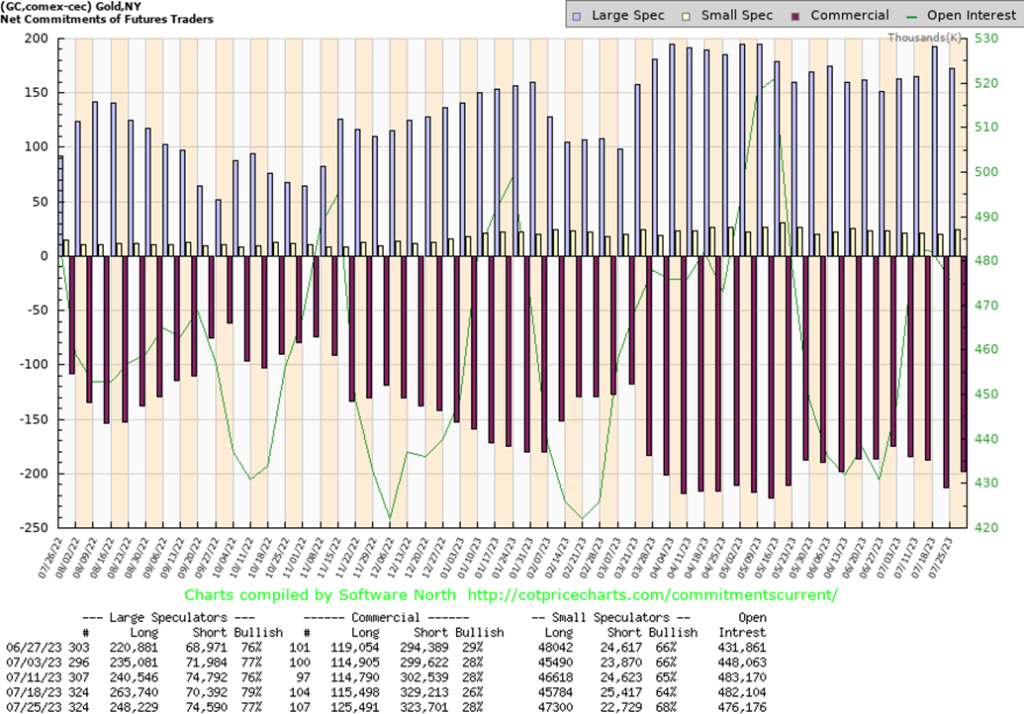
The Commitment of Traders (COT) report from COT Price Charts is back. The commercial COT (bullion companies and banks) rose to 28% this past week from 26% the previous week. It also ended a few weeks in a row where the commercial COT had been falling. That’s a positive development but we need to see follow through. On the week longs rose roughly 10,000 contracts while shorts fell about 6,000 contracts. The large speculators COT (hedge funds, managed futures etc.) fell to 77% from 79%. Large speculator longs fell about 15,000 contracts while shorts rose roughly 4,000 contracts. A positive report but we’d like to see it even higher for the commercials.
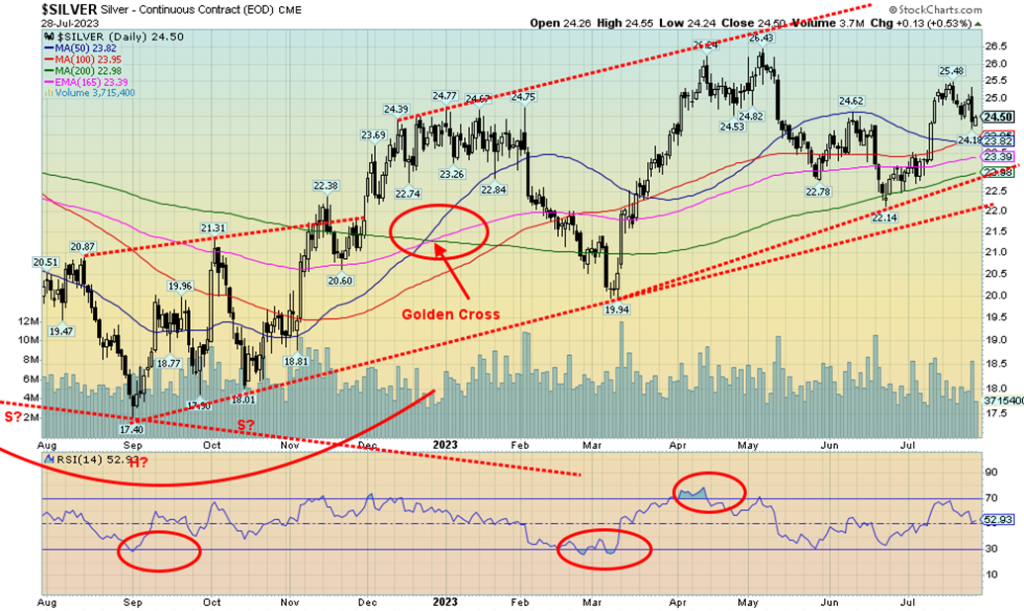
Despite the up week for gold (mostly due to switching the front month to December futures), silver fell this past week, losing 1.4%. Silver’s front month remains at September. The December silver futures are at $24.85, which is 35 cents higher. Thursday’s reversal day (higher high, lower low, lower close) had no follow-through as silver rose 0.5% on Friday. We admit it is very mixed here and both bullish and bearish possibilities exist. The decline from the $26.43 top appears to have fallen in an ABC fashion. What we don’t know is, is this up wave merely a correction to the decline or is it the start, seeing higher silver prices? While the pundits love to talk about shortages, short squeezes, and more, the reality on the ground is that silver has sorely lagged gold. The recent rise failed at $25.50. It was a bad spot to fail as it had suggested that we could be in a position to challenge the recent high at $26.43. So, its failure puts that in doubt. Volume has also tailed off on this rise. The RSI has dropped to neutral. If we are to take out $26.43, a close over $25.50 is essential. Support can be seen down to $23.80, but a break under that level could send us down to $23 and better support. A break of $23 suggests $22 is next, with potentially new lows under that June low of $22.14. That’s why the current position is mixed and we could, in theory, go either way. It’s essential that the bulls regain $25.
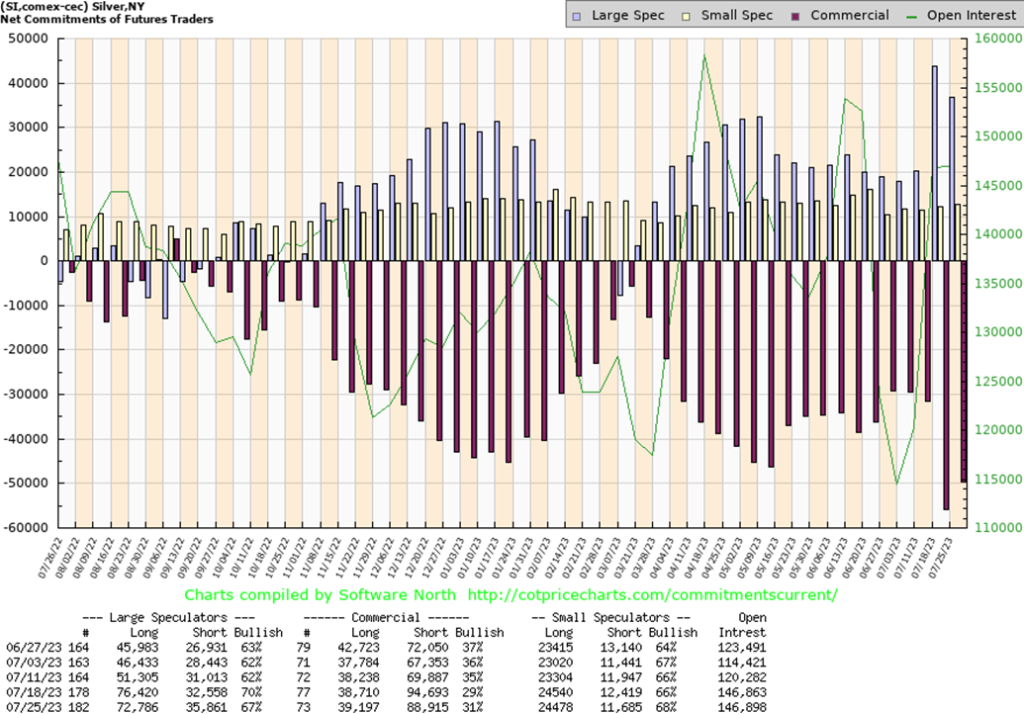
Two weeks ago, the commercial COT for silver plunged from 35% to 29%. A dramatic drop that we don’t normally see. Then this past week the commercial COT went up again to 31% from 29%. Erratic action from the COT? Longs only improved by a few hundred but shorts dropped about 6,000 contracts. Two weeks ago, the shorts rose a dramatic 25,000 contracts. The large speculators COT was also volatile as it slipped to 67% from 70% but three weeks ago it was at 62%. The large speculators saw their longs fall about 4,000 contracts and shorts rise roughly 3,000 contracts and that helped the COT to fall. The erratic and volatile shifts in the silver COT the past couple leaves us baffled as to how to interpret. We’ll await next week’s report.
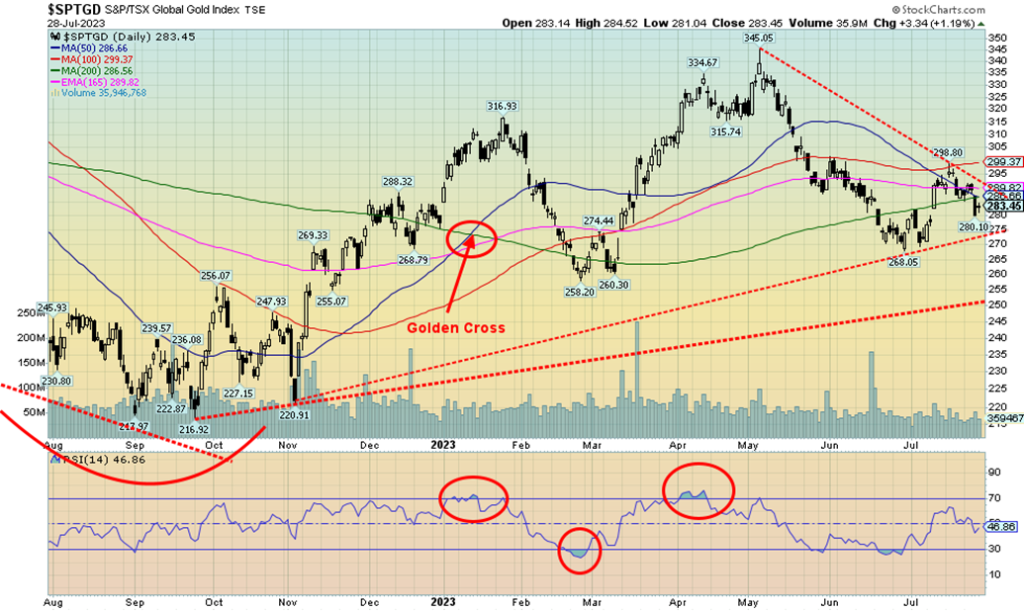
After jumping solidly, a couple of weeks ago, the gold stocks have been backing and filling ever since. This week, the TSX Gold Index (TGD) fell 2.0% and the Gold Bugs Index (HUI) dropped 2.7%. This setback occurred for the second consecutive week. Failure came at the 100-day MA and the drop has pulled the TGD above back under the 200-day MA. Uptrend support lies below at 275 and if we are to move higher that zone must hold. 300 proved to be resistance. The resistance ranges up to 305, but above that level a run to 320 is possible. The TGD came off oversold levels a couple of weeks ago after downtrends that got underway in May and continued into June. A breakdown under 275 and especially under 270 would be quite negative and suggest the potential to fall to 190. Note there is another trendline support at 250, so a breakdown under that level would focus us to the 190 target. Hence, it is important for the bulls that we turn around and take out 300 resistance. Seasonals can be positive, but taking out key technical points is more reassuring for an uptrend. However, given the pullback after the strong up week two weeks ago, this is a cautionary sign.
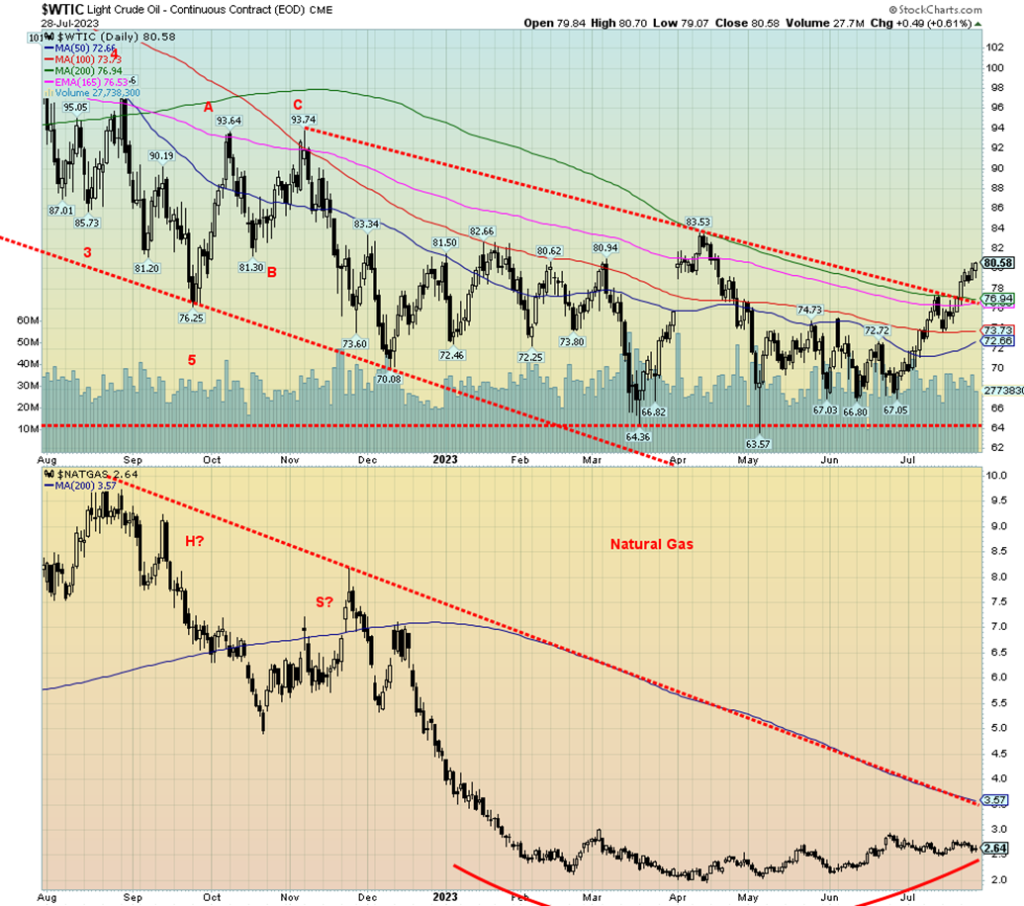
WTI oil prices finally appear to be breaking out. Despite supply concerns, there appears to be growing optimism that any recession will be a soft landing. Not only did WTI break out over the downtrend this past week, but it also managed to close over $80, another positive sign. Brent crude, on the other hand, is just its downtrend line, despite closing the week over its 200-day MA and over $84. On the week, WTI gained 4.6% while Brent was up 4.7%.
Natural gas (NG) was mixed as the Henry Hub NG fell 2.6% but the EU Dutch Hub rose 1.5%. Heat waves continue across Southern Europe and the Southern U.S., driving up demand for AC. The energy stocks may be
leading the way as the ARCA Oil & Gas Index (XOI) jumped 2.4% and the TSX Energy Index (TEN) was up 4.3%.
Despite the breakouts, we’ll need to see a few things this coming week. It could be key that WTI continues its uptrend, so follow-through is important. Brent needs to complete its breakout. For NG, that rounding bottom keeps getting larger and longer, but it too must break out to prove that the pattern is real. Over $3 is encouraging, but the reality is NG needs to get over $3.50. Seasonals are not in favour, but some key hurricanes could change the equation if they force shutdowns.
We remain optimistic on energy as one of the key places to be going forward.
__
(Featured image by Born2Invest)
DISCLAIMER: This article was written by a third party contributor and does not reflect the opinion of Born2Invest, its management, staff or its associates. Please review our disclaimer for more information. This article may include forward-looking statements. These forward-looking statements generally are identified by the words “believe,” “project,” “estimate,” “become,” “plan,” “will,” and similar expressions. These forward-looking statements involve known and unknown risks as well as uncertainties, including those discussed in the following cautionary statements and elsewhere in this article and on this site. Although the Company may believe that its expectations are based on reasonable assumptions, the actual results that the Company may achieve may differ materially from any forward-looking statements, which reflect the opinions of the management of the Company only as of the date hereof. Additionally, please make sure to read these important disclosures.
Copyright David Chapman 2023
David Chapman is not a registered advisory service and is not an exempt market dealer (EMD) nor a licensed financial advisor. He does not and cannot give individualised market advice. David Chapman has worked in the financial industry for over 40 years including large financial corporations, banks, and investment dealers. The information in this newsletter is intended only for informational and educational purposes. It should not be construed as an offer, a solicitation of an offer or sale of any security. Every effort is made to provide accurate and complete information. However, we cannot guarantee that there will be no errors. We make no claims, promises or guarantees about the accuracy, completeness, or adequacy of the contents of this commentary and expressly disclaim liability for errors and omissions in the contents of this commentary. David Chapman will always use his best efforts to ensure the accuracy and timeliness of all information. The reader assumes all risk when trading in securities and David Chapman advises consulting a licensed professional financial advisor or portfolio manager such as Enriched Investing Incorporated before proceeding with any trade or idea presented in this newsletter. David Chapman may own shares in companies mentioned in this newsletter. Before making an investment, prospective investors should review each security’s offering documents which summarize the objectives, fees, expenses and associated risks. David Chapman shares his ideas and opinions for informational and educational purposes only and expects the reader to perform due diligence before considering a position in any security. That includes consulting with your own licensed professional financial advisor such as Enriched Investing Incorporated. Performance is not guaranteed, values change frequently, and past performance may not be repeated.


Blockchain Evolves Toward AI, Finance and Quantum Security
Blockchain is evolving beyond crypto into finance, AI applications, and digital markets, while security and regulation remain challenges. Quantum threats...


The Italian Crowdinvesting Market Faces Sharp Decline in 2026
Italian crowdinvesting market continued to decline in 2026, with fundraising falling 36.8% year-on-year to €164.19 million. Platforms and active campaigns...


Sartorius Stedim Biotech Maintains Growth Momentum in H1 2026
Sartorius Stedim Biotech reported solid H1 2026 results, with revenue reaching €1.527 billion and EBITDA rising to €479 million. Growth...


Bank of Africa Launches BOA MDM Network to Boost Diaspora Investment in Morocco
Bank of Africa launched the BOA MDM Network to channel diaspora remittances into productive investment, aiming to raise their share...


Switzerland’s Medical Cannabis Reform Advances Access, But Barriers Remain
Switzerland’s 2022 medical cannabis reform improved patient access by removing federal approval requirements, but challenges remain. MEDCAN highlights barriers including...
 |
|
 |  |
 |
|
-

 Fintech1 week ago
Advanced Blockchain Under Pressure Amid Crypto Market Shifts
-

 Fintech6 days ago
FinTech Matures as AI and Infrastructure Drive the Next Growth Phase
-
 Fintech2 weeks ago
Withings Achieves Profitability in 2025 with 90% Growth Since 2018
-
 Cannabis3 days ago
Switzerland’s Medical Cannabis Reform Advances Access, But Barriers Remain