Featured
The NYSE Debt Margin Was Published: Why It Declines in Deflating Markets
A market highly leveraged with margin debt, is a market at risk for forced selling into a down market. During a really bad day in a market decline, a day where one wonders how far can the market go down before it closes, is most likely a day where brokers liquidated a good deal of margin debt.

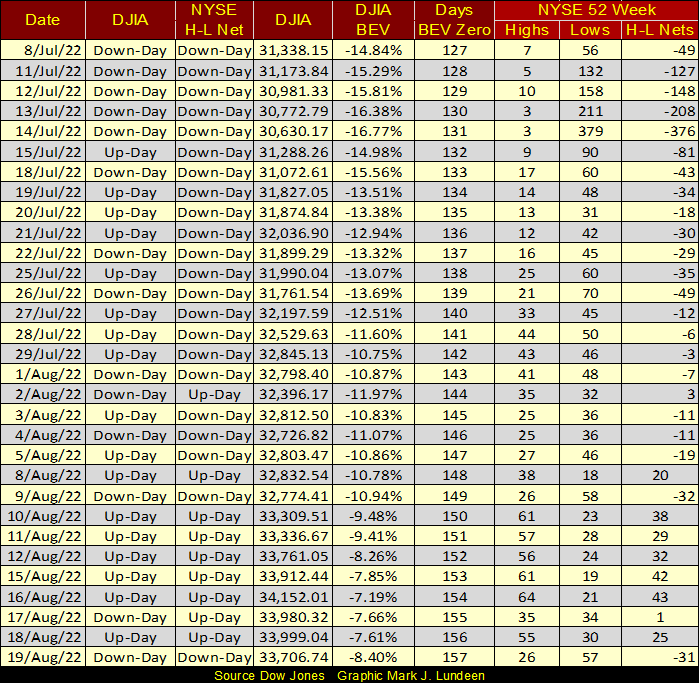
This was a slow week. It’s difficult writing something interesting about mostly nothing, but I’ll give it my best shot. Nothing much happened with the Dow Jones this week; down by 54.31 from last Friday’s close. A decline barely visible in the BEV chart below. That’s how it goes sometimes, when investors have to hurry up to wait. But wait for what?
That’s the question I’d like to know the answer to. Personally, my guess is we’re waiting for some good market action prior to America’s November election. After that, a few weeks or months pause to create the appearance that the November election was a market-neutral event, we’ll be waiting for something completely different.
This week the Dow Jones closed with a BEV of -8.40%. Less than 10% from a new all-time high. With September and October between us and the election, we just may see some history being made before November.
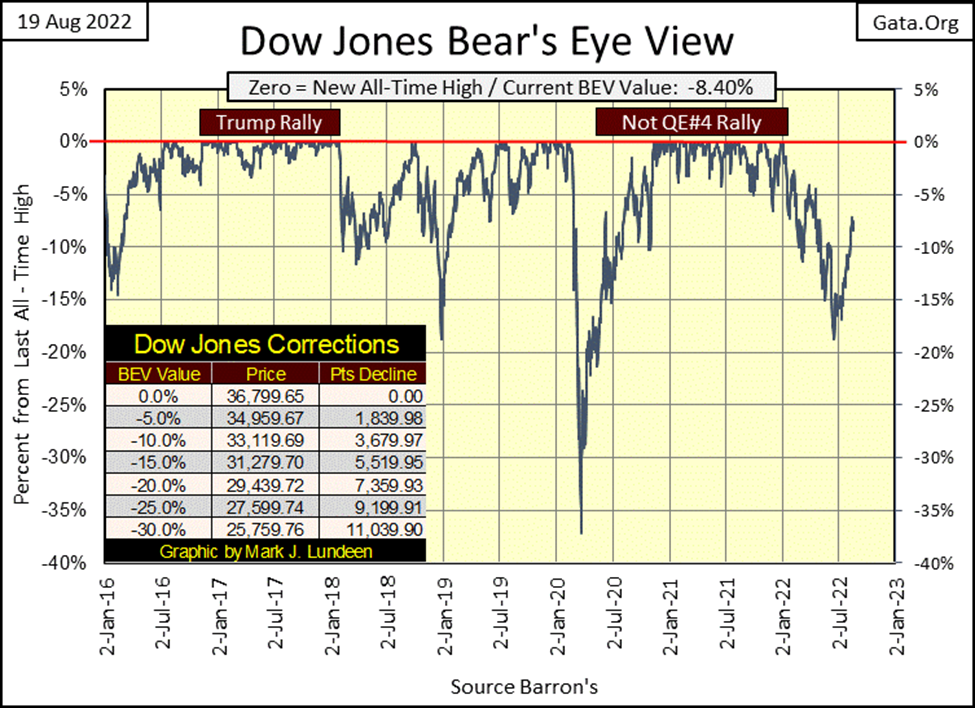
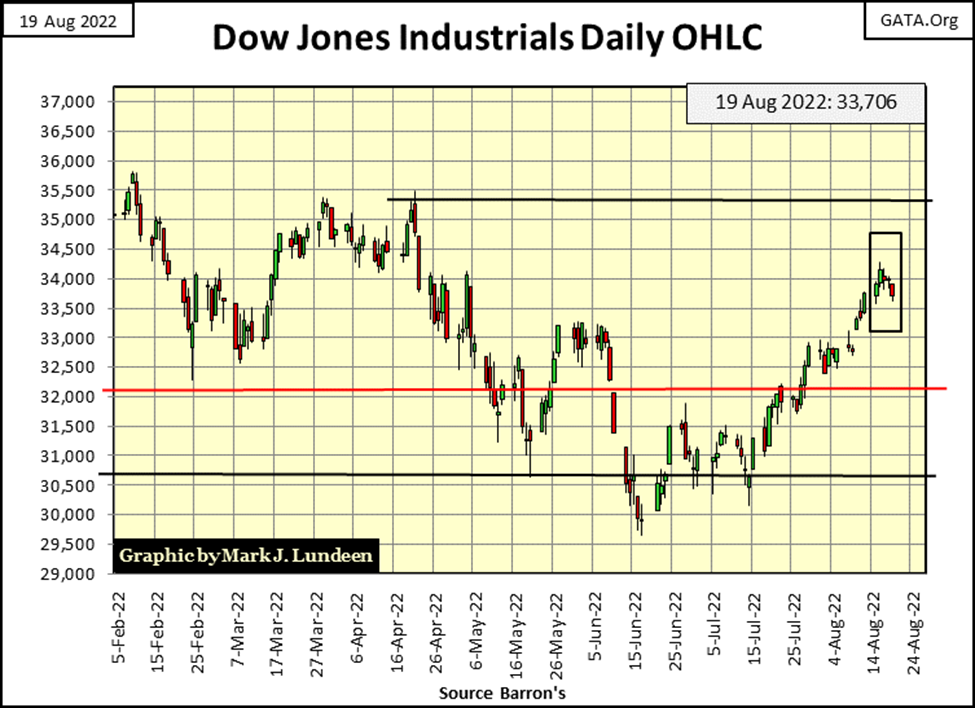
The Dow Jones in its daily bars below shows what happened this week better than its BEV chart above. Monday and Tuesday saw some good market action, but by the end of the week all that changed, closing the week down by 54.31 from last Friday’s close.
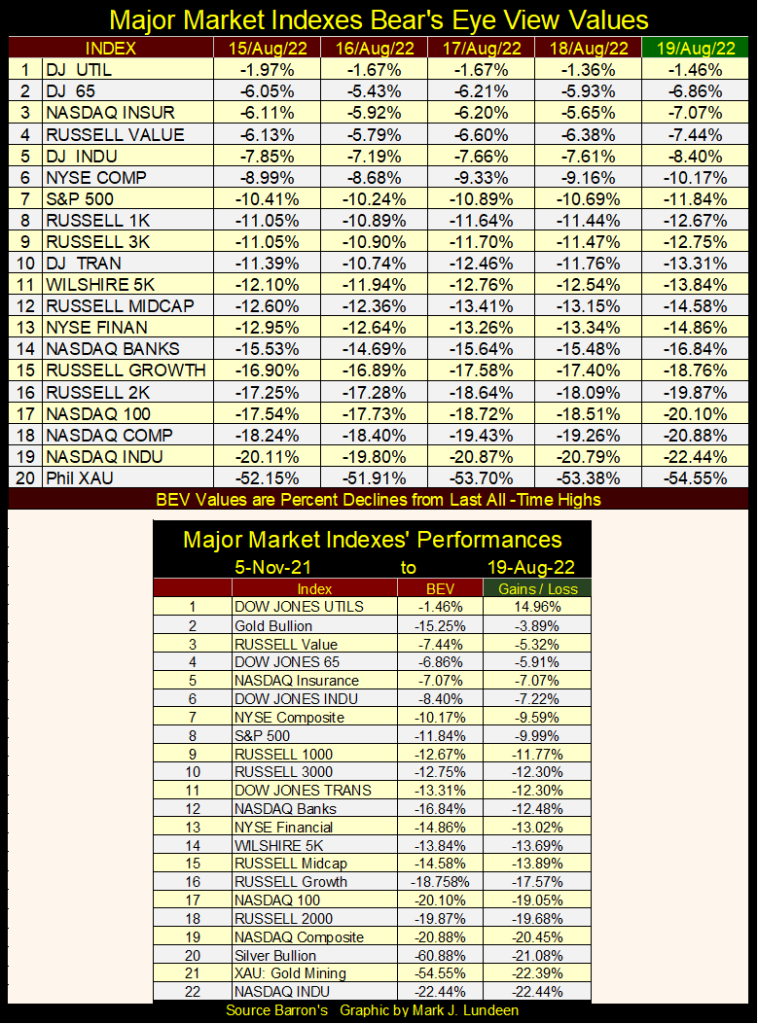
For the other major stock market indexes I follow, it was much the same story for them this week too. Look at the Dow Jones Utility Average (#1 below); it was in scoring position all week, better than that, less than 2% from making a new all-time high.
If the DJ Utility doesn’t make a new all-time high sometime soon (BEV Zero / 0.00%), as the other indexes continue failing to advance into scoring position (BEV of less than -5.00%), that would not be good. But I don’t believe that is our future. With fingers crossed, I’m expecting some new all-time highs in the table below before November.
I took my weekly-close commodity prices, indexing them and made an average of the indexes, creating my own CPI index. How good is it compared to, say what the Department of Labor publishes? Maybe better, or maybe worse, but is something that I can plot on a chart that isn’t “hedonically adjusted” by government statisticians.
Note; the commodities used in this average are seen in the table on the chart below, as well as their close of the week factor increases for each since August 1993. I have four stock-market averages included in the table for comparison, BUT not used in the commodity average (#11).
We see the large jump in consumer prices off the March 2020 bottom, when Fed Chairman Powell began “injecting” a few trillion-of-dollars of “liquidity” into the financial system with his Not QE #4. Who could have seen that happening?
Of interest to us; my CPI index has come down since its highs of last March when it peaked at 4.43. This week it closed at 3.89, down 12% from last March. Like everything else positive about this market, I’m expecting this too to change after November.
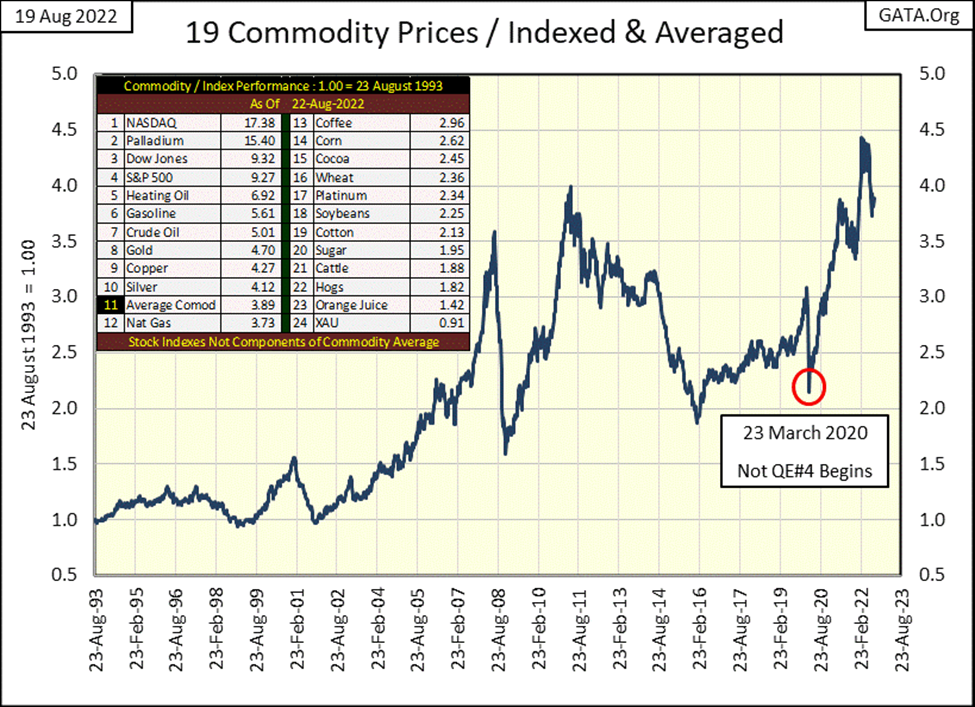
With the exception of the gold miners in the XAU, the major stock indexes in the table above have, since August 1993, outperformed the advances in commodity prices. But in the 1990s, “liquidity injected” into the financial system flowed into financial assets valuations (bull markets), not commodity and energy prices (CPI inflation).
Today, in 2022 all that has changed, with “injected liquidity” now flowing into commodity and energy prices. In the coming years, I’m anticipating the stock indexes will begin migrating downward, as commodity and energy prices continue migrating upwards in this table. And what about the XAU? Someday, it may become this table’s top performer.
One thing the table above points out, the gold and silver miners are CHEAP. If there is one attribute investors should be searching for in any investment they are considering to buy, it’s whether or not what they are buying is cheap or expensive. I would say that in 2022; the XAU is cheap, while the stock market is expensive.
With the voters in the United States being very upset with the increases in consumer prices seen above, the Democrats passed their inflation legislation this week, with more than just a little help from the RINOs (Republican in Name Only) across the aisle in both the House and Senate.
The Republican’s called me this week asking for money. The story-line the caller was reading highlighted the damage the Democrats were doing to the country. Apparently, so I was told, the only thing that could stop the Democrats are the Republicans in Congress. I told the guy if that was true, we’re in deep trouble, as the Republicans in Congress are in bed with the Democrats, and I’m not sending money to anyone who voted for this “inflation legislation.”
Anyway, this inflation legislation intends to send gobs of dollars to only God knows where, including the IRS (the income tax bureau), to fund the recruitment of 86,000 ARMED AUDITORS the Federal Government will unleash upon the unsuspecting American people. That plus implementing these multi-trillion dollars acts of political patronage is no way to fight inflation.
This is a vicious act of legislation. These three-letter federal agencies created by Congress are out of control, and the insiders of the Deep State like it that way.
As far as inflation itself goes, this legislation reminds me of a quote by Pat Paulsen, when Paulsen ran for President in 1968 as a comical skit on the then very popular Smothers Brothers Show.
This line got a great applause in 1968. People back then understood the connection between deficit-spending by Washington and rising inflation. In 2022, with half the population now being “college educated”, maybe Paulsen could actually run for office on this promise, after all; the Democrats of 2022 are.
NYSE margin debt for July was published. Up by $13.34 billion dollars from June. Not much of an advance; but an advance just the same.
Anyone can have margin debt, if their stock broker lets them borrow money from the firm to buy additional shares of their favorite company. Margin debt enables investors to become speculators, to be able to buy $2 worth of stock with only $1 of their own money, the additional $1 borrowed from the broker.
If the market goes up, a 15% advance in the market becomes a 30% profit, a doubling of any gains seen in the market. But gearing one’s market risk via margin debt works for both up and down markets. A 15% decline in the market becomes a 30% loss for one’s margin account.
This is why NYSE margin debt rises in advancing markets, as retail investors love doubling their profits. This is also why NYSE margin debt declines in deflating markets, as leveraging one’s positions during a market decline is an excellent way to double your bear-market losses, something I don’t recommend. So, in down markets seasoned investors exit their margined positions, the sooner the better.
It’s said, when one gets a margin call, an order from your broker to transfer additional funds into a investors’ margin account to maintain the $1 (investor’s money) to $1 (broker’s money) minimum ratio, it’s best to order the broker to liquidate the position and return the borrowed funds to the broker. Face the fact; margin calls are something that happens in bear markets. Both in the general market, or the bear market in the company you bought on margin.
However, if an investor using margin debt refuses to sell in a market decline, and won’t transfer additional funds into their margin account, their broker will provide that service for them, liquidate their margined position whether they like it or not!
A market highly leveraged with margin debt, is a market at risk for forced selling into a down market. Keep that in mind as you examine the NYSE margin debt (Red Plot) below. During a really bad day in a market decline, a day where one wonders how far can the market go down before it closes, is most likely a day where brokers liquidated a good deal of margin debt. Institutional distressed selling into a down market, a day where the brokers are getting out at any price.
As is seen below, since January 4th’s Dow Jones’ last all-time high, investors and brokerages reduced their exposure to a market decline. I believe for good reason.
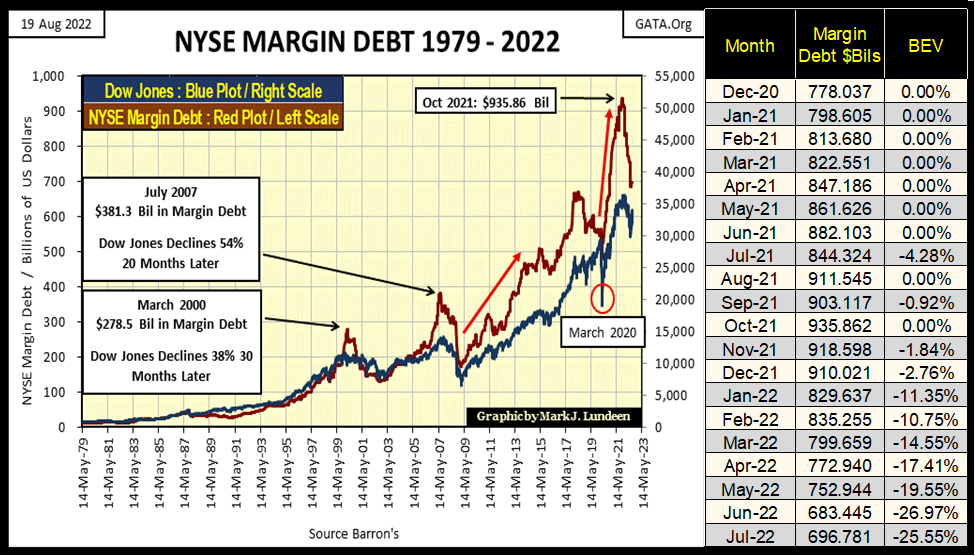
In the next few months, before November’s election, we may see some increases in margin debt. But will a late summer / autumn turn around in margin debt lead to a new all-time high in NYSE margin debt sometime in 2023? Grizzled old bear that I am, I doubt it.
Below is what happened to NYSE margin debt (Red Plot) during the Roaring 1920s Bull Market, and the following Great-Depression Crash. If you look at the values given in the table in the chart, it’s obvious the Dow Jones’ percentage gains of the 1920s, and its percentage losses of the following three years were echoed by similar gains and losses in margin debt. Without a doubt, the market trends during these two decades were driven by the flows of credit into, and then out of NYSE margin debt.
I take the Roaring 1920s bull market as being only a credit event funded by the then newly created Federal Reserve. The following 89% market decline in the Dow Jones during the depressing 1930s, was the NYSE deleveraging itself from the flow-of-credit from America’s new central bank. During the Great Depression Crash, the market was literally upchucking the dollars of credit it ingested during the 1920s bull market.
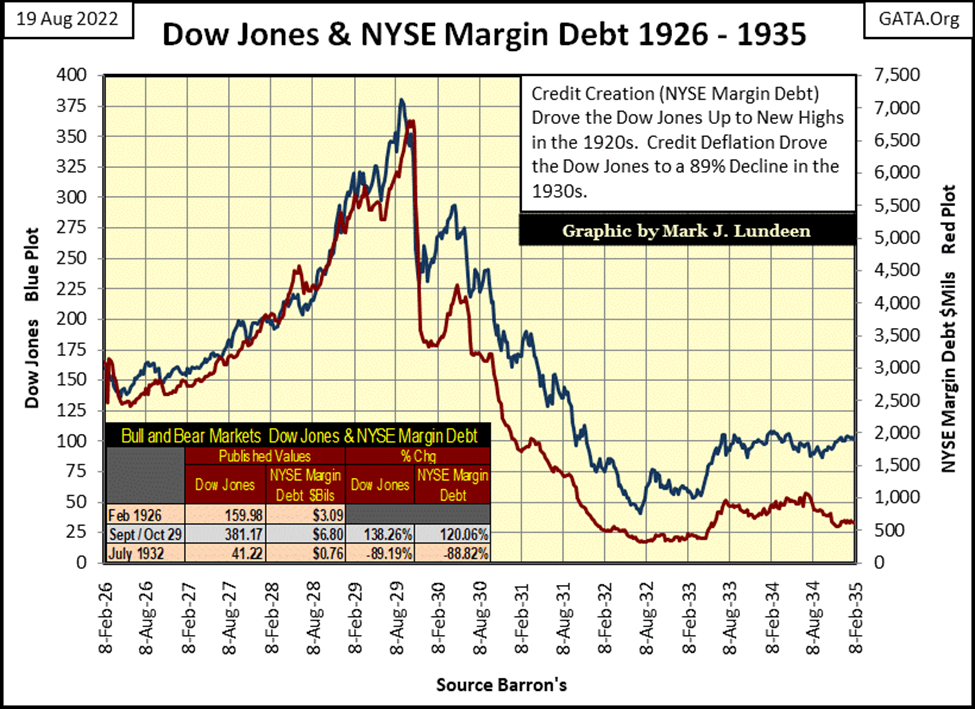
A century ago, Wall Street allowed margin accounts to be 10% investors funds, and 90% funds from their brokers. Way back then, before September 1929, that sounded reasonable, as brokers believed there is no safer loan than to a margin account; because the brokers could always sell the underlying securities if needed. Then came the Great Depression Crash, when to their horror, brokers discovered there were down days where the market had only sell orders. A day when distressed selling became impossible; for lack of bids at any price.
This same thing happened during the NASDAQ High-Tech Market Crash of 2000 to 2002. The NASDAQ too saw disorderly markets dominated with frantic investors attempting to sell into a market with no buyers. There were days where brokers stopped answering their phones. On October 7th 2002, the NASDAQ Composite was down 78%, as the NASDAQ 100 was down 83% from their bull market highs.
At the bottom the market was traumatized. As happened so many times in the history of Wall Street, investors, who at the market top were eager to buy at top dollar, a few years later refused to buy the same shares at a deep discount.
The secret of investing is to avoid risky situations that offer little chance for reward. Books are written on risk. I tried to read a few of them, but seemed to me to be a waste of time for someone like me; a little guy trying to make a buck in the stock market.
But how can someone identify a high-risk investment that has little chance of reward? It’s this simple; don’t buy after a company, or the general market has advanced several hundred percent over a course of years or decades. Buying at the top, when everyone else is, is a mug’s game retail investors will never win. Much better to wait, and buy after a significant market decline, the bigger the better, when all around you is pain and suffering from the market crash, when people will willingly sell you for a dime, what they purchased a dollar for.
For the broad market, the best way to do that is to follow the dividend yield for the Dow Jones. From 1925 to 1987, buying stocks when the Dow Jones was yielding something over 6% meant buying near to a bear-market bottom. Selling when the Dow Jones dividend yield had fallen down to 3% meant selling near to a bull market top.
For decades, using Dow Jones dividend yields, to mechanically buy and sell market positions, was a supremely simple method of risk management.
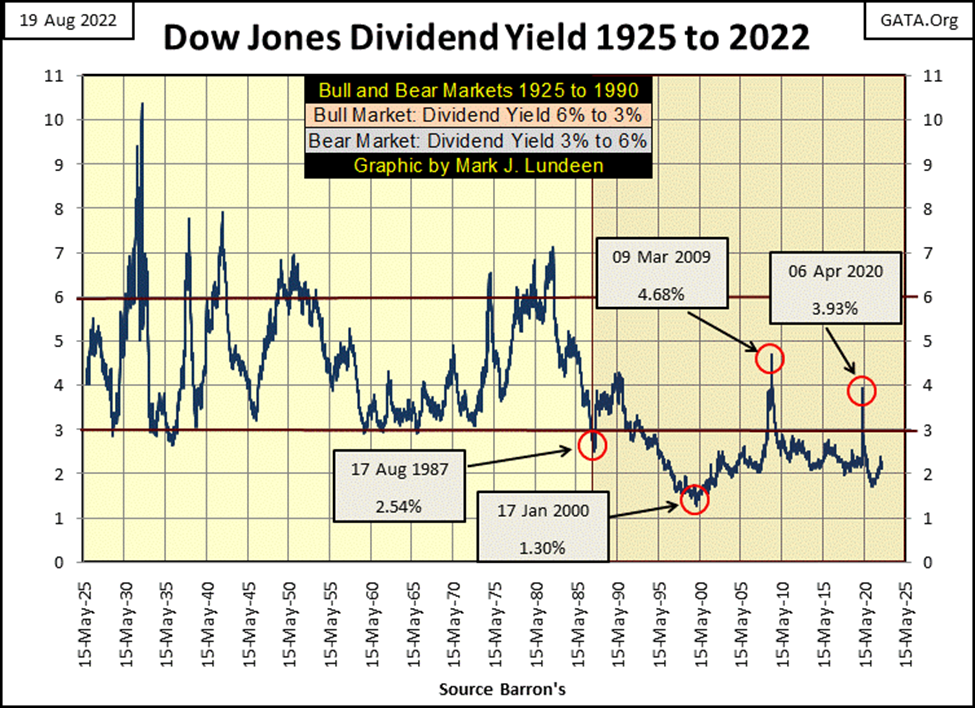
But all that changed in August 1987, when Alan Greenspan became Chairman of the Federal Reserve. In August 1987, the Dow Jones was yielding a historically low 2.54%, and so time to sell! But Greenspan wasn’t going to allow a bear market on his watch. So, with his “injections-of-liquidity” into the financial system, he inflated a bubble in stock-market valuations that continues to this day, as seen in the unnaturally low dividend yield for the past three decades above.
Since 1993, the only times the Dow Jones yielded over 3% were at the bottoms of the sub-prime mortgages bear market in March 2009, and at the bottom of the March 2020 flash crash. For both of these bear market bottoms, the Dow Jones never saw a yield above 6%, because the FOMC “injected” massive amounts of “liquidity” into the market, thus terminating these bear markets prematurely.
Can the FOMC thwart Mr Bear for the third time, prevent him from achieving a Dow Jones dividend yield of something greater than a 6% dividend yield? I don’t believe the idiots can. So, I choose to stay out of this market until I see the Dow Jones with a dividend yield of something above 6%, maybe even an 8% yield.
With the Dow Jones dividend payout at the close of this week at $707.84, yielding 2.10%, its valuation was fixed at 33,706. But, to make the Dow Jones yield 6% with its current payout of $707.84, its valuation would have to deflate to 11,797, a 68% market decline from the Dow Jones last all-time high (36,799). To make the Dow Jones yield 8%, its valuation would have to decline to 8,848, a 76% market decline from the Dow Jones last all-time high.
Should the dividend payouts also decline, which during big-bear market they always do, these bear market percentage declines become really grizzly should dividends for the Dow Jones once again normalize as they were before 1987. Which I believe they will once the idiot savants from the FOMC remove their meat hooks from the financial markets’ daily operations, to once again allow the markets natural forces of buying and selling fix market valuations.
But these big market declines I’m anticipating haven’t begun yet. The NYSE 52Wk H-L Nets in the past two weeks have seen some positive values in the table below, or more 52Wk Highs than Lows at the NYSE. Like Congress, and President Biden, it seems Mr Bear is also taking his summer vacation.
Moving on to gold’s BEV chart below, gold once again closed below its BEV -15% line. It could be worse, having gold close below its BEV -20% or -25% lines. My recommendations for gold and silver for the foreseeable future? Okay; some more hurry up and waiting is still required for precious metal assets.
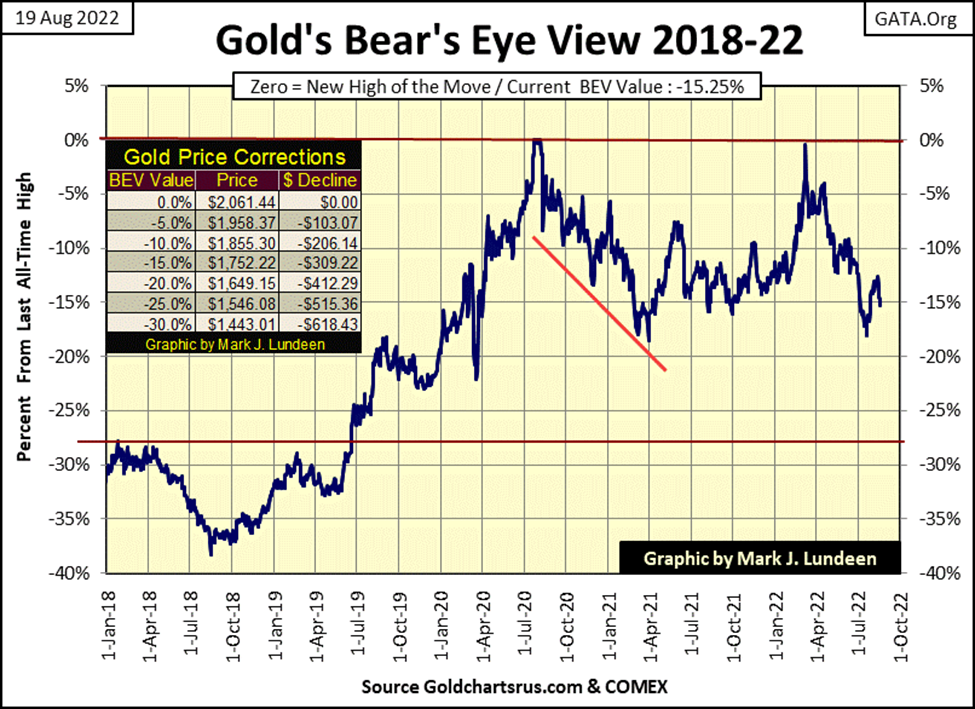
But as pointed out earlier, it’s important buying an investment when it’s cheap. And an investment appears to be cheap because most of the investing public doesn’t what it, at that time.
Right now, gold and silver bullion, as well as the companies that mine these precious metals are not popular in the minds of most investors. In the years to come that will change as financial market valuations in stocks, bonds and real estate begin to deflate. In the pending bear market on Wall Street, you’ll be happy to have a position in precious metal assets, no matter how pointless they may seem now.
I’m skipping my step sum charts for gold and the Dow Jones this week. Until something happens in the market, they bore me to tears. So, I’m jumping down to their step sum tables below, as this week we saw some interesting market action.
Specifically, gold was down each day this week. Look at all that red. I can’t see into the future, but I suspect we’ll see more selling coming from the floor of the COMEX gold and silver futures markets. As always, expect some up days in a down market. But it would be nice seeing gold becoming oversold. A 15-count of -9 would provide a good floor for gold to see a strong rebound back above $1800 in the weeks, or maybe months to come.
With that monstrosity of an inflation legislation passing this week, the COMEX goons made sure gold and silver didn’t do anything to embarrass Congress. Something like seeing gold boldly breaking above, and then staying above last week’s close at $1800.
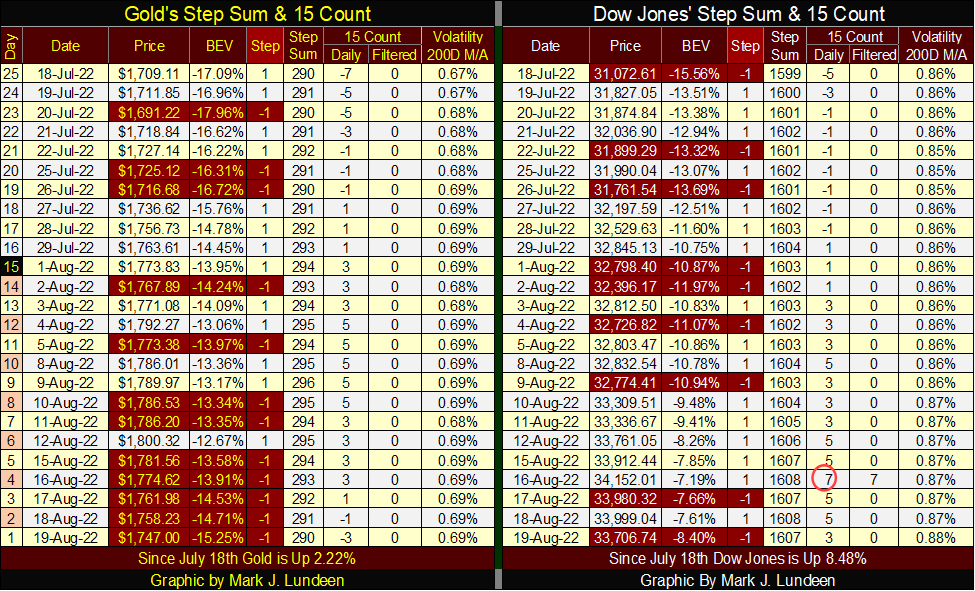
The Dow Jones is going up. Since July 18th its advanced 8.48%.
On Tuesday, its 15-Count increase to a +7, which is an overbought market. Late in the week the market took care of that with two down days. Friday saw the Dow Jones shed almost 300 points; it seemed like a big down day. But from Thursday’s close, Friday was down by only 0.86%, far from being one of those dreaded Dow Jones 2% that are a hallmark of a bear market.
From what I can see, in the near-term future I’m expecting more downward pressure on the price of gold, as the Dow Jones continues rising as the November elections draw near.
Am I right? We’ll all know more next week.
—
(Featured image by Adam Nowakowski via Unsplash)
DISCLAIMER: This article was written by a third party contributor and does not reflect the opinion of Born2Invest, its management, staff or its associates. Please review our disclaimer for more information.
This article may include forward-looking statements. These forward-looking statements generally are identified by the words “believe,” “project,” “estimate,” “become,” “plan,” “will,” and similar expressions. These forward-looking statements involve known and unknown risks as well as uncertainties, including those discussed in the following cautionary statements and elsewhere in this article and on this site. Although the Company may believe that its expectations are based on reasonable assumptions, the actual results that the Company may achieve may differ materially from any forward-looking statements, which reflect the opinions of the management of the Company only as of the date hereof. Additionally, please make sure to read these important disclosures.


Ecobnb Turns Sustainable Tourism Into Measurable Impact
Ecobnb’s sustainable tourism platform generated significant environmental and social impact in 2025, avoiding 58,207 kg of CO₂ and adding 583...


Sugar Markets Balance Biofuel Demand and Global Supply
Sugar markets in New York and London were mostly unchanged as the Iran conflict renewed interest in biofuels. Drought concerns...


The $40 Trillion Trap: Disinflation Is Not Deliverance
U.S. debt has reached $40 trillion, with $24 billion weekly interest, while deficits accelerate. Despite disinflation in CPI, from cooling...


FinTech Matures as AI and Infrastructure Drive the Next Growth Phase
Fintech markets are entering a mature phase, shifting from rapid growth to consolidation, specialization, and sustainable business models. Zurich and...


Bitcoin, and Ethereum Rise, While Cardano Enters Transition
Bitcoin and Ethereum posted modest weekend gains, supported by ETF inflows. A new proposal may protect Bitcoin from quantum threats....
 |
|
 |  |
 |
|
-

 Crypto1 week ago
Bitcoin Rally Faces Tests from Fed, ETFs, and Market Fear
-

 Impact Investing2 weeks ago
Milione Secures €80M EIB Financing to Drive Venice Airport’s Green Transformation
-

 Biotech4 days ago
Legend Biotech: Growth Driven by CAR-T Innovation and Carvykti Expansion
-

 Impact Investing2 weeks ago
ECB Adds Climate Risk Factor to Collateral Rules