Business
The stock market continues its wild ride
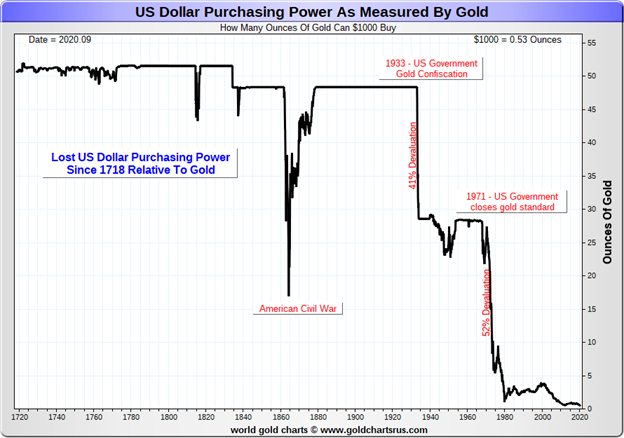
Is the U.S. Rome? We ponder the question as we look at the long term loss of purchasing power of the U.S. dollar vs. the long term deterioration and debasement of the currency of Ancient Rome. Massive spending, huge deficits, constant wars including civil, policing the world, trade wars and sanctions are all signs of an empire in decline. Just ask Rome.

While we fully admit that former Fed Chair Paul Volcker does have a point about price stability under a gold standard, the question begs: does anyone really wish to return to the living conditions of the 17th to 19th centuries? The value of the U.S. dollar in 1700 was worth 63 more times than it is today. Since the average wage of an unskilled worker in 1700 and even up to about World War I was roughly $1/day, that would mean that a worker today would have to earn $63/day to be the equivalent of $1 back in 1700. $63 works out to over an 8-hour day to $7.88. The minimum wage in much of the U.S. today is $7.25. Back then, people generally lived in large groups under one roof. As well, the population was largely rural (60%) rather than urban (40%). Children worked from an early age onward. It took until 1929 for children under the age of 14 to be legally fully excluded from working in factories and mines. The more things change the more things remain the same, but, thankfully, some things do change.
The purchasing power of the dollar has been in a downward spiral since the advent of the Federal Reserve in 1913. An item that cost $100 in 1913 would today cost $2,656.71 (all figures are U.S. dollars). Or, to put it another way, that $100 in 1913 is worth only $3.76 today. But an ounce of gold in 1913 was $20.67. Today, that ounce of gold would have to be $537 to be the equivalent of 1913. But gold is trading over $1,700 or $64 in 1913 money. Some things do maintain their purchasing power, and then some.
In the absence of the gold standard, there is no way to protect savings from confiscation through inflation […] Deficit spending is simply a scheme for the “hidden” confiscation of wealth. Gold stands in the way of this insidious process. It stands as a protector of property rights.
—Alan Greenspan, American economist, served five times as Chair of the Federal Reserve 1987–2006; b. 1926
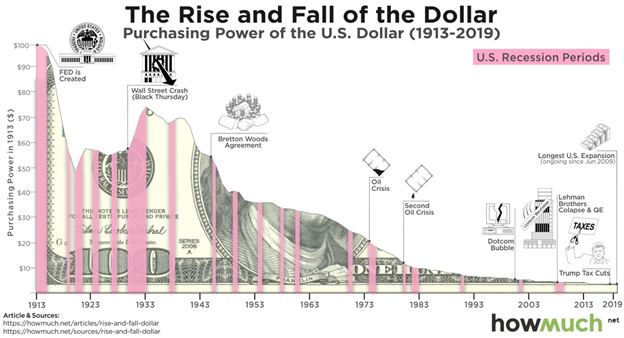
For the U.S. dollar, over the past century and even going back three centuries, its purchasing power has been mostly falling, not rising. At the same time as the purchasing power of the U.S. dollar has been falling, the value of the U.S. dollar relative to other currencies has also been falling.
U.S. Dollar Index 1971 – Present
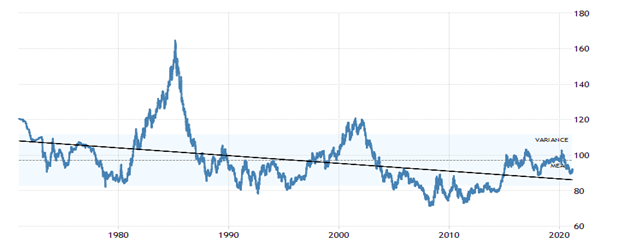
In 1971, the US$ Index was at 120. It peaked in 1985 at 164.72. Today it is at 91.50 and falling—a decline of 23.8% from 1971 and 44.5% from the 1985 peak. When you combine this with the loss of purchasing power of the U.S. dollar, the decline has been considerable. Since 1971 the purchasing power of a $1 has fallen by 84.6%. Meanwhile, the price of gold has gone from $40.80 in 1971 to over $1,700 today for a gain of over 4,000% and silver has gone from $1.80 to $26 for a gain of over 1,300%. In 1971, prices for today’s gold would have been $262 and for silver, $4.
The loss of purchasing power and decline in the value of the U.S. dollar reminds one of another era. It reminds us that a collapse does not take place overnight but instead over decades, even centuries and it is steady and insidious.
The Collapse of the Roman Silver Monetary System 280 BCE – 518 AD
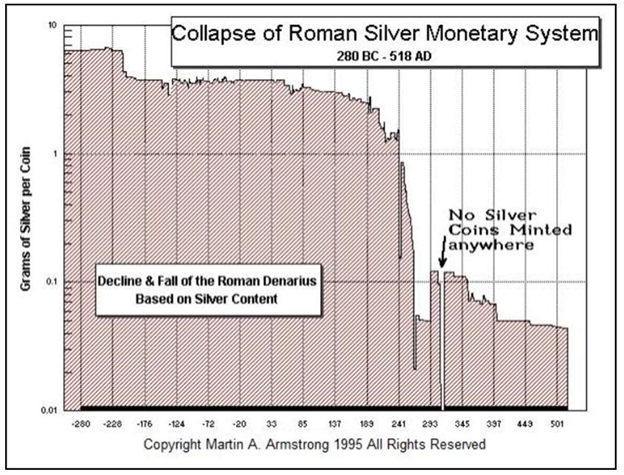
During the early years of the Roman Republic the silver denarius was the main coin of trade, the reserve currency of its day. The coin, about the size of a nickel or dime, was a day’s wages for a skilled labourer or craftsperson. The coin was of high purity and held roughly 4.5 grams of pure silver or about .145 troy ounces. Today, that silver denarius is worth roughly $3.75 in silver content. However, there was only a finite amount of gold and silver and, as the Roman Republic turned into Imperial Rome, the ability to pay for the wars, palaces, roads, and more was compromised. The solution: decrease the amount of silver in the coins so one can issue more. It was today’s equivalent of printing money. By the time of Marcus Aurelius (161–180 AD), the silver content was down to 75%. By the time of Gallienus (260–268 AD), the silver content was down to 5%. Not long after, the silver content fell to 0.5% and prices soared by upwards of 1,000%.
The third century was known for the collapse of the Roman Empire. The decline was underway following the death of Marcus Aurelius (161–180 AD) and the Antonine Plague (165–180 AD). The plague was said to have killed 2,000/day. The plague killed millions, including soldiers and tradespeople in an original population estimated at around 130 million. Severely weakened, the empire degenerated into soldier emperors and civil wars. The silver denarius effectively became no more in 215 AD under the emperor Caracalla (198–217). The replacement coin was the antoninianus which was initially silver and bronze. An antoninianus was worth two denarii. But the debasement continued until eventually it was made of bronze but washed with silver.
The third century was in constant crisis. There were an estimated 50 different emperors, most of whom were murdered, assassinated, or killed in battle. Adding to the misery was a second plague known as the Plague of Cyprian in 249 – 262 AD. Again, millions were killed estimated at its height, averaging 5,000/day. The plague caused widespread manpower shortage of the army and for food production. It severely disrupted trade which was the lifeblood of the empire. Trade networks disintegrated as movement became too dangerous with not enough manpower to patrol the routes. There were constant attacks by Barbarians. The period was also marked by civil wars and economic depression. Rome, whose population peaked at over one million in the 2nd century went into long decline eventually falling to about 20,000 over the next three centuries.
Imperial Rome was also heavily built on slavery and it failed to adjust to the realities of a collapsing population, coupled with the attacks from Barbarians to the north. By the time of the emperor Diocletian (284–305 AD), the empire was split into two: the Eastern Empire in Byzantium (Constantinople) and the Western Empire in Milan. Before the split there had already been the breakaway Roman Gallic Empire in 260-274 AD that included Gaul (France), Germania (Germany), Britannia (Britain), and for a time Hispania (Spain).
Despite an attempt by Diocletian to reform the monetary system, the debasement of the currency continued to the point that even the antoninianus didn’t exist. So-called silver coins were now just copper or had only a thin coating of silver. Copper coins were often spiked with tin or zinc. Diocletian tried to reform the monetary system and introduced the silver argentus. But it too was quickly cut. The bronze folis became the coin of choice. The gold aureus also disappeared and was replaced by the gold solidus which was smaller. The gold solidus became recognized as the main means of trade. The Eastern Empire managed to fortify itself against the Barbarians but the Western Empire continued its disintegration and by 476 AD it ceased to exist. The Eastern Empire which became the Byzantine Empire continued to exist in some form until 1453 when it was overwhelmed by what became the Ottoman Empire.
To give this some perspective, a Roman soldier in the 1st century BCE was paid 225 denarii/year or roughly 30.7 troy ounces of silver. In today’s money with silver at $26 that is worth about $800/year. By the time of Domitian (81–96 AD) it was raised to 300 denarii which at the time would be worth about 972 grams of silver or 31.3 troy ounces of silver. The silver content in the denarii had also fallen to about 75% of what it was earlier. For the Roman soldier that was still only just over $800/year in today’s money. Today, the average U.S. soldier is paid roughly $61,000/year, although those starting out earn at least $24,000/year. For the average soldier that would purchase 2,346 troy ounces of silver. Today’s soldier by comparison is paid better than the average Roman soldier.
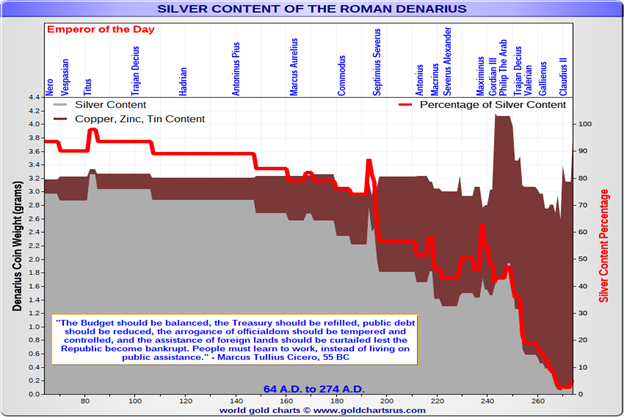
Here is another look at the collapse of the Roman denarius. Compare that with the chart that follows of the long-term debasement of the U.S. dollar in terms of gold. Again, the comparisons are stark. The denarius was the reserve currency as is the U.S. dollar today. The U.S. dollar as a reserve currency has been around for at least 100 years since World War I, although officially since the end of World War II. But a few common factors stand out as to why reserve currencies fail. They are the result of a massive increase in spending, creating deficits, accumulation of debt, easy credit, and the collapse of free trade through either trade wars or sanctions. All are present today in the U.S.
U.S. debt, as measured just by government debt alone, has expanded at an incredible rate. Today it stands at over $28 trillion. Percentage-wise, the largest increases came under former presidents Roosevelt (Great Depression and World War II), Woodrow Wilson (World War I), and Ronald Reagan (failure of supply side economics and massive increase in military budget). Dollar-wise it grew the most under Barack Obama as a result of the fallout from the 2008 financial crisis. Percentage-wise though, the growth under Obama was behind the percentage growth by his predecessor George W. Bush. Total U.S. debt, including household and corporate debt, stands at over $82 trillion, representing roughly 30% of all the debt outstanding in the world and an incredible 382% of GDP. In 1980 that figure stood at 177%.
Monetary Debasement
Today in the U.S. there are more people on assistance—i.e., disability, unemployment, Medicaid, food stamps (est. over 150 million)—than there are people who work full-time (est. 125 million). 36 million or about 11% of the population are considered to live in poverty. Other calculations put it at around 18%. Add in the working poor and the number rises to about 30%. An estimated one in four works in a job paying less than $10/hour. Income inequality is one of the biggest issues facing the U.S. and many other countries today. With a Gini-coefficient potentially as high as 0.51 in the U.S., the gap between the rich and poor is as high as it has ever been. The Great Depression and World War II was the equalizer the last time which helped lower the gap between the 1% and the rest. But that period was punctuated by the rise of populism and created deep splits in societies that were exploited by groups like the Nazis.
Against this backdrop, thanks to QE and record low-interest rates, the stock market keeps on rising. The K recovery: Wall Street up, Main Street down. Many are expecting a sharp recovery once people are vaccinated and can get out to spend again. But history tells us we don’t go back. Plagues, money debasement, and civil wars have a way of changing things. Just ask Rome.
The Pandemic Rages On!
Another week, another 3 million cases and 60 thousand plus dead. At least we have slowed down as t one point we were well over 5 million cases every week. The 7-day average is now 422 thousand vs. 741 thousand at the peak. Deaths have dropped to about 8,500/day vs. over 14 thousand/day at the peak. The U.S. has crossed 30 million cases and is approaching 550 thousand dead. The U.S. has 25% of the cases and over 20% of the deaths with only about 4% of the world’s population. Canada is now over 900 thousand cases and 22 thousand dead. Canada’s cases and deaths per million are higher than the global average but not substantially. The U.S. is amongst the highest (top 10) for both cases and deaths/million. Personally, we have only known one person who contacted the disease. Yet despite it being mild and he quickly recovered he complains of constant fatigue to this day.
Sunday March 14, 2021 – 14:24 GMT
World
Number of cases: 120,167,554
Number of deaths: 2,661,539
U.S.A.
Number of cases: 30,044,060
Number of deaths: 546,617
Canada
Number of cases: 906,201
Number of deaths: 22,434
Source: www.worldometers.info/coronavirus
Chart of the Week
Canada’s Job Numbers
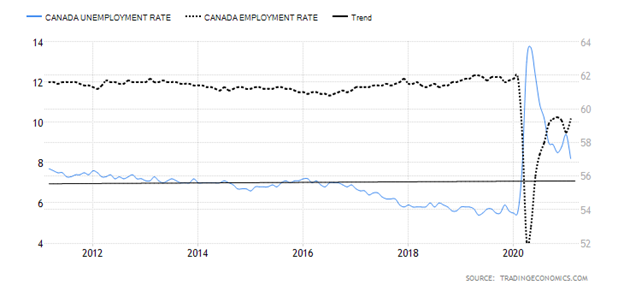
Canada’s economy unexpectedly created 259,000 jobs in February. This was well above the expected gain of 75,000. It follows a 266,000-job loss in January. Both part-time and full-time benefitted with part-time rising 171,000 and full-time up 88,000. Given the loss of 3,004.5 thousand jobs in March/April 2020 Canada has now recouped 2,421.7 thousand jobs or 80.6% of those lost. It’s a record that surpasses the U.S. who has only recouped 57.6% of the 22,362 thousand jobs that were lost last March/April 2020.
Canada’s unemployment rate fell to 8.2% in February, the lowest level since March 2020. It was 9.4% in January. While admittedly this level is higher than in the U.S., keep in mind Canada’s labour force participation rate is 64.7% vs. 61.4% in the U.S. With higher labour force participation rate, it stands to reason that our unemployment rate would also be higher. A lower participation rate reflects the number who have dropped out of the labour force or are no longer counted. The R8 unemployment rate was 12.2% in February vs. 13.3% in January. The R8 rate is similar to the U.S.’s U6 rate as it includes discouraged job searchers plus involuntary part-timers. The U.S. U6 rate is 11.1% but when long term discouraged workers who are no longer considered a part of the labour force are counted the rate rises to 25.8% according to Shadow Stats (www.shadowstats.com). We have no comparable figure for Canada.
In February there were 1,665.1 thousand people unemployed, down from 1,899.0 thousand in January. The employment rate rose to 59.4% in February vs. 58.6%. Job gains were primarily seen in the services sector, up 306.2 thousand with the biggest jump coming in wholesale and retail trade as things opened up. Accommodation and food services also gained. The goods producing sector gained 3,100 jobs. Of those working part-time, some 23.8% wanted full-time work, up from 18.5% 12 months ago.
The jobs created in February were largely jobs paying less than $17.50 an hour, a rate barely above the minimum wage of $14.25. Ontario gained 100,000 jobs and Quebec was up 113,000 jobs as restrictions eased. Youth unemployment (15–24) fell to 17.1% as the number of jobs grew by 100,000. Employment losses for women over the past year are double that for men. Youth have also suffered more than the core working age of 24–54. The number of hours worked rose 1.4%, thanks to the gains in wholesale and retail trade. Overall, part-time workers are down 264,000 since last February and full-time jobs are down 335,000. Private sector employment rose 226,000 while government sector was up 46,000 in February. As things opened up, some 600 thousand returned to working in places other than their homes.
Labour underutilization remains a problem—meaning, people who are unemployed, want a job, but have given up looking as they are finding nothing. The group includes job searchers, those on temporary layoff, those wanting a job but not looking, and those who were employed but working only a fraction of their usual hours. The underutilization rate is 16.6% which is the lowest since last February.
The market is viewing this report as positive. TD Bank economics said “Wow, what a bounce-back.” The Canadian dollar rose to just past 80 cents Friday, the highest level seen since 2017. Economists are calling this a quick turnaround like what happened last June and July 2020. Canada reported GDP growth of 2.3% in Q4, although for the year as a whole GDP contracted 3.2%. The BofC will also view this as positive. The question on everyone’s mind is, what if there were a third wave?
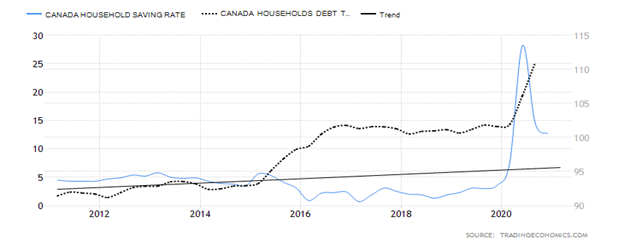
Overall, we view this report as encouraging and it should improve further as vaccinations occur and things open. There is a big belief out there that pent-up savings will get spent. But after a year of lockdowns and more, the suspicion is that many will be happy to pay down debt and build a better cushion in the bank. Canada’s household debt to GDP is an astounding 111.0%, one of the highest in the world as Canadians have gorged themselves on mortgages to chase houses. Note the chart below that shows personal savings falling from its highs but the household debt to GDP soaring. The personal savings rate is 12.7% in Q4 vs. 14.6% in Q3. Canada’s household debt to GDP at 111% compares very unfavourably with the U.S. at 78%. The personal savings rate is also lower.
Household Personal Savings and Household Debt to GDP.
MARKETS AND TRENDS
| % Gains (Losses) Trends | ||||||||
| Close Dec 31/20 | Close Mar 12/21 | Week | YTD | Daily (Short Term) | Weekly (Intermediate) | Monthly (Long Term) | ||
| Stock Market Indices | ||||||||
| S&P 500 | 3,756.07 | 3,934.43 (new highs) | 2.4% | 4.8% | up | up | up | |
| Dow Jones Industrials | 30,606.48 | 32,778.64 (new highs) | 4.1% | 7.1% | up | up | up | |
| Dow Jones Transports | 12,506.93 | 14,156.69 (new highs) | 3.9% | 13.2% | up | up | up | |
| NASDAQ | 12,888.28 | 13,319.86 | 3.1% | 3.4% | down (weak) | up | up | |
| S&P/TSX Composite | 17,433.36 | 18,851.32 (new highs) | 1.8% | 5.4% | up | up | up | |
| S&P/TSX Venture (CDNX) | 875.36 | 982.25 | 7.0% | 12.2% | neutral | up | up | |
| S&P 600 | 1,118.93 | 1,397.66 (new highs) | 7.3% | 24.9% | up | up | up | |
| MSCI World Index | 2,140.71 | 2,225.78 | 3.1% | 4.0% | up | up | up | |
| NYSE Bitcoin Index | 28,775.36 | 56,852.92 (new highs) | 18.2% | 97.6% | up | up | up | |
| Gold Mining Stock Indices | ||||||||
| Gold Bugs Index (HUI) | 299.64 | 271.11 | 3.5% | (9.5)% | down (weak) | down | up | |
| TSX Gold Index (TGD) | 315.29 | 285.78 | 2.0% | (9.4)% | down | down | up | |
| Fixed Income Yields/Spreads | ||||||||
| U.S. 10-Year Treasury Bond yield | 0.91 | 1.63% (new highs) | 4.5% | 79.1% | ||||
| Cdn. 10-Year Bond CGB yield | 0.68 | 1.57% (new highs) | 4.7% | 130.9% | ||||
| Recession Watch Spreads | ||||||||
| U.S. 2-year 10-year Treasury spread | 0.79 | 1.48% (new highs) | 4.2% | 87.3% | ||||
| Cdn 2-year 10-year CGB spread | 0.48 | 1.25% (new highs) | 4.2% | 160.4% | ||||
| Currencies | ||||||||
| US$ Index | 89.89 | 91.68 | (0.3)% | 2.0% | up | down (weak) | down | |
| Canadian $ | 0.7830 | 0.8020 (new highs) | 1.5% | 2.4% | up | up | up | |
| Euro | 122.39 | 119.57 | 0.4% | (2.3)% | down | up (weak) | up | |
| Swiss Franc | 113.14 | 107.63 | 0.2% | (4.9)% | down | down | up | |
| British Pound | 136.72 | 139.28 | 0.6% | 1.9% | down (weak) | up | up | |
| Japanese Yen | 96.87 | 91.72 | (0.6)% | (5.3)% | down | down | neutral | |
| Precious Metals | ||||||||
| Gold | 1,895.10 | 1,719.80 | 1.3% | (9.3)% | down | down | up | |
| Silver | 26.41 | 25.91 | 2.5% | (1.9)% | down | up (weak) | up | |
| Platinum | 1,079.20 | 1,200.30 | 6.4% | 11.2% | up (weak) | up | up | |
| Base Metals | ||||||||
| Palladium | 2,453.80 | 2,359.40 | 1.4% | (3.9)% | neutral | up (weak) | up | |
| Copper | 3.52 | 4.14 | 1.5% | 17.6% | up | up | up | |
| Energy | ||||||||
| WTI Oil | 48.52 | 65.61 | (0.7)% | 35.2% | up | up | up | |
| Natural Gas | 2.54 | 2.60 | (3.7)% | 2.4% | down | up (weak) | neutral |
New highs/lows refer to new 52-week highs/lows and in some cases all-time highs.
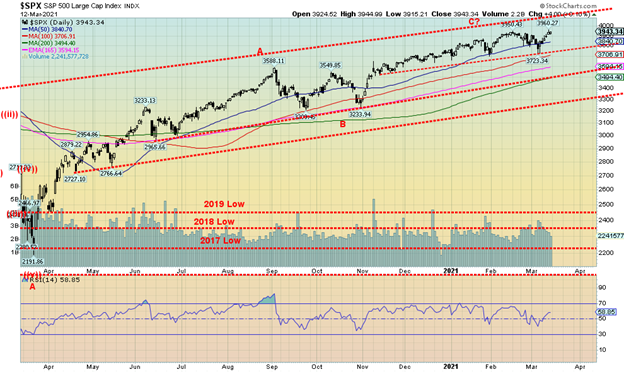
The bull market has returned. Okay, it never left. It was just having the pause that refreshes. The markets continue to look as if they are going to go higher. The signing of the $1.9 trillion rescue package has buoyed the bulls. We have QE to infinity. We have record low interest rates even if inflation expectations have pushed the 10-year to 1.64%. At its low the 10-year was down to 0.52%. That was in August 2020. Since then, it has tripled. Eventually, rising interest rates feed their way into the economy and sparks a problem in the bond market. Then the stock market could correct. In the interim, barring an accident, the market should keep going higher.
This past week the S&P 500 hit new all-time highs rising 2.4%. But it was the Dow Jones Industrials (DJI) and the Dow Jones Transportations (DJT) that were the big stars, up 4.1% and 3.9% respectively with both making new all-time highs. The NASDAQ is now the laggard as it gained 3.1% but did not make new all-time highs. Value now takes precedence over growth. The TSX Composite joined the party, making new all-time highs by rising 2.6%. The TSX Venture Exchange (CDNX) did not make new highs but still gained almost 7%. The small cap S&P 600 did make new all-time highs, rising 7.3%.
But if we want a real superstar, Bitcoin again soared to new all-time highs, up 18.2% on the week and now up 97.6% on the year. The coming week promises to be another record as the weekend saw Bitcoin hit $60,000, making it once again a trillion-dollar entity. Dogecoin is back over $7.5 billion market cap.
Elsewhere in the world, the MSCI World Index rose 3.1%. In the EU, the London FTSE was up 1.4% while the Paris CAC 40 and the German DAX both made new all-time highs, rising 4.6% and 4.2% respectively. In Asia, China’s Shanghai Index (SSEC) rose 1.4% and the Tokyo Nikkei Dow (TKN) was up about 3.0%. Neither made new highs.
The U.S. has now surpassed 100 million needles into arms and it is the optimism surrounding the potential end to the COVID that has everyone pumped. The expectations are high. Possibly too high and that makes us a bit cautious, particularly as the indices are bouncing once again up against the tops of channels. Okay, maybe the markets don’t soar but instead just crawl up the bull channels. That is ideal as they don’t become too overheated that way. They certainly won’t become overheated because of volume because volume, if anything, has been contracting. Still, the advance-decline is rising even if the volume is tepid. The indices are confirming each other as well with both the DJI and DJT making new all-time highs together. The S&P 500 is as well and the index could soon hit the magic 4,000 where we are sure we’ll experience a wave of euphoria. But even the small caps are rising as noted with the S&P 600 and the Russell 2000 both making all-time highs in line with the big cap market. And that is bullish.
We are approaching March 23: the one-year anniversary of the impulsive pandemic collapse of March 2020. So instead of a low we could be making a high—it might be a date to watch to see what the action is. Bullish sentiment is high but off its highs. We note further the put/call ratio is very bullish once again. Indeed, it is difficult finding a bear alive anywhere. Are they an endangered species? Or just in a long hibernation? As long as the monetary and fiscal authorities keep pumping out the money, we have difficulty thinking of a drop of any substance. For sure no taper tantrum appears to be on the horizon. Which is why we say QE to infinity. Debt levels be damned. Okay, that’s fine for governments, but corporations and households actually have to pay their debt back. However, that hasn’t stopped the lenders who keep shovelling money at zombie companies. One only needs to look at these spreads to treasuries: AAA 0.56%, BBB 1.26%, CCC 6.79%. Briefly in March 2020, at the height of the pandemic panic, the spreads were AAA 1.84%, BBB 4.74%, and CCC 19.47%. Tellingly, the CCC spread is as low as it has ever been in the past 30 years. Complacency reigns. But what does one expect with $1.9 trillion packages, and $120 billion bond purchases per month? QE to infinity and endless all-time highs.
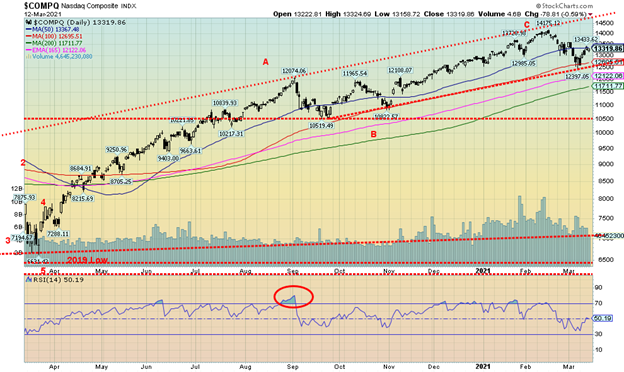
The NASDAQ is the odd man out. It did not make new all-time highs this past week. However, we wouldn’t be surprised if it happens again soon. The NASDAQ gained 3.1% this past week. The big tech FAANGs continue to struggle. Facebook gained 1.6% but Apple fell 0.3%. Amazon jumped almost 3.0% but Google lost 2.2%. Netflix struggled to a 0.3% gain. Tesla recovered, gaining 16.1% while Twitter was up 1.7% and Microsoft gained 1.8%. They all wish they could be Berkshire Hathaway, the ultimate value stock, up 3.1% to new all-time highs. The NASDAQ has struggled back to the 50-day MA. A firm break above 13,600 could start it on its way to new all-time highs. But it remains a bit away at 14,175. The NASDAQ tested the 100-day MA near 12,700 but the area held. Major support is down at the 200-day MA near 11,700. The RSI is a neutral 50 so NASDAQ could go either way from here. Volume has not been impressive on this return effort so it could just be a corrective rebound. Our expectation is that, going forward, the NASDAQ will be a follower rather than a leader. The DJI appears to be assuming the leader’s role.
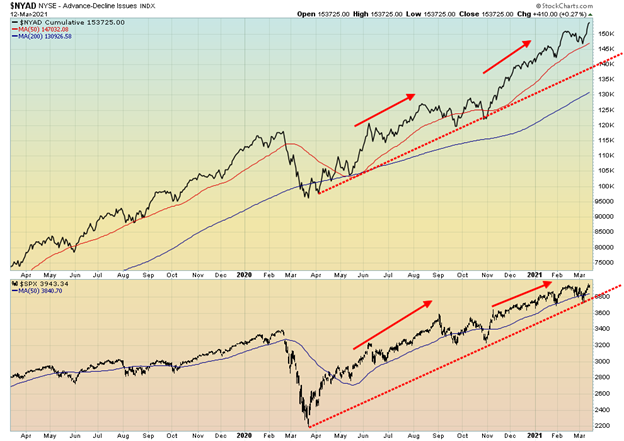
There seemed to be a wiggle a few weeks ago that the NYSE advance-decline line was falling even as the S&P 500 kept rising. But if it was a wiggle or a temporary divergence, it’s gone now and the AD line is making new highs with the S&P 500. All is well. We are in-line together.
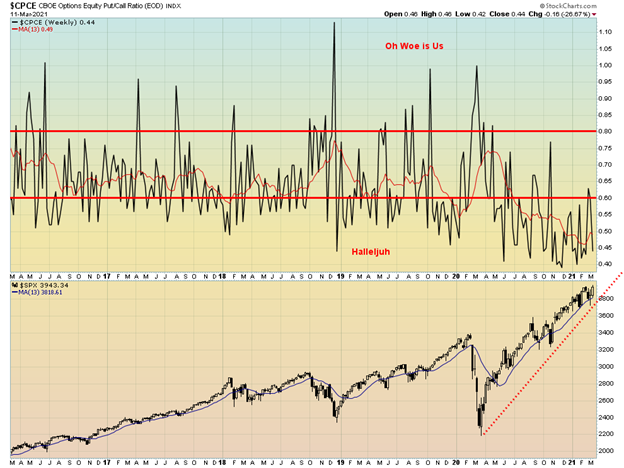
Hallelujah. Happy days are here again with the put/call ratio back at 0.45. Bearish sentiment? Pffft! Onward and upward, it seems. No one seems to be too concerned that we have never seen the put/call ratio remain below 60 (okay, briefly over) for such a prolonged period of time. Nothing, it seems, knocks this market off. Yes, it’s a warning sign. And many will run right through the warning sign. Others will proceed with caution. Endless liquidity (QE to infinity, ultra-low interest rates, $1.9 trillion packages) will make any market rise. Jeez, even GameStop was up 92% this past week to $264.50. Incredible.
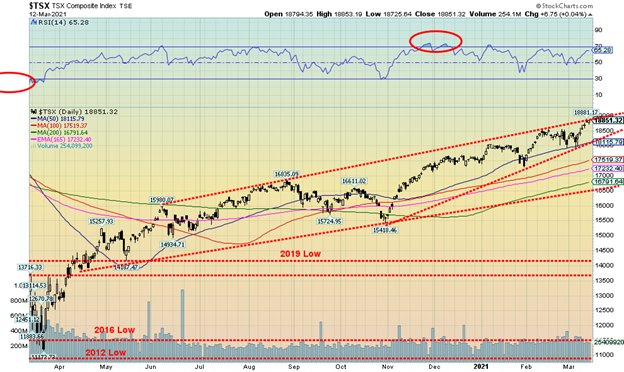
Another week and another record high for the TSX Composite. Yes, the TSX made history again with another all-time high at 18,881. The highlight, though, was tempered by the fact that the TSX hit the top of a bull channel so a pullback might be expected. Everybody went along for the ride as all 14 sub-indices were up on the week led by Health Care (THC), up 8.1%. Other notable gains were Information Technology (TKK) regaining some glitter, up 3.6%, and Energy (TEN) chugging ever higher, up 4.0%. 52-week highs were seen for Income Trusts (TCM – up 2.4%), Consumer Discretionary (TCD – up 2.6%), the forementioned TEN, Financials (TFS – 2.8%), Industrials (TIN – up 1.4%), Real Estate (TRE – up 2.0%). Both the TSX and its big cap version the TSX 60 made new all-time highs. The TSX Venture Exchange (CDNX) gained almost 7.0% but did not make fresh 52-week highs. The TSX, as noted, is at the top of a bull channel. Major support is currently down to 18,000/18,100. The TSX is a long way from a major breakdown which would come under 16,500. The TSX continues to rise in what appears as an ascending wedge. We have to be aware of the risk that a breakdown could come, given we are a way into the triangle. The breakdown comes under 18,100 but preferably under 18,000. It could then project down to the forementioned 16,500 level where it would test major support.
U.S. 10-year Treasury Bond/Canadian 10-year Government Bond (CGB)
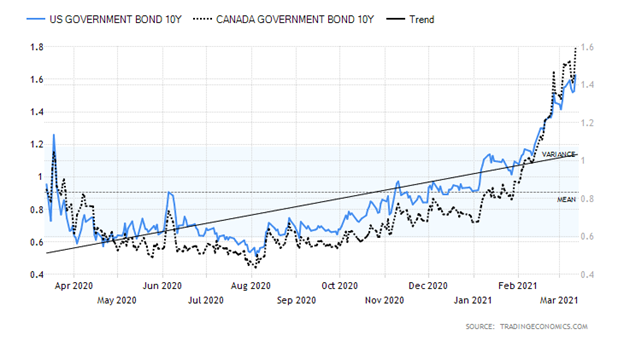
U.S. treasuries plummeted again this past week as yields, which move inversely to prices, leaped to their highest levels since early 2020. The 10-year U.S. treasury note jumped to 1.64% while the 30-year treasury bond rose to 2.40%. The rise is being fueled by expectations from the $1.9 trillion package signed this past week that it will unleash a wave of spending and economic growth and in turn ignite inflation expectations. The $1.9 trillion package is both fiscal and monetary. The spread with the 2-year U.S. treasury note widened to 1.48%, up from 1.42% the previous week. Canadian bond yields also jumped as the 10-year Government of Canada bond (CGB) rose to 1.57% and the 2–10 spread was up to 1.25%.
Inflationary expectations are now in the market. U.S. consumer inflationary expectations were up 3.09% in February vs. 3.05% in January and expectations of a rise of 3%; the CPI rose 1.7% year over year while the core inflation rate (less food and energy) was up 1.3% for February; weekly jobless claims surprised again coming in at 712,000 vs. 754,000 the previous week and expectations of a rise of 725,000; the February producer price index (PPI) surprised, coming in at 0.5% when the market only expected a rise of 0.3%; year over year the PPI was up 2.8% while the core rate was up 2.5% as both were above expectations of 2.2% and 2.3% respectively; the Michigan Consumer Sentiment Index was 77.5 vs. 70.7 the previous month and an expectation of 75. As we can see, the higher PPI and consumer sentiment surprised the market and helped to send yields higher.
All of this is playing into our expectations of a 3-year cycle low (or high in yield). This cycle low is a part of the 6-year cycle. The last major low was 2018 when the cycle low was also a long-term 18-year cycle low. The next 6-year cycle low could be out to 2024 or range from 2023–2025. Our expectations are that the 10-year could reach as high as 2%. All this will push up Canadian yields as well even as the BofC left the key bank rate unchanged this past week at 0.25%. Numbers to watch this coming week are industrial production and retail sales on Tuesday.
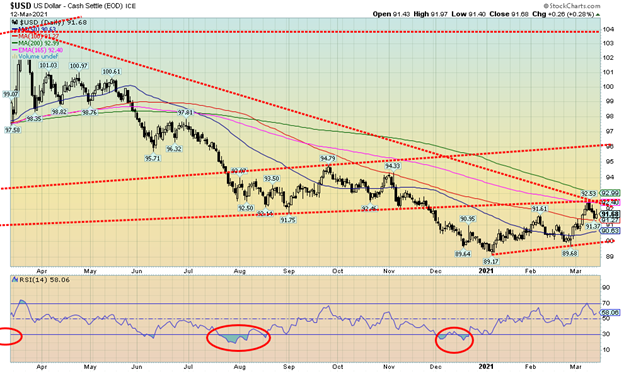
The US$ Index ran into resistance at the 165 EMA near 92.50 this past week (high 92.53) and then pulled back, closing lower on the week by 0.3%. It was a pretty small movement week. The euro was up 0.4%, the Swiss franc gained 0.2%, the pound sterling was up 0.6%, but the Japanese yen fell 0.6% and is now down 5.3% on the year. A rising yen is positive for gold while a falling yen is negative for gold. Surprisingly, the two enjoy a close correlation. The Canadian dollar was a star, up 1.5% to fresh 52-week highs, hitting a high of 80.30 while closing at 80.20. The Cdn$ is enjoying the rise in oil prices, plus stronger than expected economic numbers (employment gains, Q4 GDP, positive trade balance, etc.). It is the first time the Cdn$ has closed over 80 since 2018. The Cdn$ shows considerable potential to rise further as a multi-year double bottom may be in. A firm breakout over 83 could project the Cdn$ up to 97/98 as a maximum. Above 83 there is not a lot of resistance to 90. The all-time low for the Cdn$ was seen in 2002 at 61.86. The US$ Index has support down to 91 but below that it could fall to 90–90.50. A breakdown under 90 would be negative and could lead to a new downtrend. Regaining 92.50 would be positive and a run to the next major resistance at 93 would be underway. A firm breakout over 93 could signal an even stronger bull market for the US$ Index. The US$ Index strongest seasonals tend to top in March as noted by Equity Clock (www.equityclock.com). However, as noted, we need a good close under 90 to confirm the start of another bear move.
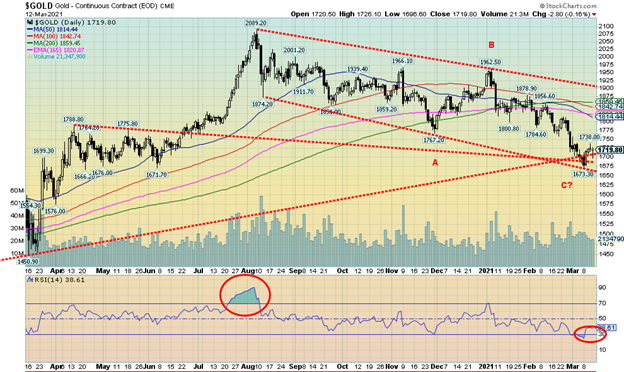
It was a positive week for the precious metals following several negative weeks. Gold gained 1.3% on the week, the first rise in seven weeks. Silver was up 2.5%. Platinum did even better, up 6.4%. Of the industrial metals with precious metals characteristics, palladium was up 1.4% and copper gained 1.5% but did not see fresh 52-week highs. Gold rose this past week despite the U.S. 10-year treasury note rising to 1.64%. Gold prices fell into a confluence of support, down to almost $1,670 (low $1,673). This has highlighted for us that a breakdown under $1,670 would be quite negative and an acceleration to the downside could occur. We don’t see it happening given the bullish factors we are seeing, but we can’t dismiss it until we have confirmed a low. And that is not happening yet. Gold’s RSI fell below 30%, a sign that it was getting oversold. Sentiment fell to 12% but we’ve seen it even lower. Regaining and closing above $1,700 was positive but a close over $1725 would have been better. We have resistance in the $1750/$1,760 area, but above that we should get to $1,800. There is wide-ranging resistance for gold between $1,815 and $1,860. Regaining and closing above $1,860 would give us a confirmation on the $1,673 low. That highlights how much work gold needs to do to confirm a low. Over $1,900 things would be looking up and gold could then be breaking out. First things first is regaining above $1,750/$1,760. A failure there would be negative and bring the breakdown level of $1,670 into focus.
Possibly a sign of a low is a negative article in Barron’s – Don’t Expect Gold to Bounce Back Anytime Soon, Barron’s March 11, 2021. Often these kinds of headlines suggest a low (or the reverse with a very bullish article at tops). Barron’s correctly identifies industrial metals as the ones to buy in a growing economy but gold too can rise in that environment. Oddly enough, Barron’s said at the end of the article that gold too could rise along with the industrial metals. Yes, that too and the industrial metals could rise faster. Key, however, for gold is the U.S. dollar and the interest rates. If they keep going higher then gold will struggle and even fall.
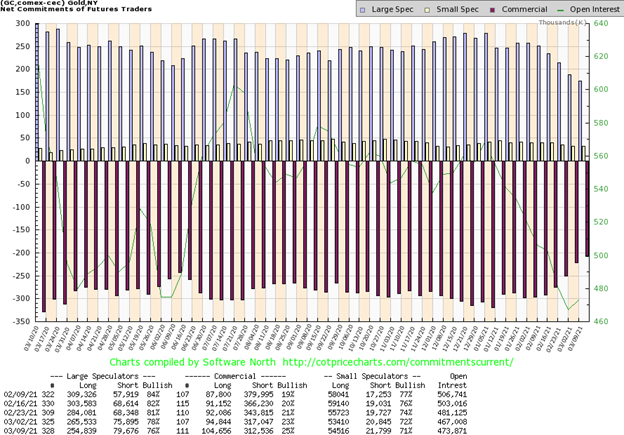
Once again, encouragement from the commercial COT. The commercial COT for gold improved this past week to 25% from 23%, the highest level seen in months. Long open interest jumped roughly 10,000 contracts while short open interest fell about 5,000 contracts. The bullion banks, it appears, were covering their short positions on plunges. The large speculators COT (hedge funds, managed futures, etc.) slipped to 76% from 78%. The large speculators COT is now down 6 points in the past four weeks. The large speculators cut their long position by upwards of 11,000 contracts while the short position grew by about 4,000 contracts. As well, open interest was up roughly 7,000 contracts in a week in which gold gained. This too is a positive development. For the first time in a while, we are encouraged by the improving commercial COT as it could be suggesting a bottom is in place. Do the bullion banks know something we don’t know?
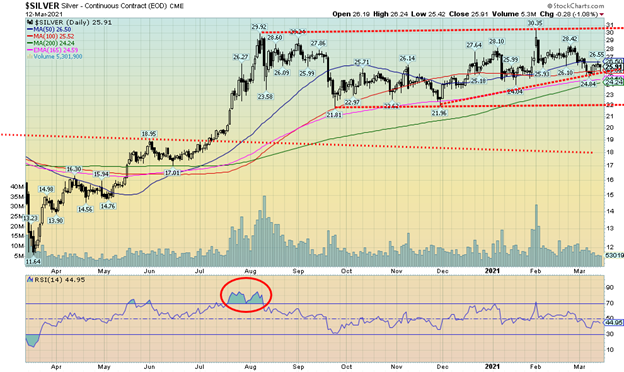
Silver prices managed to eke out a 62-cent gain this past week or 2.5%. That still leaves silver down 1.9% in 2021. Silver had strong gains in 2020 so a decline thus far of 1.9% is a mild correction. Despite the rise, silver still has work to do to confirm the recent low at $24.84. A close over $26 would have been helpful. While regaining $26 is positive we need a close over $27 to confirm a low. Regaining $29 would be very positive and suggest new highs ahead above $30.35, the recent spike high. To the downside, there is support down to $25 but under that level a decline to $24 and even down to $22 could get underway. We poked our head below $25 this past week but the level held. Silver, unlike gold, never became deeply oversold. Since the high in August 2020 silver has been in a wide range between $22 and $28 with forays to $30. More recently the range has narrowed to $25 to $28. Silver, arguably, could be forming a rising triangle which is bullish. A breakout over $27 could technically suggest a target up to $32.50.
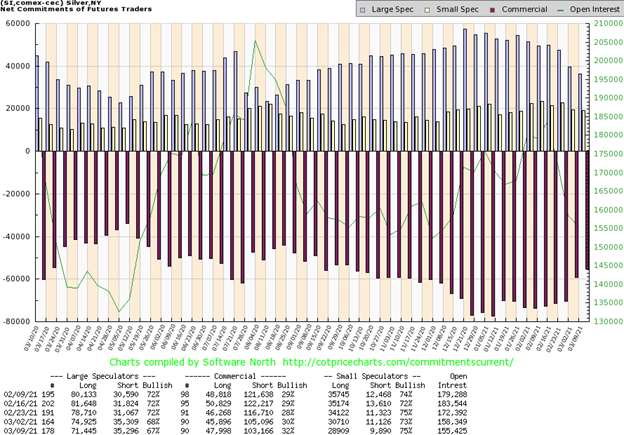
Like the gold commercial COT, the silver commercial COT improved this past week to 32% from 30%. Long open interest rose roughly 2,000 contracts while short open interest fell about 2,000 contracts. That’s a double. The large speculators COT slipped to 67% from 68% while overall open interest slipped by about 3,000 contracts. That still suggests to us we are in corrective mode. Bullish mode would see open interest rising. (Note: open interest rising in a bull market confirms the bull while open interest rising in a bear market confirms the bear.) We are encouraged by the improvement. Ideally, we’d like to see the commercial COT rise to 40 or higher.
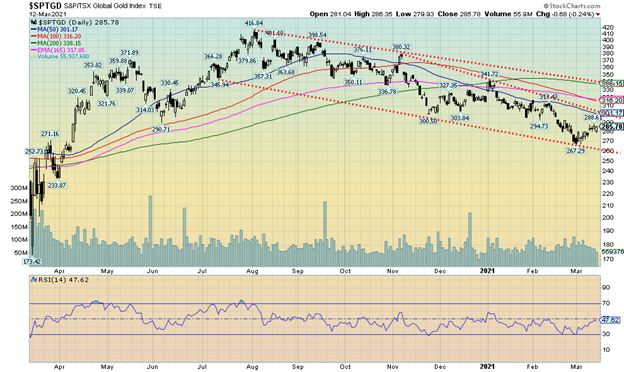
Despite continued softness for gold and silver, the gold stocks enjoyed an up week. The TSX Gold Index (TGD) was up 2.0% while the Gold Bugs Index (HUI) gained 3.5%. Both remain down on the year with the TGD off 9.4% and the HUI down 9.5%. While the gain is welcomed, the TGD has considerable work to do to bring it back into bull territory. The TGD has considerable resistance between 300 and 340. A breakout above 300 would be positive as it could suggest that a run to 340 was possible. Above 340 the TGD would return to a bull market. A breakout above the August 2020 high of 417 could suggest a run to 550/560 as an objective. Admittedly, we are premature in thinking of that as we need a break over 340 just to confirm the recent low at 267. The Gold Miners Bullish Percent Sentiment Index (BPGDM) is currently at 24. That’s low, but nowhere near the 0–10 range that has often signaled significant final bottoms. There is downside support for the TGD to 260. Below 260 would be trouble.
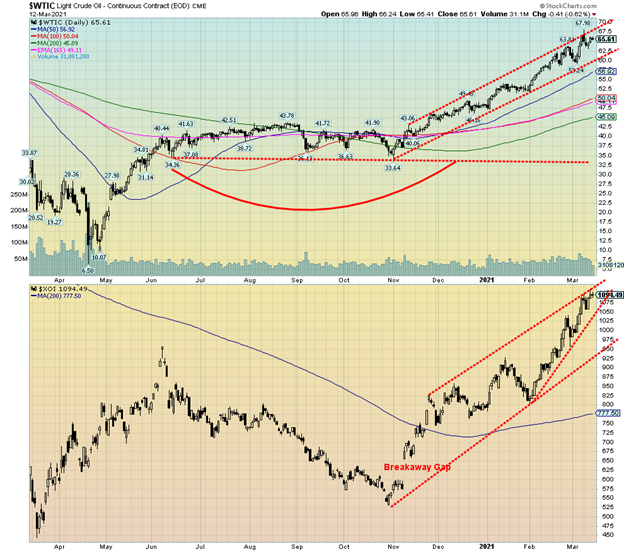
Despite a soft week for oil the market remains bullish. Oil prices slipped, then recovered late in the week but were still down 0.7%. Natural gas (NG) also suffered off 3.7%. NG is now in a daily downtrend. The energy stocks, however, did not suffer as the indices soared to new 52-week highs with the Arca Oil & Gas Index (XOI) up 0.8% and the TSX Energy Index (TEN) gaining 4.0%. Energy stocks have been the best performers so far in 2021 with the XOI up 38.1% and the TEN up 39.1%. Given softness this past week for both oil and gas, some caution should be exercised going forward as profits could be locked to await a needed pause for the sector.
Despite all the excitement of opening up and vaccinations, OPEC actually lowered its forecast for Q2 demand down to 690,000 bpd. Saudi Arabia had previously noted they would lower their output again in February/March by another 1 bpd, but instead numbers show it was less than that. Given the price increases, many shale operators in the U.S. are looking at starting up again. But could their coming to the table put a damper on price increases as more oil is pumped?
WTI oil appears to have overshot a trend line as it was short-lived and came right back into the channel. This could be a sign of at least a temporary top. The XOI too reached the top of what appears as a bull channel, so its ability to move higher from here might be compromised without at least a pullback to test the lower edge of the bull channel.
An interesting aside we read was that Iran’s exports to China have doubled in the past month. That is interesting considering the so-called sanctions on Iran from the U.S. Iranian oil sells at a $3 to $5 discount to the Brent price because of the sanctions.
Airline traffic is picking up, but of course is nowhere near where it was before the pandemic. Airlines have been amongst the hardest hit because of the pandemic with air travel generally down 80%.
Given that oil has been hitting the tops of channels and many indicators are currently in oversold territory, we are at least temporarily cautious on the sector. We have noted that profit taking might be prudent as the sector can be volatile and things could shift quickly. There are, of course, individual situations that will buck any pullback in the sector. There is considerable resistance for WTI oil in the $70s, but if prices could climb through $80 then there is a chance they could rise to $100.
_
(Featured image by Michael Steinberg via Pexels)
DISCLAIMER: This article was written by a third party contributor and does not reflect the opinion of Born2Invest, its management, staff or its associates. Please review our disclaimer for more information.
This article may include forward-looking statements. These forward-looking statements generally are identified by the words “believe,” “project,” “estimate,” “become,” “plan,” “will,” and similar expressions. These forward-looking statements involve known and unknown risks as well as uncertainties, including those discussed in the following cautionary statements and elsewhere in this article and on this site. Although the Company may believe that its expectations are based on reasonable assumptions, the actual results that the Company may achieve may differ materially from any forward-looking statements, which reflect the opinions of the management of the Company only as of the date hereof. Additionally, please make sure to read these important disclosures.
David Chapman is not a registered advisory service and is not an exempt market dealer (EMD) nor a licensed financial advisor. We do not and cannot give individualised market advice. David Chapman has worked in the financial industry for over 40 years including large financial corporations, banks, and investment dealers. The information in this newsletter is intended only for informational and educational purposes. It should not be considered a solicitation of an offer or sale of any security. Every effort is made to provide accurate and complete information. However, we cannot guarantee that there will be no errors. We make no claims, promises or guarantees about the accuracy, completeness, or adequacy of the contents of this commentary and expressly disclaim liability for errors and omissions in the contents of this commentary. David Chapman will always use his best efforts to ensure the accuracy and timeliness of all information. The reader assumes all risk when trading in securities and David Chapman advises consulting a licensed professional financial advisor before proceeding with any trade or idea presented in this newsletter. David Chapman may own shares in companies mentioned in this newsletter. We share our ideas and opinions for informational and educational purposes only and expect the reader to perform due diligence before considering a position in any security. That includes consulting with your own licensed professional financial advisor.


The TopRanked.io Guide to 2026’s Biggest and Best Affiliate Opportunities
Want to earn affiliate commissions on literal billions of dollars worth of revenue? Then this week, we've got something special...


Eni Advances Energy Transition with Major Investment and Emissions Cuts
Eni showcased its “Just Transition” report in Rome, highlighting stakeholder collaboration and progress toward decarbonization goals. The company invested over...


The German Fintech Market Shows Resilience and Strong Investment Growth in 2026
Germany’s fintech sector remained resilient in 2026 despite economic crisis and rising insolvencies. Investments reached €14.2 billion, showing strong investor...


Cannabis Legalization in Germany: A Mixed Interim Assessment
Germany’s cannabis legalization has reduced criminal cases and eased pressure on the justice system, while the black market is slowly...


Sustainable Restoration of the Haus Hövener Garden in Brilon
The Brilon Construction Workers Association is restoring the Haus Hövener garden into a cultural community space, funded through a €10,000...
 |
|
 |  |
 |
|
-

 Crowdfunding2 weeks ago
Prestadero Sees Rising Female Loan Participation in Mexico
-
 Business2 days ago
The TopRanked.io Guide to 2026’s Biggest and Best Affiliate Opportunities
-
Business1 week ago
TopRanked.io Weekly Affiliate Digest: What’s Hot in Affiliate Marketing [+ The Best Affiliate Program Directory on the Internet]
-

 Crowdfunding2 weeks ago
Spain’s Crowdfunding Sector Surges as Real Estate and SME Financing Expand