Business
The Stock Market is a Price-Discounting Mechanism, Or Used to Be One
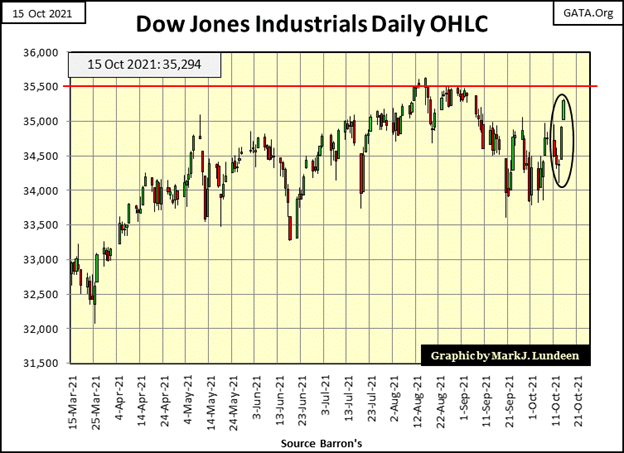
Dow Jones closed this week with a BEV of -0.93%. It hasn’t been this close to a new all-time high since September 3rd when it closed with a BEV of -0.72%. For the Dow Jones to come this close to making a new all-time high, yet fail to do so sometime in the next week or two, that would be a troublesome development in the market.
This week the Dow Jones rediscovered its primary purpose in life; to once again advance into market history, to inflate its valuation to something above its last all-time high of 35,625, seen last August 16th. It closed this week with a BEV value of -0.93%, less than 1% away, only 331 points from making a new BEV Zero in the chart below.
What happens then? The smart money is betting the Dow Jones will continue rising into history until Mr Bear returns. We’ll know when that happens; when the Dow Jones once again sees its dreaded days-of-extreme volatility, its Dow Jones 2% days.
It’s been a while since I reviewed the BEV chart format, so let’s do it. The Bear’s Eye View looks at the market as Mr Bear sees it. Every new all-time high (BEV Zero) is only a big-fat zero to Mr Bear, and never more than that. So, in the BEV chart below, each new all-time high registers as a 0.00%, (BEV Zero) and never more than that. The only thing Mr Bear cares about is how much he can claw back from the bulls. So, any daily close not a BEV Zero is a percentage claw back from its previous all-time high.
In effect, what the Bear’s Eye View does to market data is compress it into a range of 100%, with every new all-time high equal to 0.00%, and never more. A decline to a BEV value of -100% is a total wipe-out in valuation, and one can’t go lower than that.
The Dow Jones’ BEV chart below shows the entire history of the current bull market. The first BEV Zero seen below happened on 03 November 1982, when the Dow Jones closed at 1,065.49. In November 1982, that was just as much a new all-time high as last August’s 35,625.40. Since 1982, Mr Bear on four occasions has clawed back over 35% from a Dow Jones’ all-time high. Following each of these bear market declines, the Dow Jones soon resumed making new all-time highs.
I highlighted the 2000-02 High-Tech and 2007-09 Sub-Prime Mortgage bear markets. Plotting the Dow Jones in a BEV format, it’s easy visualizing which bear market went on longer (the High-Tech bear), or deeper (the Sub-Prime Mortgage bear).
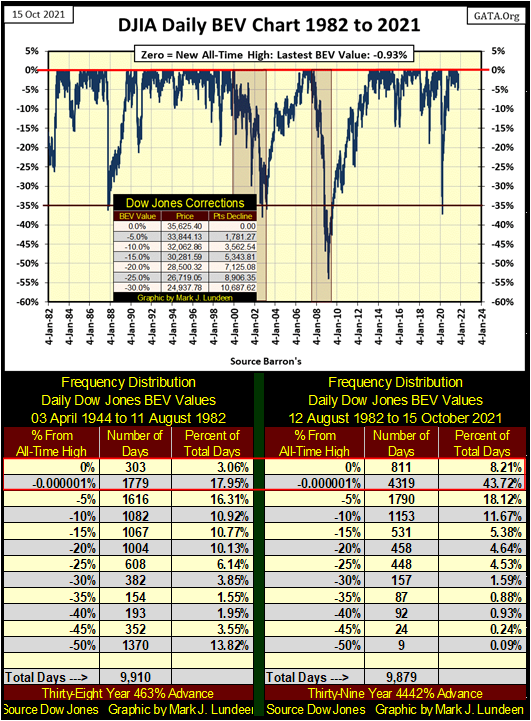
Analyzing Dow Jones’ daily data in BEV format, it’s obvious how bullish (inflationary) the past thirty-nine years has been. Above, I have two frequency distribution tables for approximately the same length of time. The 9910 NYSE trading sessions from 03 April 1944 to 11 August 1982, and 9879 NYSE trading sessions from 12 August 1982 to 15 October 2021; today’s close.
The key data is found in the 0% and -0.000001% rows (inside Red Box). The 0% row contains the number of new all-time highs for the Dow Jones. The -0.000001% row contains all the daily closings just short of a new all-time high * BUT * within 5% of one. These daily closings are in “scoring position” of making a new all-time high. Note; a BEV -5% daily closing is outside of scoring position.
Comparing these two rows in the tables above, from WWII to 1982 the Dow Jones closed at a new all-time high, or in scoring position for 21.01% if its daily closings. That’s one out of every five NYSE trading session in this sample. Compare that to what happened to begin in August 1982; the Dow Jones closed at a new all-time high, or in scoring position for 51.93% of its daily closings, or every other daily closing.
This didn’t just happen. Market valuations have intentionally been inflated as a “matter-of-policy” at least since Alan Greenspan became Fed Chairman in August 1987.
Keeping Dow Jones’ daily closings either at BEV Zeros, or in scoring position in mind, this week the major-market indexes I follow (table below) had only one new all-time high; the NYSE Financial Index on Friday. From the first of the year to last August we’d frequently seen five or more of these indexes closing the week with a BEV Zero. A few months later things were different. But note how on Friday, everything else, down to #18 closed the week in scoring position.
This is an excellent setup for next week. There are no signs Mr Bear is anywhere near Wall Street, no Dow Jones 2% days or NYSE 70% A-D days. The FOMC wants the stock market to go higher. The idiot savants are more than willing to buy as much liquor as needed to keep this party on Wall Street going. This is not the time to become bearish on the stock market.
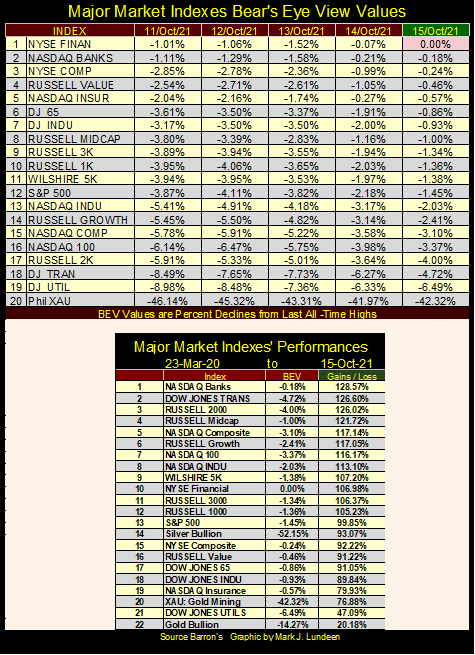
Recently, I’ve been concerned with the huge gains these indexes have seen since their March 2020 lows (table above). No tree grows to the sky, or market index inflate to infinity. But some trees do grow very tall, and FOMC willing, these indexes may yet inflate to much higher valuations from their lows of March 2020 than seen above.
I can’t see into the future, but it’s fun speculating on what could be. Unless something shocks the global financial system, such as a collapse in China’s financial system, following massive defaults in their real estate market, I’m going to assume the path of least resistance for the stock market is up.
But, when this party on Wall Street ends, and it will, most likely the bear market that follows will prove to be catastrophic.
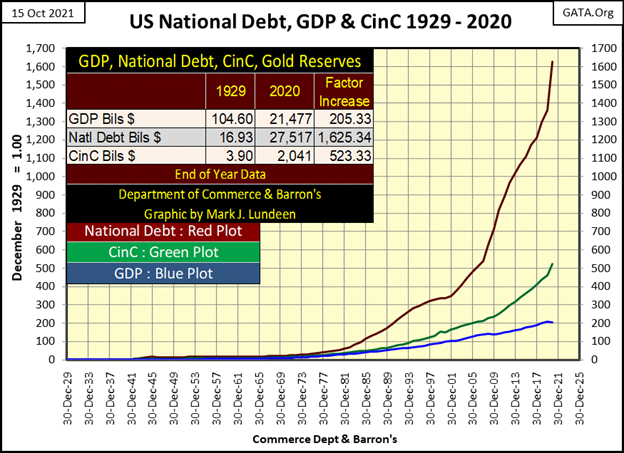
Why would that be? In the chart below I’ve plotted the indexed yearly data for Gross Domestic Product (GDP), the National Debt, and Currency in Circulation from 1929 to 2020, with 1929 = 1.00. The table in the chart lists the end-of-year data for 1929 and 2020, from which the ninety-one-year increase in each series was calculated.
What’s there to say about this chart? Do I really have to explain this? Okay, the US national debt has increased by a factor of 1,625 in the past ninety-one years. That’s obscene. Now in 2021, our Congress and the usurper Biden in the White House are fighting to increase the national debt by an additional three trillion dollars. There isn’t any coming back after this bubble pops. The New World Order’s “Great Reset” won’t be great for people like you and me.
Look at this. In 1929, GDP was six times larger than the national debt. After ten decades of Democrats and Republicans controlling the Federal government’s finances, that isn’t true anymore. Where is all this money going to? No one knows. No accounting firm in the United States can audit the Federal Government’s books, as they are as indecipherable as they are corrupt, and have been for decades, by design.
We have the worst leadership in Washington, and that has been true since 1913 when Congress created the Federal Reserve, and then President Wilson signed this legislative, central-banking monstrosity into law.
But decades ago, our “policymakers” showed some respect to the voters. They were careful not to speak obvious lies that could be easily proven fiscal shams to the voters. But today, with so many voters having attended four years of college, graduating with a major in a “critical studies program,” the average American is intellectually defenseless against the daily barrage of bogusness thrown at them by the main-stream media.
The Federal Government controls the nation’s ports, from which international trade is conducted. In October 2021 there is a logjam of shipping at most, if not all of America’s ports. The covid plandemic is largely responsible. But the covid-19 virus has a 99.9% survival rate. Washington’s bureaucracy is taking this less than lethal bio-weapon from China as a reason to block global commerce.
So far this logjam in shipping hasn’t affected the stock market, but could it continue.
One more chart on the Dow Jones; the chart plotting its daily bars. This week, the Dow Jones declined for the first three days, then on Thursday, it took off again towards market history. Another week like this and the Dow Jones will be at new all-time highs for the first time since last August.
When I first began studying the markets, the old-timers would all say the stock market was a “price-discounting mechanism”, a machine that took everything that was known today, to gauge what was coming tomorrow, and fix the market valuations accordingly. So, what is happening today?
- Hypergrowth in the national debt,
- The potential meltdown in the Chinese financial system,
- Fear of a hot war over Chinese aggression towards Taiwan,
- The break down in world trade because ships aren’t allowed to off load their cargo,
- A bogus plandemic is forcing a significant percentage of workers in critical industries, including healthcare to quit their employment to avoid the bogus covid jab.
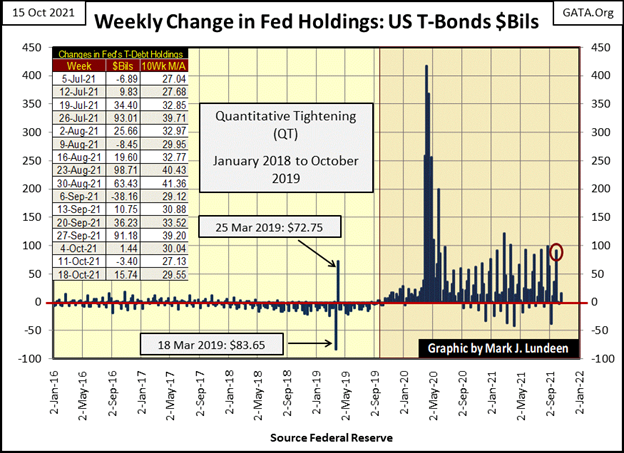
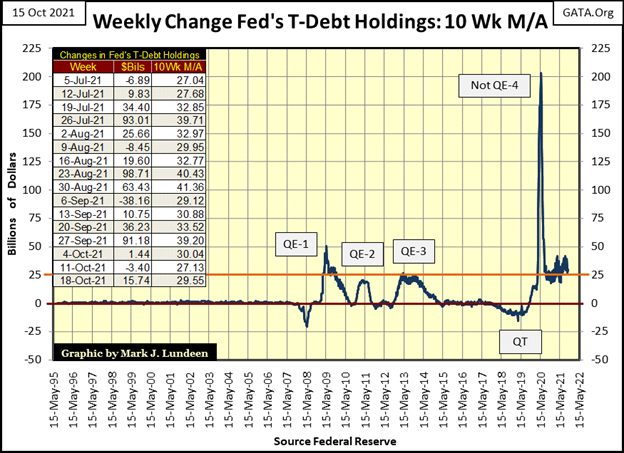
All this sounds very bearish, and in decades past would have taken a toll on the Dow Jones’ valuation. But not today. Today, the only thing the stock market is discounting is how much “liquidity” the idiot savants at the FOMC are going to “inject” into the financial system this week. As seen below, in the chart plotting the FOMC’s weekly “injections” since 2016, there is good reason for expecting the stock market to continue advancing, no matter what else happens in the foreseeable future.
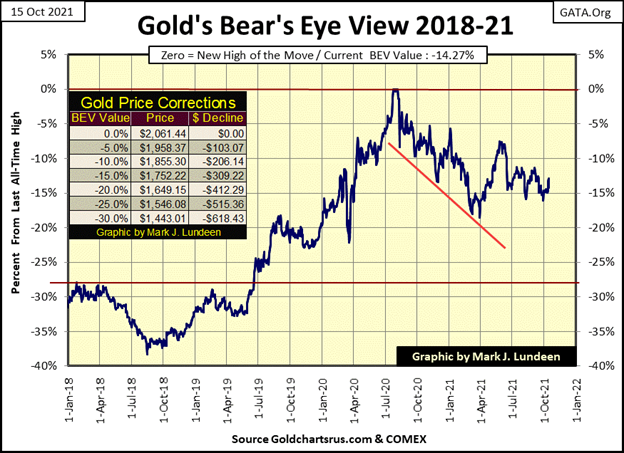
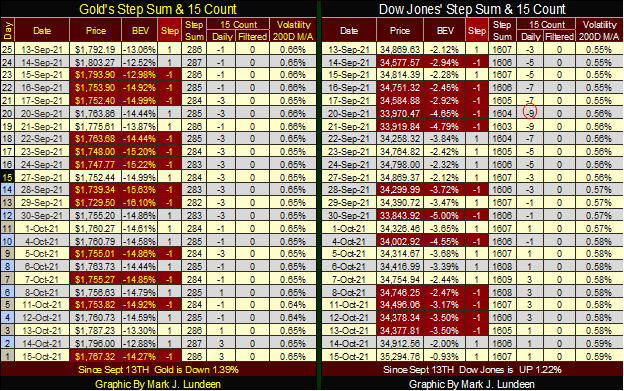
So, what happened with gold this week? Gold closed the week just a bit above last week’s close, but on Thursday almost closed above $1800 ($1796). The COMEX goons then whacked gold by $29 on Friday. So, nothing really changed this week, including the strong support gold is seeing at its BEV -15% line below.
If you go back and review all the bad things the stock market is ignoring as it continues advancing, the same is true about the old monetary metals, except gold and silver can’t catch a bid in a world in deep trouble. It’s a “policy thing.”
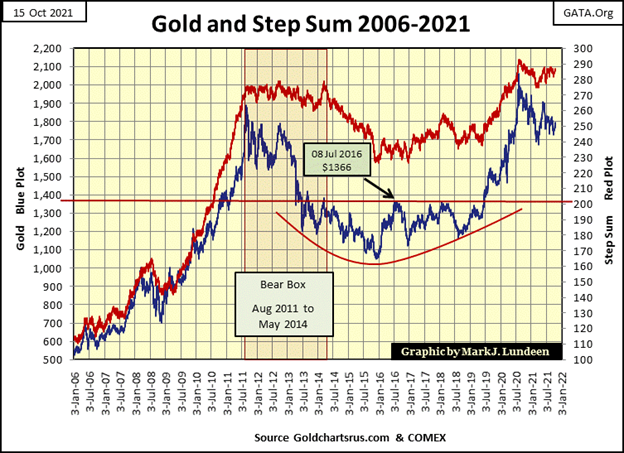
As far as gold’s step sum chart goes, nothing new to see. But sometimes no news is good news, and the inability for the “policymakers” to break gold below its $1700 level is good news. They’d like to, but apparently, they can’t. It is precisely times such as this where patience is a virtue.
It’s amazing, but old Alfred E. Neuman below was exactly right not to worry about the Dow Jones (chart below).
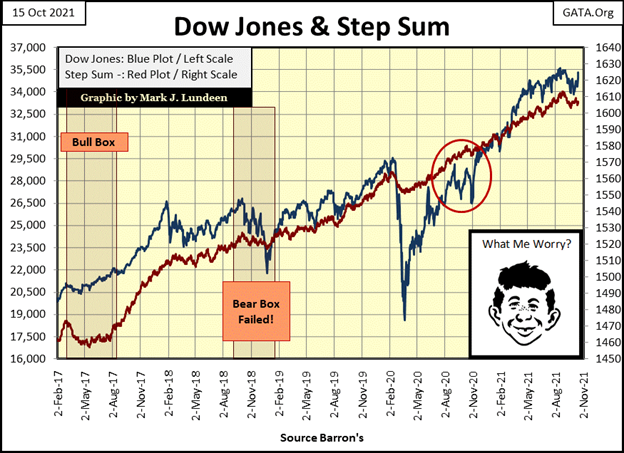
What did he know that people like me were ignorant about a few weeks ago? First of all, Mr. Neuman is an idiot, something every old-time reader of Mad Magazine has known for decades. But maybe, just maybe Alfred is also a member of the FOMC. The three QEs of Doctor Bernanke (chart below), and Chairman Powell’s Not QE-4 may have one factor in common; the monetary insight of Alfred E. Neuman.
The FOMC being the FOMC, they will neither confirm or deny this. But this does make more sense than believing the FOMC has anything to do with “market stability” or their preserving the purchasing power of the American dollar.
Not much new going on gold’s side of the table below. Getting above $1800, and staying above $1800 remains the task at hand. In time this will happen, and the drudgery seen below will only be a bad memory.
On the Dow Jones’ side of the table, it closed this week with a BEV of -0.93%. It hasn’t been this close to a new all-time high since September 3rd when it closed with a BEV of -0.72%. For the Dow Jones to come this close to making a new all-time high, yet fail to do so sometime in the next week or two, that would be a troublesome development in the market.
But if Alfred isn’t worried about massive debt defaults in China, or a breakdown in the global supply chain because ships can’t offload their cargo, or workers in critical sectors of the economy are walking away from their jobs to avoid Joe Biden’s vaccine mandates, why should we?
Well, I’m not worried. So, Dow Jones 36,000 is a done deal as far as I’m concerned, because, unlike some Navy Seals, Marines and other members in the military, police and firemen, airline pilots, or medical professionals, Wall Street absolutely loves being “injected” with “liquidity.”
—
(Featured image by OTA Photos CC BY-SA 2.0 via Flickr)
DISCLAIMER: This article was written by a third-party contributor and does not reflect the opinion of Born2Invest, its management, staff or its associates. Please review our disclaimer for more information.
This article may include forward-looking statements. These forward-looking statements generally are identified by the words “believe,” “project,” “estimate,” “become,” “plan,” “will,” and similar expressions. These forward-looking statements involve known and unknown risks as well as uncertainties, including those discussed in the following cautionary statements and elsewhere in this article and on this site. Although the Company may believe that its expectations are based on reasonable assumptions, the actual results that the Company may achieve may differ materially from any forward-looking statements, which reflect the opinions of the management of the Company only as of the date hereof. Additionally, please make sure to read these important disclosures.


The TopRanked.io Guide to 2026’s Biggest and Best Affiliate Opportunities
Want to earn affiliate commissions on literal billions of dollars worth of revenue? Then this week, we've got something special...


Eni Advances Energy Transition with Major Investment and Emissions Cuts
Eni showcased its “Just Transition” report in Rome, highlighting stakeholder collaboration and progress toward decarbonization goals. The company invested over...


The German Fintech Market Shows Resilience and Strong Investment Growth in 2026
Germany’s fintech sector remained resilient in 2026 despite economic crisis and rising insolvencies. Investments reached €14.2 billion, showing strong investor...


Cannabis Legalization in Germany: A Mixed Interim Assessment
Germany’s cannabis legalization has reduced criminal cases and eased pressure on the justice system, while the black market is slowly...


Sustainable Restoration of the Haus Hövener Garden in Brilon
The Brilon Construction Workers Association is restoring the Haus Hövener garden into a cultural community space, funded through a €10,000...
 |
|
 |  |
 |
|
-
 Biotech2 weeks ago
Argentina Expands Flu Vaccine Production Through PAHO Partnership
-
 Biotech3 days ago
The German Biotech Industry Faces Funding Crunch Despite Market Stability
-
 Crypto1 week ago
Cardano in Decline as Hoskinson Distances Himself Amid Growing Uncertainty
-
 Cannabis2 weeks ago
Hemp Boom to Bust: America’s Regulatory Reset and Europe’s Warning