Business
This is One Hell of a Tedious Market
That the financial media continues speaking optimistically of the banks suggests, to me if no one else, that we are still far from the bottom for the banks. Also, yes, a few banks have seen big problems, but not all that many. So, why is this banking index down by over 40%? I think the market is giving a clear warning to anyone who is willing to listen, that much worse is still to come for the banks.

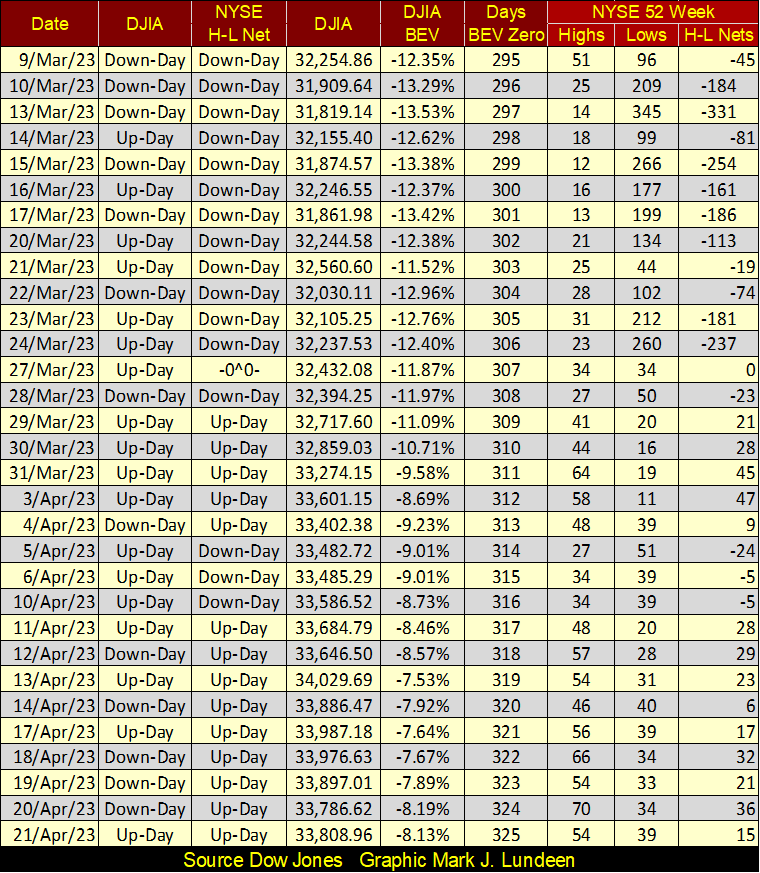
Advance and be recognized; what’s the password for the stock market these past few weeks? Tedium, what else could it be? Since the end of March, the Dow Jones BEV value has traded between its BEV -9.58% (33,274) and -7.53% (34,029), or -2.05% BEV points. That works out to trading within a range of only 755 dollars. This is a market going nowhere fast.
Given time, we’ll see more excitement in the market than we may want. However, that will be then, and this is now, and right now this is one boring market to attempt writing a market commentary on.
Then maybe it’s not, that may be the Dow Jones is trading as it has for a while. Look at the Dow Jones BEV chart below; is the past month’s trading any different than in the past?
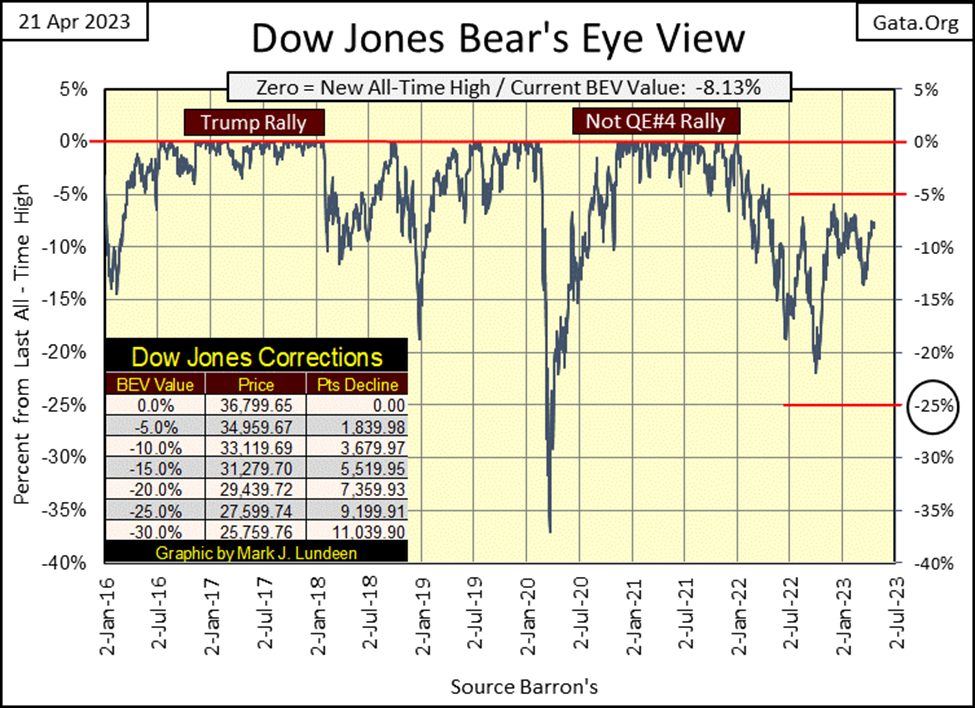
Maybe the tedium weighing down on me is a problem that is all mine. That as a big bear, I’m tired of waiting for something profoundly bearish to happen in the market. Something like, but no limited to more banks closing their doors to the public, as gold and silver prices soar on the news.
Something bad is going to happen. There is no shortage of massive problems now lying in wait to bushwhack the unwary bulls in the market. I just hate waiting for something now hiding in the weeds to come out, and do what must be done; deflate this market’s current overvaluations. Begin the move for the Dow Jones’ dividend to once again yield something over 6%. A 6% dividend yield. That is something the Dow Jones hasn’t seen since the 1980s, when Alan Greenspan began inflating bubbles in the financial markets.
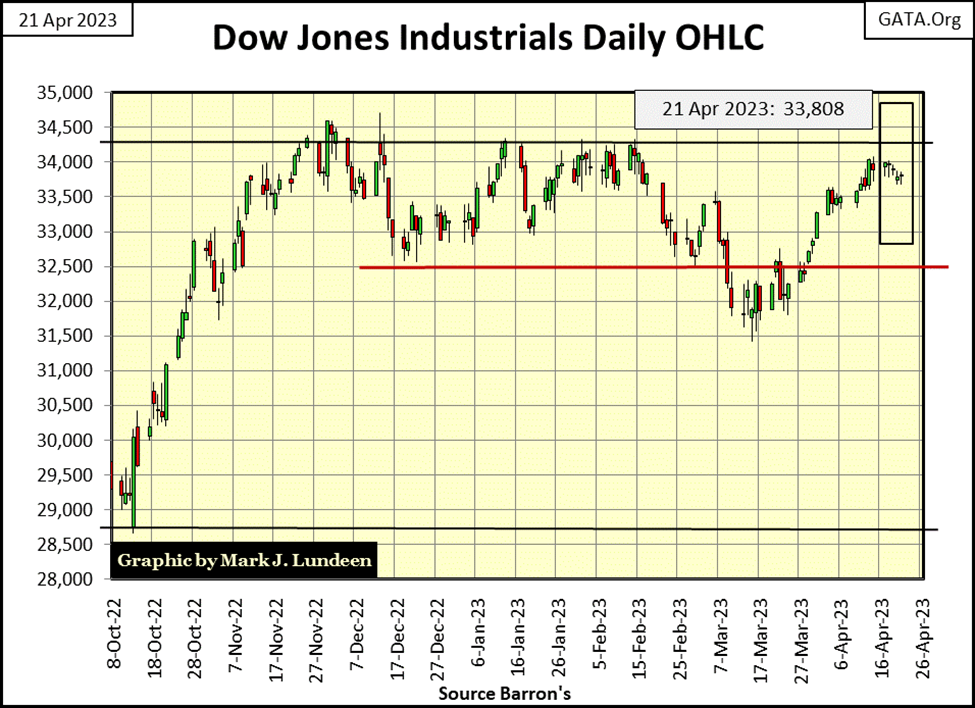
Be that as it may, looking at the Dow Jones in daily bars below, April’s tedium is on full display. The Dow Jones has been range bound since November. After last week, the Dow Jones was in position to take out its resistance at 34,250. Then came this week, which will most likely prove to be the wimpiest week of 2023.
So, what’s wrong with the market? The FOMC’s QT continues, as is the public’s reduction in margin debt. Maybe the question should be; since the end of March, how has the Dow Jones remained so strong?
Let’s change the subject. I made a change in my Bear’s Eye View (BEV) values for my major market indexes table below; I’ve included an average for the group, which closed the week at #14 below. Now we can see which index is above or below average.
By plotting the average for this data set going back to 1996 (chart below), we see all the bull and bear markets for the past three decades. Note, this average will only be a BEV Zero, when all twenty indexes in the data set are also at a BEV Zero. Below, that happened only in 1996 when I began this average. As all Bear’s Eye View data series begin with their very first data point at 0.0%, and I began this data series in 1996, that was unavoidable. So, I ignore this data until October 1998 (Red Circle), when the average was rebounding off a -25% decline.
In this chart, I placed a red rectangle encompassing the area between the BEV Zero and -5% line, the area in any BEV chart for its scoring position. It’s difficult for the average of twenty major market indexes’ BEV values to close within scoring position. Following October 1998 (Red Circle), it did in close in scoring position in the late 1990s, at the market top of the big-bull market of the 1990s. But didn’t do so again until the Trump Market Rally (June 2016 to January 2018).
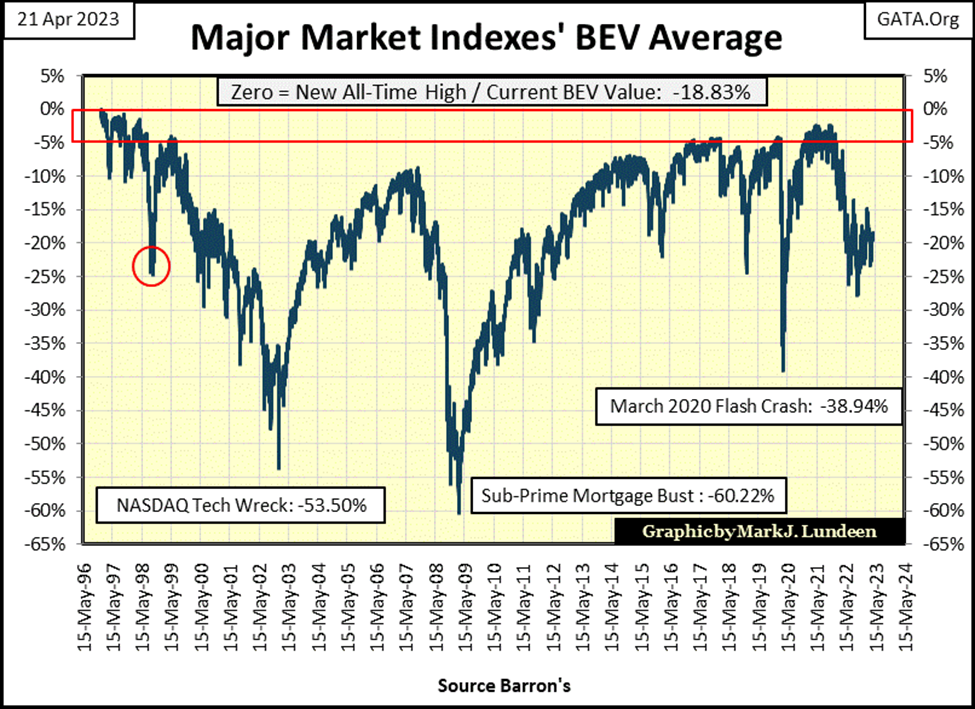
The strongest performance for this average happened during Powell’s Not QE#4 advance, following the March 2020 flash crash. This Not QE#4, with a few trillion dollars of “liquidity injected” into the market, drove this average up to a BEV of -2.46% on November 5th 2021 (table below). It was a market top for this data, a day where fifteen of the twenty indexes closed at a new all-time high (0.0% / BEV Zero), with the next four well within scoring position (table below). Only the XAU was far from making a new all-time high in the first week of November 2021.
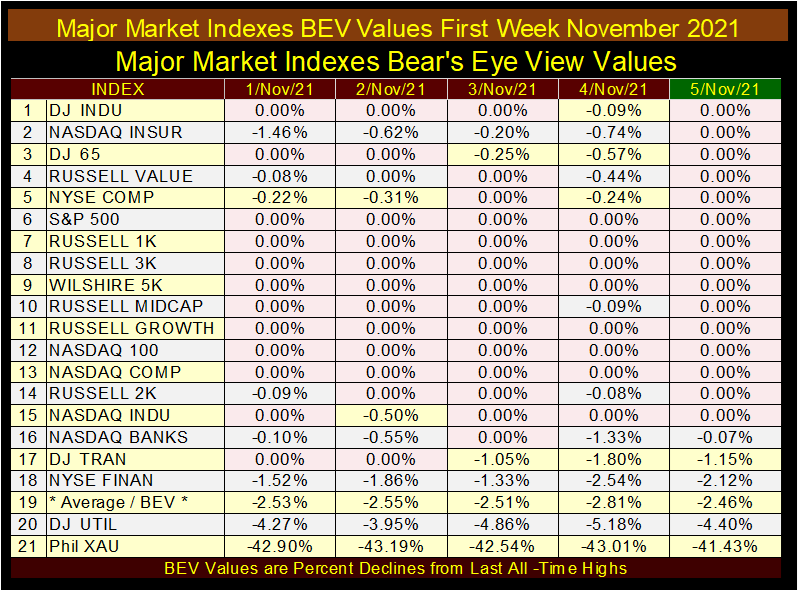
The first week of November 2021 was a market top for the data set. In the past year and a half, Mr Bear has clawed back from the market, a good portion of what Chairman Powell gave them with his Not QE#4, as seen below. I expect we’ll see more of Mr Bear’s clawing back market valuation from these indexes as 2023 progresses.
Look at the NASDAQ Banks (#20). Being down by over 40% from its last all-time high of 23 November 2021, is proof positive the banks are in a bear market. All bear markets ultimately see a bottom. With these banks down by more than 40%, maybe now is the time to be buying banks?
That the financial media continues speaking optimistically of the banks suggests, to me if no one else, that we are still far from the bottom for the banks. Also, yes, a few banks have seen big problems, but not all that many. So, why is this banking index down by over 40%? I think the market is giving a clear warning to anyone who is willing to listen, that much worse is still to come for the banks.
Remember: denial is more than just a river in Egypt.
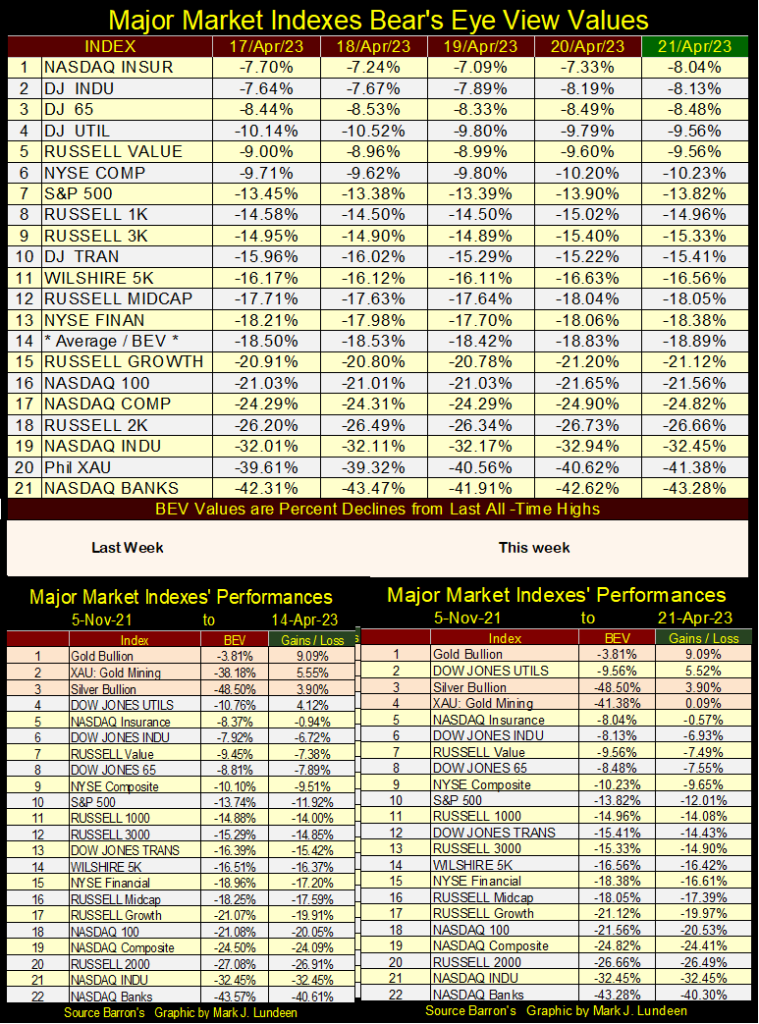
In this week’s performance table above, the XAU got whacked back down to #4 in the table. No matter, since November 5th, 2021 market top in my major market indexes, except for precious metal assets, and utility stocks, everything else is down. Some by a lot in the table above.
I included the NYSE 52Wk H-L Nets table for this week, as it provides an excellent example of how lackluster this market advance has so far been. Note, on days the market was going down in March, Mr Bear could generate negative triple-digit 52Wk H-L nets. But since the market turnaround in late March, the bulls have failed to generate even one day with a positive triple digit 52Wk H-L Net. Since late March, the bulls have failed to even generate a H-L Net of over +50.
The market may not be going down. But it’s hard arguing that it is going up.
What is this week’s password? Tedium; ten feet high and two feet thick, for a far as the eye can see. At least that is how I see tedium in the market this week. Next week could be completely different, or so I hope.
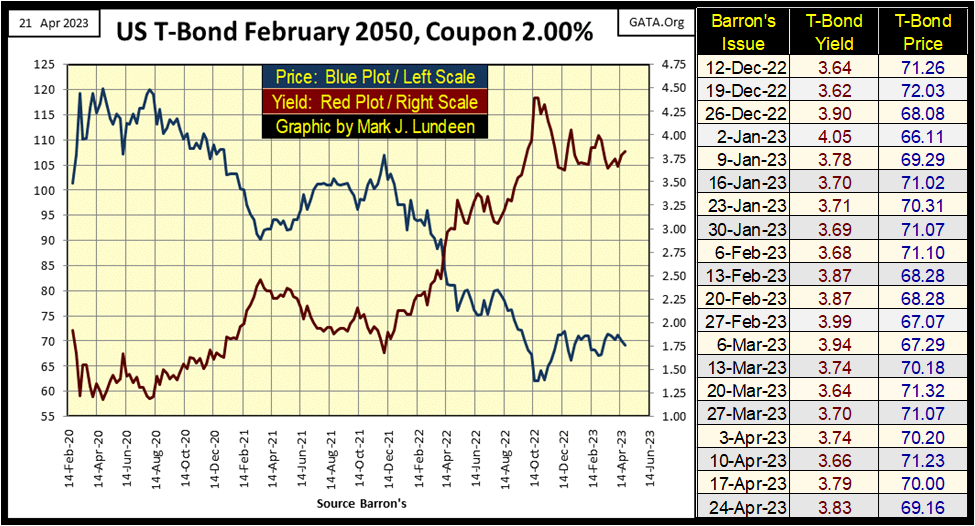
I haven’t posted bond yields for a few weeks. This is a good time to see what is happening in fixed income. Here is a 30Yr T-bond issued in February 2020. From its high of August 2020 (120), it closed below 65 last October. That is a two-year loss of 46% on a T-bond, a deeper market decline than the NASDAQ Banking Index has seen so far.
Are long-term T-bonds in a bear market? I’d say they are, with more deflation to come. That the Persian Gulf Oil Sheikdoms are terminating the petrol-dollar guarantees more problems to come for the US Treasury Bond market.
With all the problems the dollar is having, and how the clowns in Washington and Wall Street have mismanaging the nation’s affairs, for decades, I’m expecting more declines in valuation, and increases in yields for T-bonds in 2023 and beyond.
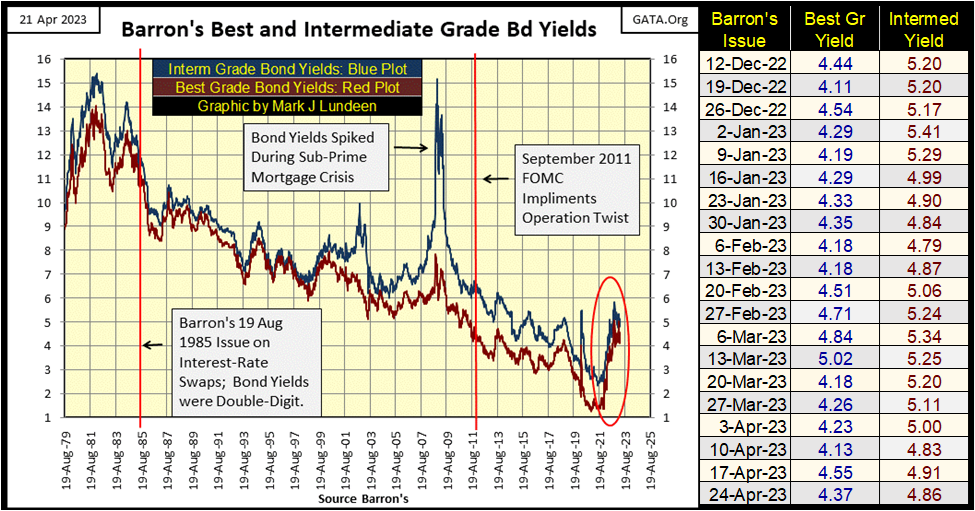
For the corporate bonds below, nothing exciting happening there either following their huge yield spike in 2022. Still, the bond market will continue being a problem for those seeking income for the next ten years, maybe longer. For private investors seeing income, as I see it, their best option would be a dividend paying gold and silver miner.
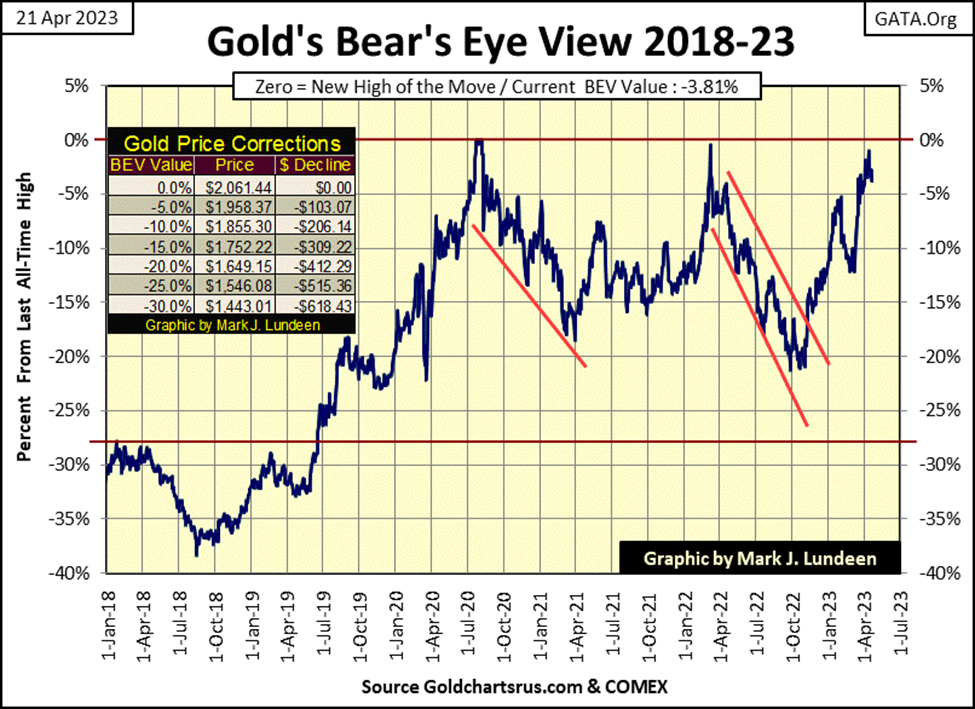
Moving on to gold’s BEV chart below, this week saw gold hit its own wall of tedium as it attempted to close at a new all-time high. On Thursday of last week, gold closed with a BEV value of -1.01%, less than $25 from taking out the now very stale all-time high of August 2020.
This week saw gold close with a BEV of -3.81%, so gold remains in scoring position. With gold’s reluctance to break into market history with a new all-time high, my battered bull syndrome (BBS) is returning. So, of course, I’m once again looking at gold’s BEV -5% line rather than its 0.0% line. I’ve been wrong before. In this case, I hope I am wrong once again, and we’ll soon see gold far above its last all-time high of August 2020: $2061.44, not below the $1958 the BEV -5% represents.
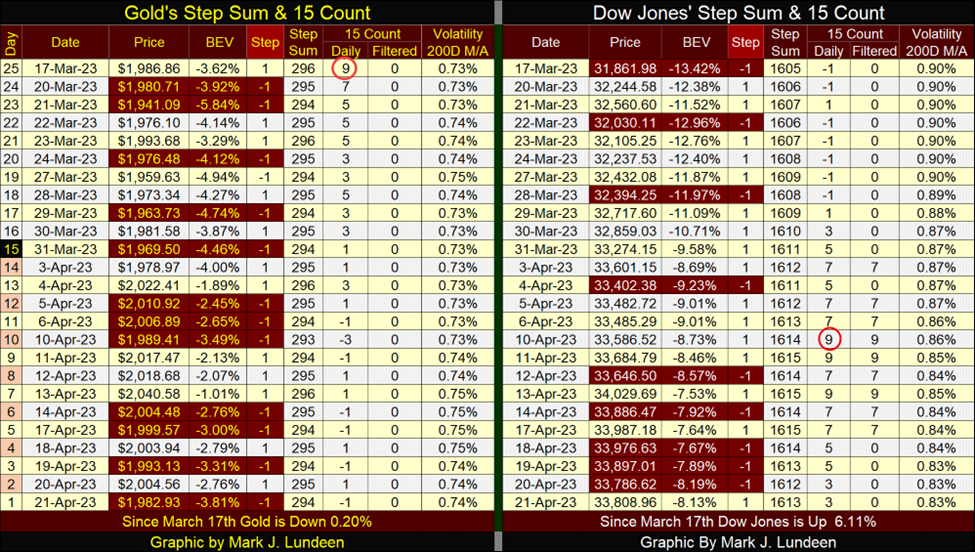
I’m going to keep my commentary simple on gold and the Dow Jones’ step sum tables below, and just note that following their 15-counts of +9, where both were very overbought, both markets began seeing an increase in daily declines. Yet both markets managed to keep their valuations pretty much intact as the selloff began. That is unusual.
I’m having writer’s block, and that is why I’m taking a two-week break. I write these articles as I enjoy doing so, but writing this week was like torture. Come the second week of May, I’m sure I’ll be back in the proper frame of mind to once again comment on the markets, and hopefully, there will be something happening in the markets to comment on. Like rising gold and silver prices, as bond yields once again rise, as the stock market resumes its decline. All this and more are going to happen in the coming bear market. Why not hope for it to begin in the next two weeks, and get the bad times behind everyone?
Until then, no matter what happens, may God bless all of my readers, and may their investments prosper.
__
(Featured image by sergeitokmakov via Pixabay)
DISCLAIMER: This article was written by a third party contributor and does not reflect the opinion of Born2Invest, its management, staff or its associates. Please review our disclaimer for more information.
This article may include forward-looking statements. These forward-looking statements generally are identified by the words “believe,” “project,” “estimate,” “become,” “plan,” “will,” and similar expressions. These forward-looking statements involve known and unknown risks as well as uncertainties, including those discussed in the following cautionary statements and elsewhere in this article and on this site. Although the Company may believe that its expectations are based on reasonable assumptions, the actual results that the Company may achieve may differ materially from any forward-looking statements, which reflect the opinions of the management of the Company only as of the date hereof. Additionally, please make sure to read these important disclosures.


Virginia Cannabis Market Could Reshape Regional Competition
Virginia’s planned recreational cannabis market could reshape the Washington region’s economic landscape. With nine million residents, it may draw consumers...


Bitcoin’s Price Drops as Investors Turn to Layer 2 Solutions
Bitcoin fell toward $63,000 after leveraged liquidations erased recent gains, while geopolitical tensions between the US and Iran pressured risk...


Emily.AI: Personalized Oxygen Therapy Earns Global AI Recognition
Emily.AI, Quirónsalud’s explainable AI medical device, became a global finalist at the AI for Good Summit 2026 after competing with...


Advanced Blockchain Under Pressure Amid Crypto Market Shifts
The crypto market shows diverging trends: Advanced Blockchain faces heavy pressure despite restructuring, weak finances, and ongoing transformation, though analysts...


Cannabis Regulation in Germany and Switzerland Shows Early Benefits of Legalization Models
Germany and Switzerland’s cannabis reforms suggest regulated access can reduce criminalization without increasing consumption. Germany saw fewer cannabis-related prosecutions, while...
 |
|
 |  |
 |
|
-
 Crowdfunding2 weeks ago
Spanish Crowdfunding Market Reaches Record €761.6M in 2025, Driven by Real Estate and Crowdlending Growth
-

 Cannabis3 days ago
Germany Tightens Cannabis Reimbursement Rules: Approved Medicines Must Come First
-

 Crowdfunding1 week ago
Lemonaid Offers Shares to Consumers for the First Time
-
 Crypto10 hours ago
Bitcoin’s Price Drops as Investors Turn to Layer 2 Solutions