Markets
How Trump’s Trade Wars Affect the Global Stock Markets
Markets remain volatile, with worsening conditions despite temporary rallies. Political turmoil, tariffs, and attacks on institutions fuel uncertainty. Consumer sentiment drops as inflation expectations rise, hinting at stagflation. Gold surges to $3,000, outperforming stocks. The FOMC meets soon, expected to hold rates. Canada cuts rates amid political shifts, including a new prime minister.

Trade wars. That’s all one hears about these days. We’d call it a four-letter word except it’s nine letters and two words. Better is just “tariffs.” At least that is only seven letters and all one word. Whatever you choose to call it, it has become the equivalent of a four-letter word.
It is estimated that the stock market has lost some $4 trillion since this decline got underway, with an all-time high top on February 19, 2025. Okay, that was just for the S&P 500. Everyone else made lower highs at the time—a divergence that has proven fateful for the stock markets. The question is, why did the markets remain elevated for so long, despite the warning of devastating tariffs right from the get-go on November 5, 2024 and the election of #47? We wanted to believe the focus would be tax cuts and deregulation. Maybe they thought #47 was bluffing.
For Canadians, it is not just the tariffs but it is also #47’s incessant call to make Canada the 51st state and his insults aimed at Canada, such as addressing the prime minister as the governor. Unless he believes insults work. What started as a joke has instead become deadly serious. But for the U.S., the pain doesn’t stop with tariffs. The unelected, unvetted Elon Musk who heads up the Department of Government Efficiency (DOGE) has been wielding his chainsaw to eliminate government.
Courts and others have at least somewhat slowed the devastation. Now the courts are being threatened along with the media. So far, we are not seeing the mass firings showing up in the job numbers. The most recent initial weekly claims came in at 220,000, below the previous week’s 222,000 and below forecasts of 230,000. JOLTS job openings also surprised, coming in at 7.74 million, above the forecasted 7.5 million and last month’s 7.508 million.
Jobs data are lagging indicators. This means it might take a few weeks for the numbers to show up. Apparently, a report has noted that fired government workers are having a difficult time applying for benefits, adding to the delay. But the uncertainty has been felt throughout the government, the economy and for that matter U.S. corporations as well as Canada, the EU, and many others. With uncertainty one reacts in a predictable manner—they sell. Stock markets, it seems, have had enough and turned down, especially after #47 warned that a recession may be on its way.
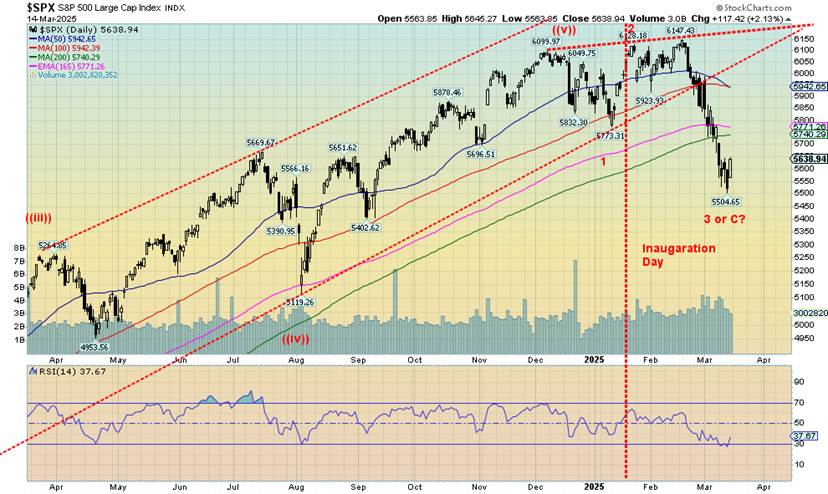
Since that fateful top on February 19, the S&P 500 has fallen 10% although the powerful counter rally on Friday brought it back to down 8.3%. Irrespective, that’s correction territory. And the NASDAQ? It’s already in correction territory, down over 13%. The poster child has been Tesla, now down over 50% from its all-time high in December 2024. The MAG7 has fallen into bear market territory, collectively down 20%+.
Not only has Tesla’s stock been burned, but so have a few car dealerships and charging stations. That in turn has burned Elon Musk, whose net worth is down an astounding $130 billion from its high. And he’s still the richest man in the world by far, boasting over $100 billion, above #2 Jeff Bezos of Amazon. In a depression, the very rich get their net worth trimmed. Everyone else is just unemployed and wiped out.
As to the government, well, they may not need to worry about cutting staff. The U.S. government seemed destined for a full shutdown due the breakdown of partisan support for a funding bill extension that goes only to September 2025. The bill, did pass by Congress and eventually the Senate as well thanks to a sufficient number of Democrats joining the republicans. The Democrats agreed to support the bill in the Senate for the “good of the country.” However, it has caused a big rift in the Democrat party.
Scorecard – November 5, 2024–Present
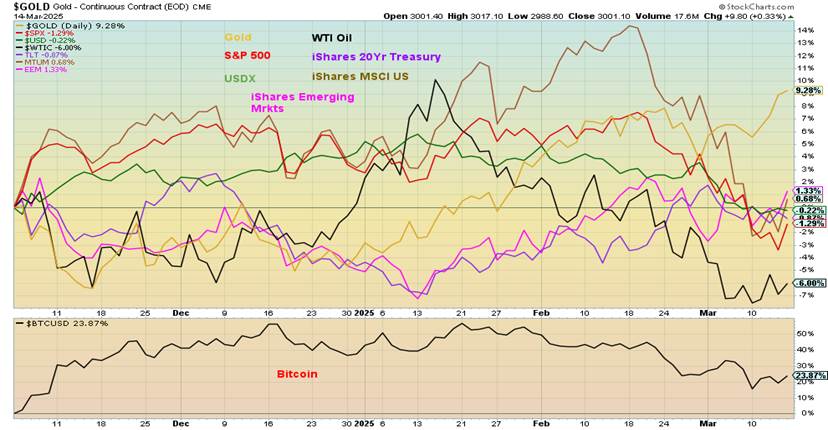
Our favourite chart has been the scorecard since the election of #47 in November 2024. Maybe it’s no surprise now that gold has taken the lead. How many times have we said gold is the safe haven in times of economic turmoil, geopolitical tensions, and loss of faith in government? Yet, gold (note: the metal, not the gold stocks which are a leveraged play on gold and have liability, unlike gold) remains largely under-owned, particularly in
North America. Could we see a gold rush à la 1979–1980? The gold bugs would be salivating. At least the ones who survived the gold bear market of 2011–2024. Yes, gold has been making new all-time highs, but silver and the gold stocks still lag. However, they too appear to have broken out, signaling the potential start of a new bull market for gold, silver, and the gold stocks. Note that, outside of Bitcoin, everything else has turned negative since November 5, 2024. Okay, almost everything. The EEM and MTUM are barely up. Gold is up 9.3% since November 5.
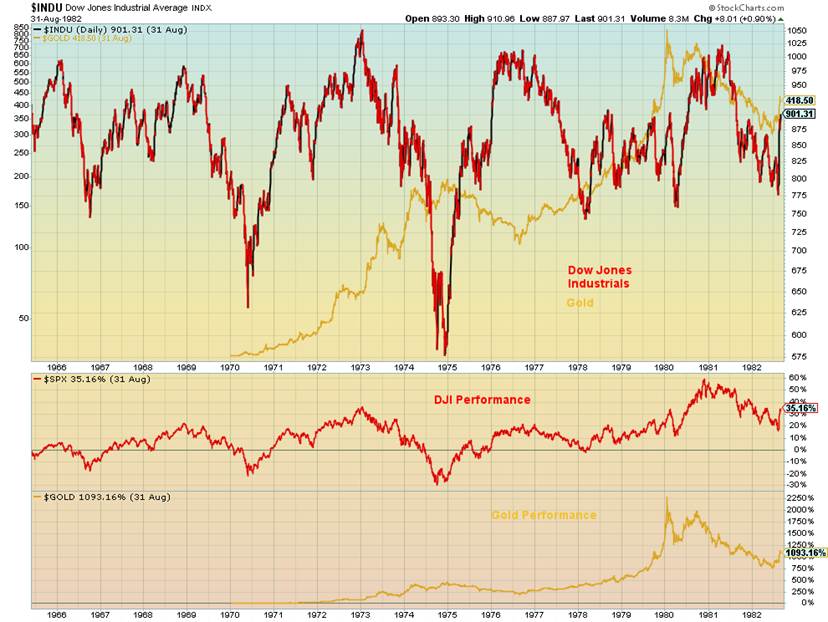
Another positive sign for gold is the potential re-emergence of stagflation. When one thinks of a depression, they automatically think of it as deflationary. But, as we learned in the 1970s when we had recessions in 1969–1970, and 1973–1975, and 1980–1982, even recessions can be inflationary. Only this is called stagflation. From the top in 1966 (DJI) to the final low in 1982 the DJI fell 22%. But that was on a nominal basis. On an inflation-adjusted basis the DJI fell 73%.
Meanwhile, gold, that had been fixed until President Richard Nixon took the world off the gold standard in August 1971 rose 10 times over 1,000%. And 1982, when the stock market bottomed, wasn’t even the high for gold. At the high in 1980, gold was up almost 20 times or 2,000%. That’s based on the close, not the actual high. On an inflation-adjusted basis it actually wasn’t as impressive as inflation softened the gains. The gain was only about 350% to the August 1982 stock market low and at the high gold was up around 800%. Still impressive.
Stagflation equals an inflationary recession or depression. Bad for stocks. Great for gold. During the Great Depression we saw the same phenomena, but instead it was a deflationary depression. See the chart that follows on DJI and Gold 1965–1982. The returns on gold vs. the stock market aren’t even close. Gold leads by a wide margin. Once the stock market bottom was in place in August 1982 the stock market embarked on an 18-year bull market. Gold? The opposite way. A 21-year bear market from its all-time high in 1980.
The U.S. CPI and PPI reports came out this past week. They were better than expected. The CPI rose 2.8% year over year (y-o-y) in February, below the expected 2.9% and January’s 3.0%. It was the first drop in five months but remains above the Fed target of 2.0%. The PPI also came in better at 3.2% vs. expectations of 3.3% and January’s 3.7%. While there were price drops for a number of items, food prices remained elevated.
Nonetheless, the inflation rates remain below the Fed rate of 4.5%. Real interest rates are maintained. The FOMC meets next week on March 18–19 and the expectation remains that the Fed will stand pat. That is not what #47 wants. Clashes loom between the White House and the Fed.
In Canada, the Bank of Canada (BofC), as expected, lowered the key bank rate by 25 bp to 2.75%, well below the Fed rate of 4.5%. The previous week saw the European Central Bank (ECB) lower its rate by 25 bp to 2.65%. We show charts of the U.S. CPI, PPI, and the Fed rate plus a chart of the central bank rates ECB, Fed, and BofC.
Dow Jones Industrials (DJI) and Gold June 1965–August 1982
U.S. CPI, PPI, Fed Rate – 2015–2025

Central Bank Rates – Fed, BofC, ECB 2015–2025
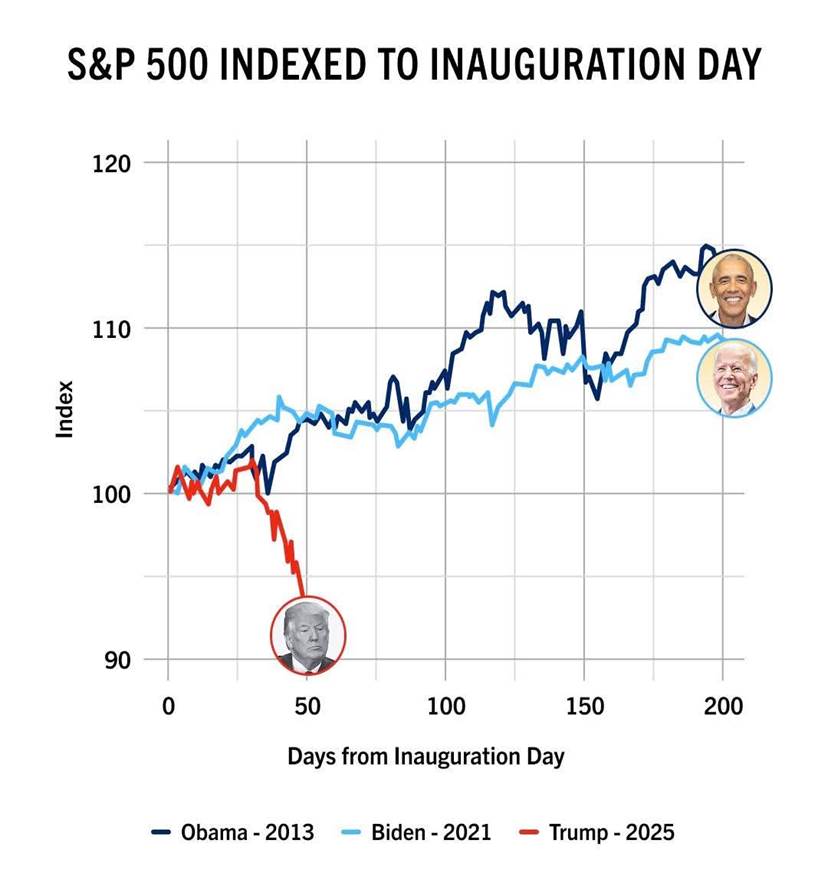
We have heard some talk that there are a number who believe that White House administration is trying to deliberately crash the economy. Funds, they believe, will then shift to the bond market and as the economy weakens the Fed will be forced to lower interest rates. So far, the drop in the stock market is reminiscent of the first two years of the Ronald Reagan administration. Reagan took over on January 20, 1981. The stock market (DJI) fell about 20% from inauguration date. As well, the U.S. suffered a deep recession in 1981–1982, although the impact of the recession really lasted from 1980–1984.
The following chart that was posted on X (formerly Twitter) shows the current decline as measured against the gains of the Obama and Biden administrations. The chart should have gone one step further and included the Trump administration during 2017–2021. The DJI was up about 6% in the first two months of the Trump administration in 2017. Instead, the DJI is down about 8.5% in 2025 after being off by almost 10%.
Consumer confidence is falling. The latest Michigan Consumer Sentiment Index (March preliminary) fell again, this time to 57.9, down from 64.7 in February. That pandemic/Russia-Ukraine war low of 50.0 in June 2022 is getting closer. The only other time the index fell under 57 was May 1980. As if that wasn’t enough, consumer expectations of inflation went up 4.9%, well above the expected 4.4% and last month’s 4.3%. Even the five-year inflation expectations rose to 3.9% vs. 3.5% in February and the expected 3.6%. Consumer confidence is down. Inflation expectations up. Not a good combination when you want the opposite.
University of Michigan Consumer Sentiment (preliminary) 1952–2025
If consumer sentiment falters, it is bad news for the economy and will show up, particularly in falling retail sales. It’s also signaling that the consumer expects things to get worse. It is surprising that consumer sentiment is this weak so early. Even in the recent rebound we never got over 81. The lofty heights of the 1990s and the 2010s seem but a distant memory.
One item cited with regard to plunging consumer sentiment is that immigration has slowed to a crawl, even as deportations rise. As a result, there is a lot of uncertainty as to what it all means for lower immigration, higher deportations, and tariffs/counter-tariffs. Immigration was positive for U.S. growth. Lower immigration could trim GDP growth by 0.6% according to a number of economists.
It’s all about on-again/off-again tariffs, trade wars with the rest of the world who retaliate with their own tariffs, plunging consumer sentiment and a plunging stock market, even as inflation remains stubbornly high, as well as a chainsaw approach to trimming the U.S. government with seemingly little thought about the potential negative impact.
Court orders to restore the jobs are either being ignored or challenged. We live in dangerous times and the expectation is that things will get worse before they get better. Demonstrations are rising as the chaos spreads. Chaos and volatility continue. Gold remains a safe haven, along with cash and bonds.
Chart of the Week
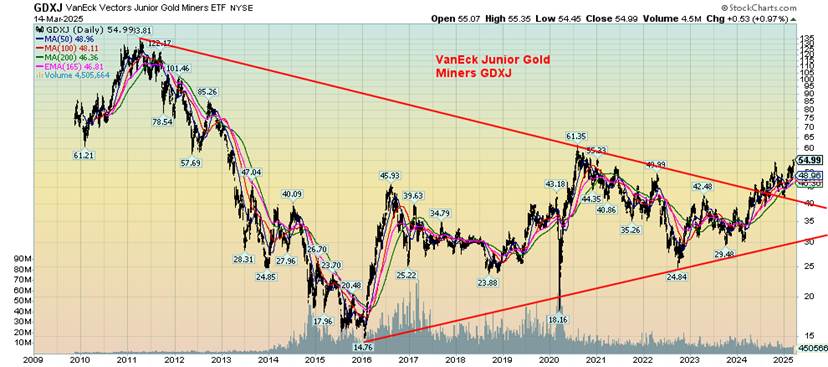
Instead of focusing on the MAG7 and the breakdown in the stock market, the focus should be shifted to what is breaking out. Instead of the MAG7, we have the VanEck Junior Gold Miners (GDXJ) breaking a long-held downtrend line from the high in 2011. In 2011, gold, silver, and the gold miners ended what had been a decade-long rise from the depths in 2001. The GDXJ didn’t exist back in 2001, but gold rose 494% while the Gold Bugs Index (HUI) rose 1,180% from 2001–2011, a remarkable run.
So, what is the GDXJ? The GDXJ is the VanEck Junior Gold Miners ETF. It seeks to replicate as closely as possible, before fees and expenses, the price and yield performance of the MVIS® Global Junior Gold Miners Index (MVGDXJTR), which is intended to track the overall performance of small-capitalization companies that are involved primarily in mining for gold and/or silver.
There are over 80 companies in the GDXJ, most of which are Canadian, but also represented are Mexico, Australia, South Africa and, yes, the U.S.A. The stock that has the highest weight is Alamos Gold (AGI – Canada), with an almost 8% weighting. Rounding out the top five are Harmony Gold (HMY – South Africa), Evolution Mining (EVN – Australia), Pan American Silver (PAAS – Canada), and B2 Gold (BTO – Canada).
Following what has been a 13-year bear market for gold, silver, and the gold stocks, we finally appear to be breaking out. No, we don’t want to get too excited yet as the breakout appears to be in its early stages. As for the MAG7 and the NASDAQ, they have not as yet broken their uptrend line from the 2009 financial crisis low. They have broken the 200-day MA which signals only a correction. For the GDXJ, it appears the correction is now over and a bull market that could last for years may be getting underway. GDXJ made a fresh 52-week high this past week.
It may be a bit overzealous to suggest that the huge symmetrical triangle that appears to have formed has a target up to $163, a 250% gain from current levels. Minimum targets are up to 72.
Rather than focus on the negative of the sinking stock market thanks to tariffs and government decimation in the U.S., one should focus on where opportunity lies. And right now, that opportunity lies in commodities that include predominantly gold mining stocks plus copper. Disruptions due to trade wars cause shortages and hence price increases.
The GDXJ trades in U.S. dollars on the NYSE. A possible Canadian equivalent is BMO’s Junior Gold Index ETF (ZJG/TSX). The big cap equivalent is the VanEck Gold Miners ETF (GDX/NYSE).
Markets & Trends
| % Gains (Losses) Trends | ||||||||
| Close Dec 31/24 | Close Mar 14/25 | Week | YTD | Daily (Short Term) | Weekly (Intermediate) | Monthly (Long Term) | ||
| ne | ||||||||
| S&P 500 | 5,881.63 | 5,638.94 | (2.3)% | (4.1)% | down | down (weak) | up | |
| Dow Jones Industrials | 42,544.22 | 41,488.19 | (3.1)% | (2.5)% | down | down (weak) | up | |
| Dow Jones Transport | 16,030.66 | 14,463.53 | (7.4)% | (9.0)% | down | down | neutral | |
| NASDAQ | 19,310.79 | 17,754.09 | (2.4)% | (8.1)% | down | down | up | |
| S&P/TSX Composite | 24,796.40 | 24,553.40 | (0.8)% | (0.7)% | down | neutral | up | |
| S&P/TSX Venture (CDNX) | 597.87 | 621.13 | 1.1% | 3.9% | neutral | up | neutral | |
| S&P 600 (small) | 1,408.17 | 1,279.85 | (2.7)% | (9.1)% | down | down | neutral | |
| MSCI World | 2,304.50 | 2,477.88 | (1.4)% | 7.5% | up | up | up | |
| Bitcoin | 93,467.13 | 84,281.17 | (2.4)% | (9.8)% | down | neutral | up | |
| Gold Mining Stock Indices | ||||||||
| Gold Bugs Index (HUI) | 275.58 | 342.75 | 4.9% | 24.4% | up | up | up | |
| TSX Gold Index (TGD) | 336.87 | 432.00 (new highs) | 4.3% | 28.2% | up | up | up | |
| % | ||||||||
| U.S. 10-Year Treasury Bond yield | 4.58% | 4.32% | 0.2% | (5.7)% | ||||
| Cdn. 10-Year Bond CGB yield | 3.25% | 3.09% | 1.3% | (4.9)% | ||||
| Recession Watch Spreads | ||||||||
| U.S. 2-year 10-year Treasury spread | 0.33% | 0.29% | (6.5)% | (12.1)% | ||||
| Cdn 2-year 10-year CGB spread | 0.30% | 0.50% | 16.3% | 66.7% | ||||
| Currencies | ||||||||
| US$ Index | 108.44 | 103.7 | (0.1)% | (4.4)% | down | down (weak) | up | |
| Canadian $ | 69.49 | .6963 | 0.1% | 0.2% | down (weak) | down | down | |
| Euro | 103.54 | 108.84 | 0.3% | 5.1% | up | neutral | down | |
| Swiss Franc | 110.16 | 112.98 | (0.6)% | 2.6% | up | neutral | neutral | |
| British Pound | 125.11 | 129.33 | flat | 3.3% | up | neutral | neutral | |
| Japanese Yen | 63.57 | 67.28 | (0.5)% | 5.8% | up | up (weak) | down | |
| Precious Metals | ||||||||
| Gold | 2,641.00 | 3,001.10 (new highs) * | 3.0% | 13.6% | up | up | up | |
| Silver | 29.24 | 34.43 | 4.9% | 17.8% | up | up | up | |
| Platinum | 910.50 | 1,013.20 | 4.8% | 11.3% | up | up | up (weak) | |
| Base Metals | ||||||||
| Palladium | 909.80 | 973.40 | 1.9% | 7.0% | neutral | neutral | down | |
| Copper | 4.03 | 4.90 | 4.0% | 21.6% | up | up | up | |
| Energy | ||||||||
| WTI Oil | 71.72 | 67.18 (new lows) | 0.2% | (6.3)% | down | down | down | |
| Nat Gas | 3.63 | 4.09 (new highs) | (6.6)% | 12.7% | up (weak) | up | neutral | |
Down, down, down we go. Tariff wars, attacks against the judiciary and media, plus general chaos and volatility sent markets tumbling once again. We couldn’t help but notice that the talking heads at CNBC were forced to recognize that gold was rising as the markets were falling. This is not the way things are supposed to be. MAG7 all the way ^NOT. As we were taught in economics, tariff wars are lose-lose for everyone.
It’s almost as if the current White House administration thought they could put them on and everyone would thank them. Unfortunately, as we learned painfully in the 1930s after Smoot-Hawley, that’s not how things work. We also can’t help but notice that trade wars are often followed by real wars. Now we are also seeing relentless attacks on the U.S. judiciary and media. A darker turn, as once again we saw in the 1930s.
Somehow, they averted a government shutdown when a sufficient number of Senate Democrats voted with the Republicans to prevent the shutdown. It was seen as bipartisan success, even though the funding bill was also a bit of a poison pill. However, it unleashed a potential civil war in the Democrat party. The CNN Fear & Greed Index is last at 21, indicating extreme fear. We live in chaotic times.
On the week, it was pretty well down, down, down. The S&P 500 fell 2.3%, the Dow Jones Industrials (DJI) was down 3.1%, the Dow Jones Transportations (DJT) lost 7.4%, and the NASDAQ fell 2.4%. Not spared was the S&P 400 (Mid), which dropped 2.0%, while the S&P 600 (Small) was off 2.7%. In Canada, the TSX was spared, thanks to commodities but still fell 0.8%. However, in a miraculous recovery the TSX Venture Exchange (CDNX), home to many of the junior penny mining stocks, rose 1.1% and is the only index we can find in North America up on the year.
In the EU, the London FTSE fell 1.1%, the Paris CAC 40 was off 1.1%, the German DAX was off 0.1%, and the EuroNext was down 0.6%. Europe is holding up better, thanks to defense stocks. In Asia, we even had gains as China’s Shanghai Index (SSEC) rose 1.4%, the Tokyo Nikkei Dow (TKN) was up 0.5%, and Hong Kong’s Hang Seng (HSI) was off a small 0.2% after a good up the previous week. The MSCI World Index fell 1.4% and Bitcoin, the supposed safe haven as some preach, fell 2.4% and briefly under $80,000.
My colleague Mike Ballanger of GGM Advisory pointed out an interesting comparison in his most recent missive. We summarize (thanks, Mike). The 1960s was a chaotic time, starting with the assassination of President John F. Kennedy. It was a shock to my generation (yes, I’m a baby boomer—I still remember the day). Then we had more assassinations: Malcolm X, Martin Luther King, and Bobby Kennedy. The odds of four major political figures being assassinated in such a short period of time in a major democracy are astronomical.
We also had Vietnam and race riots and—no surprise—a growing divide in America that seems to be peaking today. Eventually, we also had Watergate and the stagflation 70s. At the end of the period, along came Reagan and “it’s morning again in America,” even as that slogan was for the 1984 election, not the 1980 election. Today we have “Make America Great Again.”
Reagan had David Stockman and supply side economics. Trump has Scott Bessent but, more importantly, we have the chainsaw-wielding Elon Musk causing destruction wherever he goes. Reagan had no equivalent. Reagan faced soaring interest rates when he came to power, which was then the deepest recession seen since the Great Depression. Reagan’s poll numbers were in the sewer. After the stock market plunged 24% (DJI) in 1981–1982, they turned on the money spigots in order to save the day for the 1982 mid-terms.
What happened over the next number of years, which also included the George H.W. Bush presidency, was at the time an unprecedented increase in the U.S. debt. That was especially the case since it wasn’t wartime. Or maybe it was. The Soviet Union blew itself up and collapsed in 1989. America seemingly won the cold war. The stock market collapse of the early 1980s, coupled with soaring interest rates, bankrupted many. Nonetheless, the stock market soared once the spigots were opened, despite the nasty interruption in October 1987.
Have the spigots been turned off? Well, not completely. M2 is rising again and M1 is trying to turn up. The U.S. economy grew 2.5% in Q4, the last quarter of the Biden administration. The Atlanta Fed is suggesting Q1 could fall as much as 2.8%. The economy grew throughout the Biden administration, even as it dealt with the pandemic and rising inflation, thanks partially to the oodles of money floating around plus supply chain disruptions. Interest rates were slashed during the pandemic but rose as inflation rose.
Reagan came to power just before the great rise of the stock market that came out of the 1982 recession and major stock market low. Trump has come to power at the top of the market, one dominated by a handful of stocks known as the MAG7. It reminds us of the peak of the dot.com frenzy in 2000. Markets fell 50% over the next two years.
Trump is promising that this is temporary and then, once things settle down and they successfully complete their trade wars and applying chainsaws to the government, we will enter a period of economic nirvana. The reality is it is more likely to be a repeat of the 1930s, with not only growing conflicts between countries but also the steady rise of fascism.
The sharp rebound on Friday signals to some that the bottom is in. We highly doubt that. It’s more like a dead cat bounce. We might get back to the 200-day MA near 5,750. But we figure that would be about it. A test of the 200-day MA once we have broken down is not unusual. The key zone on the downside is 5,400. If that breaks, a panic could set in. To even begin to suggest a bottom, we’d have to get back over 6,000. We don’t see that happening. Hold cash, government bonds, and gold.
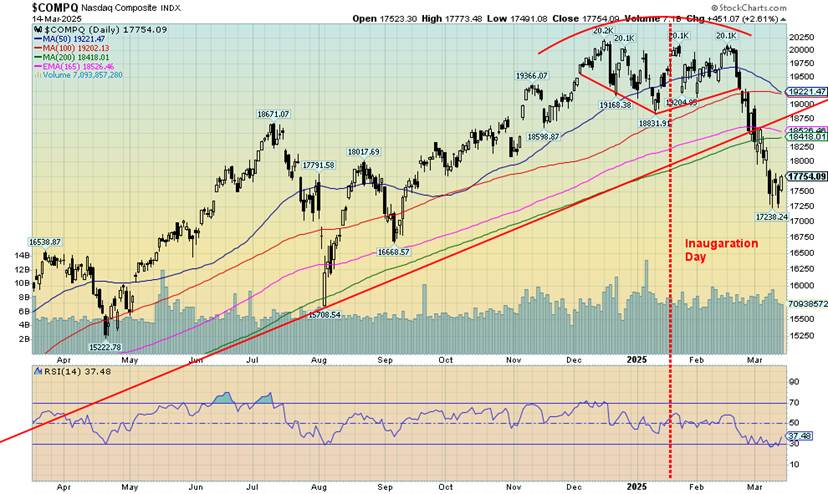
The NASDAQ fell deeper into correction territory this past week as it dropped 2.4% and is now down 8.0% in 2025. At the low seen this week, the NASDAQ was down 14.9% from its high in December 2024. The MAG7 wasn’t helping as Apple was the biggest loser, down 10.8%. Tesla fell 4.8% and is down 38.1% in 2025. The NY FANG Index fell 0.4% and is down 8.1% in 2025. Holding the FAANGs up was Nvidia, up a stellar 7.9% this past week and bucking the downtrend. Still, Nvidia remains down 9.3% in 2025.
The NASDAQ was oversold at the recent low with an RSI under 30. However, the penetration of 30 was brief, thanks to the bounceback at the end of the week. The NASDAQ has broken support levels at the 200-day MA. A rebound could take us back to that level, currently at 18,418. But looming below is the next support to break at 16,670. The NASDAQ is breaking down and, unless we make a spike low (a possibility) à la August 2025 and September 2025, we could continue to move lower. The background noise remains loud with tariffs, threats, and a looming recession.
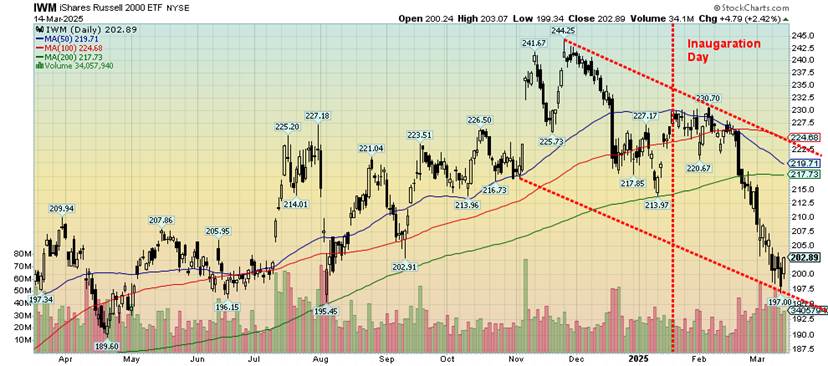
Here’s the Russell 2000. It’s a small cap stock index containing what could be the next Amazon or Google. It has taken quite a tumble, down 17% from that high in November 2024. As with the others, inauguration day resulted in a top pattern and when the downward thrust started it just fell. Note, as with the others, the series of waterfalls. A bounce may be starting as the IWM became oversold at the low. However, we don’t have any sign of a bottom.

Here’s the Roundhill Big Tech ETF (MAGS) once again. MAGS is a proxy for the MAG7. Is it the leader? MAGS fell into a bear market this past week when it officially broke 20% from that December 2024 high. Let’s call it the leading indicator just as it was on the way up. Yes, a bounce may be underway here, but there is resistance up to $50. A break once again of $46 would send MAGS to new lows. The leader to the downside has been Tesla, off 38% in 2025 and down almost 56% from its December 2024 high at its low this past week. Seems that more than the Tesla car dealerships are getting burned. Shareholders too.
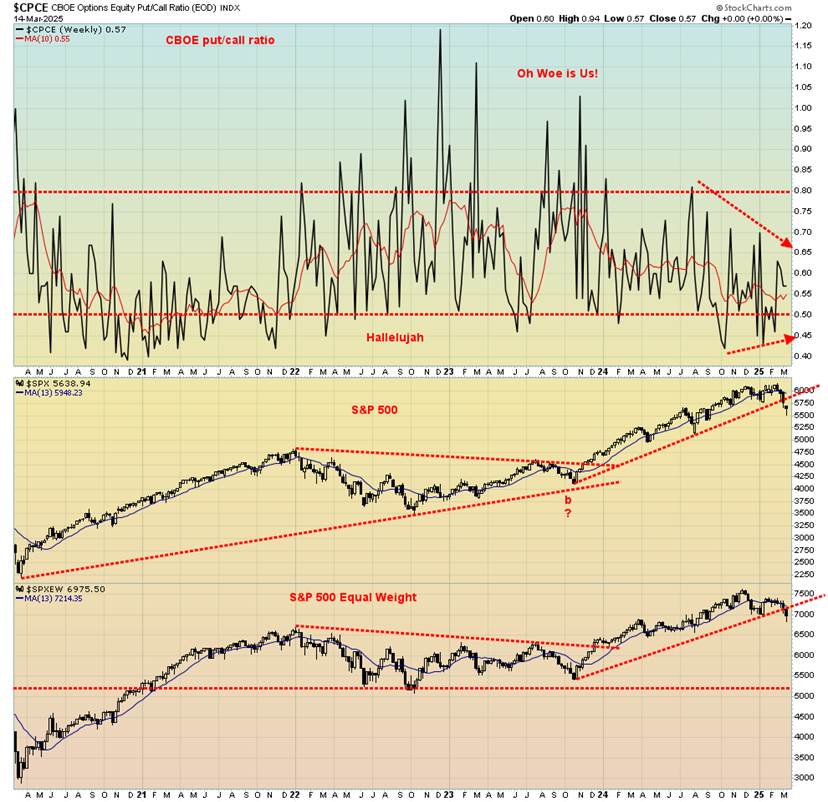
While many indicators are bearish, with breadth indicators falling and bullish percent indices also falling, we were surprised to see that the put/call ratio is still a neutral 57. To get bearish readings we need to get over 80. Bullish readings are under 50.0. The CNN fear and greed indices are also registering extreme fear, including the put/call ratio which they suggest is over 80. We’re just not seeing it on this chart. If this is correct, then markets need to fall further to get the put/call ratio over 80.
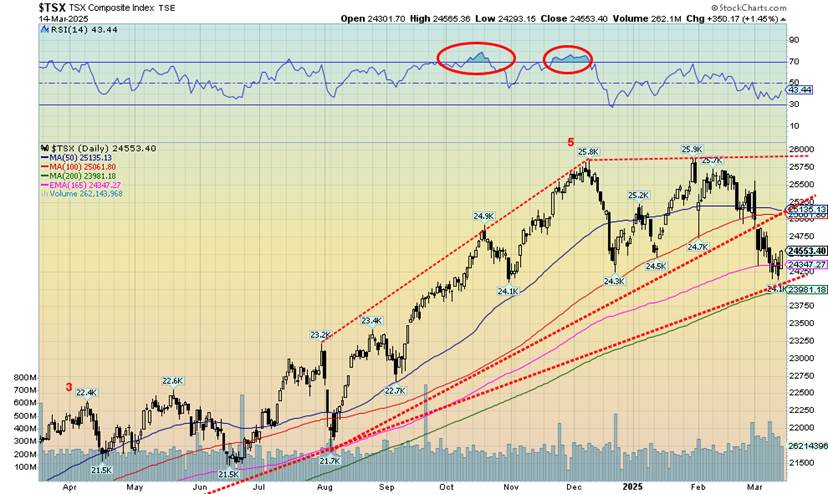
For the TSX Composite they can say thank God for the strong commodities sector. Without it, the TSX Composite might have fallen more in line with the S&P 500 or DJI. Instead, while the TSX did fall 0.8%, it held up thanks to the performance of the commodity sector. Of the 14 sub-indices, five were up and nine were down. Leading the way to the upside were Golds TGD, up 4.3%, while Materials TMT gained 4.0%, Metals & Mining TGM was up 3.1%. and Energy TEN was up 3.1% as well. Utilities TUT gained a small 0.3%. To the downside, Consumer Discretionary TCD was the big loser, off 4.6%. Financials TFS, the largest TSX component, fell 1.9%.
Consumer Staples TCS was also a big loser, off 3.7%, while Information Technology TTK fell 3.0% and Telecommunications TTS was off 2.9%. If there was something to cheer about this week it was the TSX Venture Exchange (CDNX), which defied all the negativity and rose 1.1%. We are seeing some life in the junior gold mining and mining stocks that dominate the CDNX. The TSX 60 fell 1.1%, more than the TSX itself. The TSX 60 isn’t as dominant for the commodity stocks that helped dampen the decline for the broader TSX Index.
U.S. 10-year Treasury Note, Canada 10-year Bond CGB
Long interest rates crept higher this past week. The yield on the 10-year U.S. treasury note rose to 4.32%, up a small 1 bp. Canada’s 10-year Government of Canada bond (CGB) was up to 3.09% or 4 bp. While the University of Michigan Sentiment Index fell this month (preliminary), the Inflation Expecations came in at 4.9% in March. The bond market centered on that one. Expectations remain that Fed will do nothing this week at the March 18–19 FOMC. Expectations also fell to only two rate cuts in 2025 vs. three previously.
The trade wars are not helping and a falling US$ Index has spooked holders of U.S. bonds. Not only were treasuries being sold but credit spreads were widening, an early sign that the ongoing trade wars and chaos will spill into the bond markets. As well we are seeing fund flows go to the EU out of the U.S. Hundreds of small and regional banks are experiencing stress and could fail from losses due to commericial real estate, consumer real estate, and higher interest rates.
We haven’t seen any major banks fail since 2023 when Silicon Valley Bank (SVB), Signature Bank, and First Republic went down. Nonetheless, the consulting firm Kairo Group noted that 282 banks are having deep problems. We are not hearing of any problems at the big money center banks; i.e. the banks considered too big to fail. Since the 2008 financial crisis, they are better capitalized. The 2–10 spread in the U.S. fell to 29 bp from 31 bp while in Canada the 2–10 spread was 50 bp vs. 43 bp. Recession watch is still on.
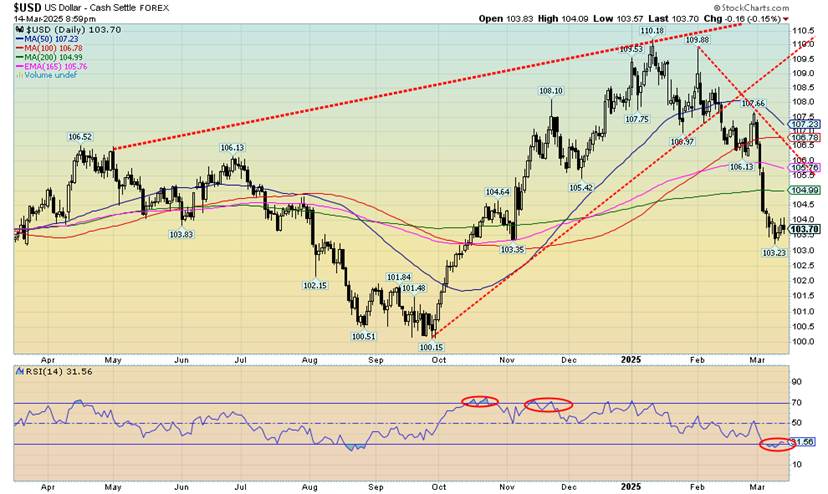
The U.S. dollar continues its recent devaluation as the US$ Index fell a mild 0.1% this past week. We did bounce back at the end of the week, but so far it’s a weak response. We are also oversold with an RSI that dipped under 30. Our best hope for a bounce is back to the 200-day MA near 105.00. We’d have to get up through 105.80 to suggest a breakout and a low. We are at some support with that low seen last November at 103.35.
A breakdown under that level could take us down to 100. A falling US$ Index is positive for U.S. exports and eases some pain of having borrowed in U.S. dollars with a different home currency. The low movement for the US$ Index this past week means the currencies weren’t actually a ball of fire. The euro was up 0.3% but the Swiss franc fell 0.6%, while the pound sterling was flat and the Japanese yen fell 0.5%. The Cdn$ gained 0.1% on marginally higher oil prices and the election of Mark Carney as the new prime minister.
Another day, another record for gold. Gold is a go-to safe haven in times of economic uncertainty, geopolitical tensions, and loss of faith in governments. The result was a 3.0% gain for gold this past week and a close at the magical $3,000. Normally we’d have to say that these landmark points are points of resistance. We saw it at $1,000 and $2,000. We’d break through, then there’d be a pullback, sometimes a spooky one. There are a lot of nervous nellies on this ride and they’ll hit sell on any little down gyration.
With an RSI at 66 we seem to have room to move higher. But then the current RSI is diverging negatively with the one seen earlier when gold hit $2,974. Then there was a 4.5% drop. Nothing goes straight up. A choppy rise is preferable to a straight up rise. We could be forming what appears to us as a potential rising wedge triangle or ascending wedge triangle. We seem to have room to get to $3,050 or even $3,100 before pulling back. The triangle appears to break down under $2,925 and if that happens it could take us down to $2,760.
Other precious metals rose this past week. Silver was up 4.9%, while platinum gained 4.8% and is back over $1,000. Near precious metals saw palladium up 1.9% and copper gaining 4.0% as it marches towards $5.00. The gold stocks gained as the Gold Bugs Index (HUI) was up 4.9% and the TSX Gold Index (TGD) gained 4.3%. Gold is now up 13.6% in 2025 and silver 17.8%. Compare that to the TSX down 0.7% and the S&P 500 down 4.1% in 2025.
Gold is benefitting from the chaos in the U.S. with tariffs, threats against judges and media, and threats to annex Canada, Greenland, and the Panama Canal. Is the U.S. constitution in trouble? There has been constant talk of lowering the value of the U.S. dollar (note: it’s already happening). One way would be to revalue gold upward just as they did at the height of the Great Depression. We note the gold held in Fort Knox still sits on the books of the U.S. at $42.22. Despite a steady stream of central banks adding to their gold reserves, the U.S. has stood pat but still has the world’s largest gold reserves.
We live in nerve-wracking times and, while cash and bonds are good safe havens, gold is the best as it has no liability. And a reminder that cryptos are just flickers on a screen still open to hacks, theft, and money laundering. Bitcoin, after a monumental rise to over $100,000, is down 9.8% in 2025.
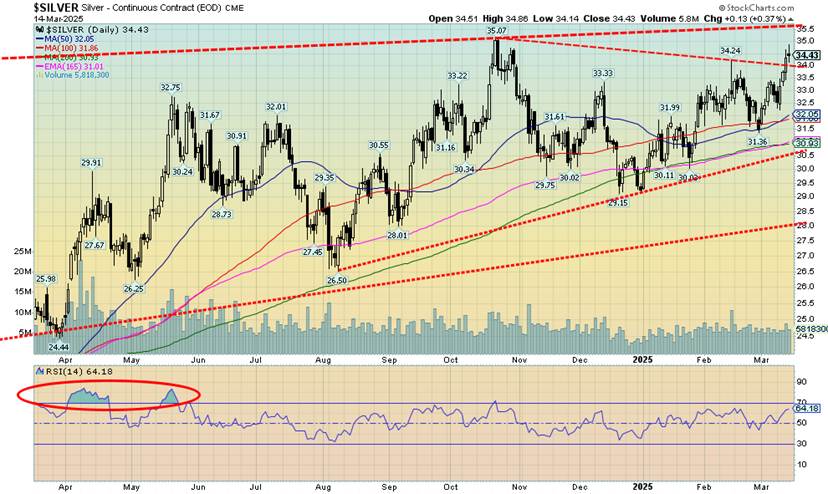
Are we finally going to see a breakthrough for silver to new highs? This week we took out $34 resistance. We also took out points that suggest we should get new highs above $35.07 seen in October 2024. All-time highs at $50 still seem remote. Nonetheless, pullbacks can be expected. As of now, the line in the sand is at $31.30, although we’d also like to see $32.25 hold on any pullback.
The RSI is at a reasonable 64 so we are not overbought at the moment, suggesting room to move higher. We break out firmly above $35.50. It has been a choppy rise for silver, with good rises offset by steep pullbacks. Silver continues to be the forgotten companion to gold. Or, as we call it, the poor man’s gold. Silver remains relatively cheap and the gold/silver ratio, currently at 87, remains quite elevated. We have seen recent buying in silver stocks, suggesting that they may be forecasting a pending rise in silver prices.
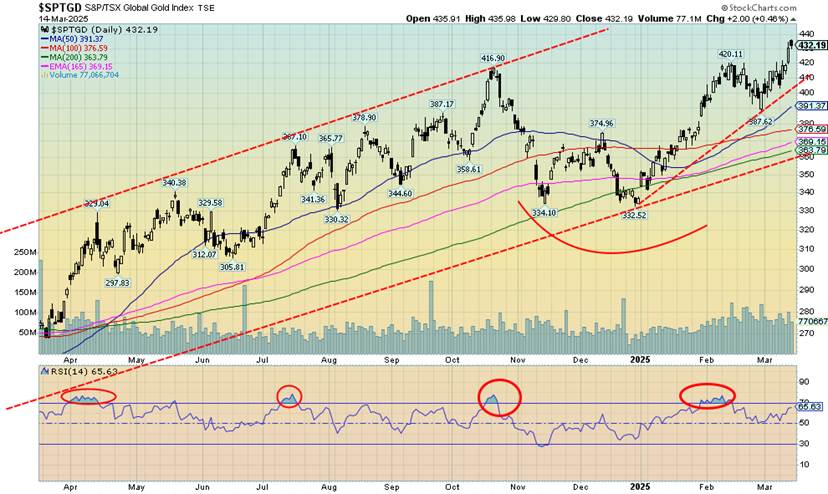
Onward and upward. Gold stocks have been the best-performing asset so far in 2025 with the Gold Bugs Index (HUI) up 24.4% in 2025, including a 4.9% gain this past week as gold prices reached record highs. The TSX Gold Index (TGD) is up 28.2% in 2025, including 4.3% this past week. Can they keep it up? We might catch pullbacks first, although the RSI on the TGD is not as yet overbought. There has yet to be a mad rush into gold stocks or even gold for that matter, despite the stellar 2025 performance and the collapse of the broader markets.
The TGD made fresh 52-week highs this past week but the HUI remains below its high. A possible divergence? We seem to have good support for the TGD down to 410, but under that we could fall to 390. We’re a long way from a major breakdown under 360. Within sight now is the all-time high for the TGD at 455. We are 5% under that level. Too bad the HUI can’t claim the same as it remains down 46% from that 2011 high. We are 14 years and counting to see new all-time highs for the gold stocks once again.
A reminder that it took 25 years for the DJI to regain its 1929 high and 34 years for Japan’s Nikkei Dow to regain its high. It took roughly seven years for the DJI to regain its 2007 high. It is possible we have made a temporary top, especially if gold falters at $3,000 resistance, which is a distinct possibility. Support levels then become important. We wouldn’t want to see the TGD break under 388, the most recent low.
Source: www.stockcharts.com
Oil prices were up modestly this past week, despite the turmoil in behind, a bit of a glut worldwide, and all quiet on the geopolitical front. WTI oil rose 0.2% while Brent crude was barely ahead, up 0.3%. Natural gas (NG) at the Henry Hub fell 6.6% while NG at the EU Dutch Hub rose 9.0%. We should also note NG at the Alberta Hub that trades at considerably lower prices. As reported by the Alberta Energy Co. (AECO), the latest NG price was last at Cdn$2.34 or US$1.63, well below the price at the Henry and Dutch Hubs. Alberta sells its NG at a deep discount to everyone else. Alberta gas is the Henry Hub less transportation costs, which can be considerable.
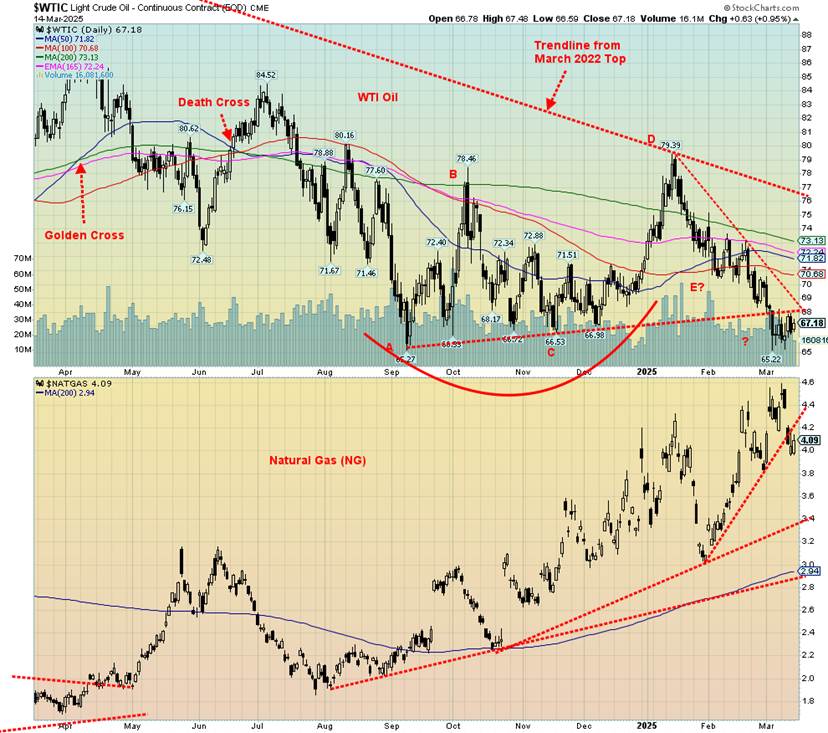
First, oil. Both WTI and Brent traded in a tight range this past week, even as prices rose for the first time in a month. Concerns over the tariffs wars plus a forecast by the IEA slahing demand for 2025 was the damper.
Concern over the Trump-proposed Russia/Ukraine peace agreement plus an upping of sanctions against Iran and finding ways to stop Russia’s ghost ships of oil were the factors giving support to oil prices.
Since our breakdown under $68, follow-through has been mute. This suggests to us that a collapse to $52 may not happen. We did make a marginal new low at $65.22 but rebounded from there to close at $67.18. Still, we need to break back over $68 and then above $73 to suggest to us that a low is in. A major breakout doesn’t occur until over $76, but to be safe we’d like to see it over $80. The recent low must hold but this week’s, small as it was, reversal was encouraging for oil.
The energy stocks responded with a good up week as the ARCA Oil & Gas Index (XOI) rose 2.6% while the TSX Energy Index (TEN) was up 3.1%. The good week for the energy stocks suggests to us that the next move for oil should be up. Storage levels are near the bottom of their five-year range, suggesting a need to replenish.
NG at the Henry Hub was pushed lower due to milder weather following a period of cold weather. There was also an increase in production. Storage levels, however, remain low near 27% suggesting that re-filling is needed. In the EU they got hit with colder weather plus ongoing concerns over the Russia/Ukraine cease fire. The odds of a quick fix for the war and restoration of Russian gas flows to the EU are low. NG broke an uptrend line, suggesting we could see lower prices ahead.
The end of the week brought an attack by the U.S. against the Houthis of Yemen. There was also threats made towards Iran. As we have noted before an attack on Iran (the world’s seventh largest oil producer, the world’s fourth largest oil reserves, the world’s third largest natural gas producer, and, the world’s second largest natural gas reserves) could spark sharp increases in the price of oil and gas. Iran also sits adjacent to the Gulf of Hormuz where 30% of the world’s oil passes through.
__
(Featured image by Ian Taylor via Unsplash)
DISCLAIMER: This article was written by a third party contributor and does not reflect the opinion of Born2Invest, its management, staff or its associates. Please review our disclaimer for more information.
This article may include forward-looking statements. These forward-looking statements generally are identified by the words “believe,” “project,” “estimate,” “become,” “plan,” “will,” and similar expressions, including with regards to potential earnings in the Empire Flippers affiliate program. These forward-looking statements involve known and unknown risks as well as uncertainties, including those discussed in the following cautionary statements and elsewhere in this article and on this site. Although the Company may believe that its expectations are based on reasonable assumptions, the actual results that the Company may achieve may differ materially from any forward-looking statements, which reflect the opinions of the management of the Company only as of the date hereof. Additionally, please make sure to read these important disclosures.
Copyright David Chapman 2025
David Chapman is not a registered advisory service and is not an exempt market dealer (EMD) nor a licensed financial advisor. He does not and cannot give individualised market advice. David Chapman has worked in the financial industry for over 40 years including large financial corporations, banks, and investment dealers. The information in this newsletter is intended only for informational and educational purposes. It should not be construed as an offer, a solicitation of an offer or sale of any security.
Every effort is made to provide accurate and complete information. However, we cannot guarantee that there will be no errors. We make no claims, promises or guarantees about the accuracy, completeness, or adequacy of the contents of this commentary and expressly disclaim liability for errors and omissions in the contents of this commentary. David Chapman will always use his best efforts to ensure the accuracy and timeliness of all information. The reader assumes all risk when trading in securities and David Chapman advises consulting a licensed professional financial advisor or portfolio manager such as Enriched Investing Incorporated before proceeding with any trade or idea presented in this newsletter.
David Chapman may own shares in companies mentioned in this newsletter. Before making an investment, prospective investors should review each security’s offering documents which summarize the objectives, fees, expenses and associated risks. David Chapman shares his ideas and opinions for informational and educational purposes only and expects the reader to perform due diligence before considering a position in any security. That includes consulting with your own licensed professional financial advisor such as Enriched Investing Incorporated. Performance is not guaranteed, values change frequently, and past performance may not be repeated.


Crypto Markets Edge Up as Caution Persists and April Fools’ Scams Loom
Bitcoin and Ethereum rise slightly amid geopolitical easing and renewed ETF inflows, with BTC near $68,000 and ETH above $2,100....


Lowryder: The Autoflowering Revolution in Cannabis Cultivation
Lowryder is a groundbreaking cannabis strain that introduced autoflowering, allowing plants to flower automatically without light changes. Created by The...


Casablanca Climbs the Global Financial Ranks
Casablanca has risen to 49th in the Global Financial Centres Index, strengthening its position as Africa’s top financial hub. It...


Crypto Lending Hits $30 Billion, Becomes Key DeFi Pillar
The decentralized crypto lending market has surpassed $30 billion, signaling a structural shift in capital use. Protocols like Aave and...


Advances in LDL Cholesterol Management for Familial Hypercholesterolemia: From Statins to Innovative PCSK9 and CETP Inhibitors
PCSK9 inhibitors have transformed LDL cholesterol management in familial hypercholesterolemia, with new antibodies and CETP inhibitors like obicetrapib expanding options....
 |
|
 |  |
 |
|
-

 Fintech2 weeks ago
PayPay Targets Global Expansion After Landmark IPO
-

 Impact Investing2 days ago
Italian Unlisted Banks Lag on ESG Sustainability
-

 Crypto1 week ago
The Iran War Tests Bitcoin and Crypto Market Resilience
-

 Crypto7 days ago
Crypto Markets Volatile as Bitcoin Hovers, Solana Eyes AI Integration