Markets
Trump Euphoria Peaks: Markets High on Nov 11, But Signs of a Reversal Loom
The “Trump euphoria” market hit a new high on Nov 11 but reversed, closing the week lower. While not a key reversal, concerns arise about peaking. Narrow credit spreads signal overvaluation. Rising interest rates and a stronger US$ pressured precious metals, though long-term prospects remain solid despite potential short-term weakness lasting into December.

It is inflation week in the U.S. as both the CPI and the PPI came out. The October CPI did not surprise, even as it ticked higher. The CPI came out as 2.6% year-over-year (y-o-y) which was as expected vs. Septembers 2.4%. It was the first monthly rise since December 2023. The PPI came out higher than expected at 3.1% y-o-y vs. the expected 2.8% and September’s 2.9%. It was the first rise since June 2024.
So, is inflation on the rise again? One month does not a new trend make. But nothing has stopped bond yields from rising. These numbers do not reflect what might occur under a Trump administration. Trump policies of tax cuts, tariffs and expelling illegal immigrants are all potentially inflationary. That in turn could push bond yields higher and force the Fed to once again raise interest rates.
Bond yields rose 29% in the early years (2017–2018) of the first Trump administration after the huge tax cuts plus an array of tariffs. The current proposals for taxes and tariffs are larger than what was proposed during the first Trump administration. That in turn could spark a rise in U.S. treasury yields.
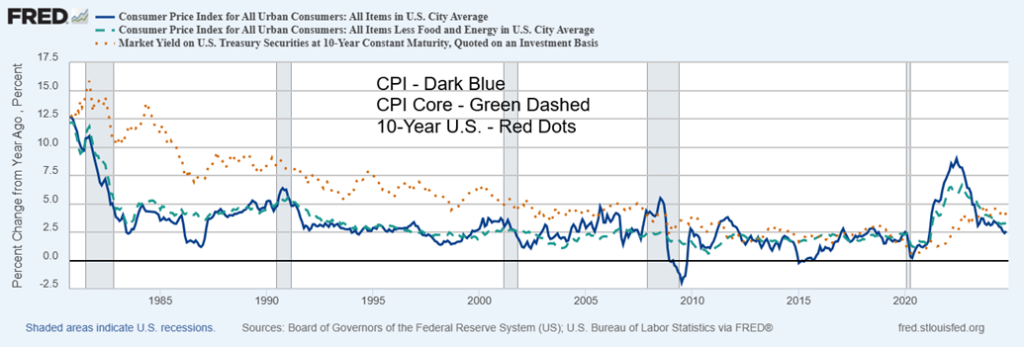
As we have noted, bond yields today are considerably higher than they were in 2021 when the Biden administration took over up some 400%. The benchmark 10-year U.S. treasury yield today, for the first time since the lows in 2020, is actually higher than the rate of inflation. A positive yield curve. A reminder that, while the Fed controls the short end of the market through the Fed rate and open market operations, it does not control the bond market. The new administration should keep that in mind with their talk of controlling the Fed or even eliminating it, a move that could spark a global financial crisis. The banks that actually are the owners of the Fed might have something to say about all that.
In 1907, there was the first global financial crisis known as the Panic of 1907, also known as the Knickerbocker crisis, following the collapse of the stock market of more than 50%. After that event, the Fed was created, although it took another six years for it to actually come into being. Organized by the banks and led by J.P. Morgan, the Fed was designed to control financial crises with a backstop. This was seen most notably during the 2008 financial crisis, ironically just over 100 years after the Panic of 1907.
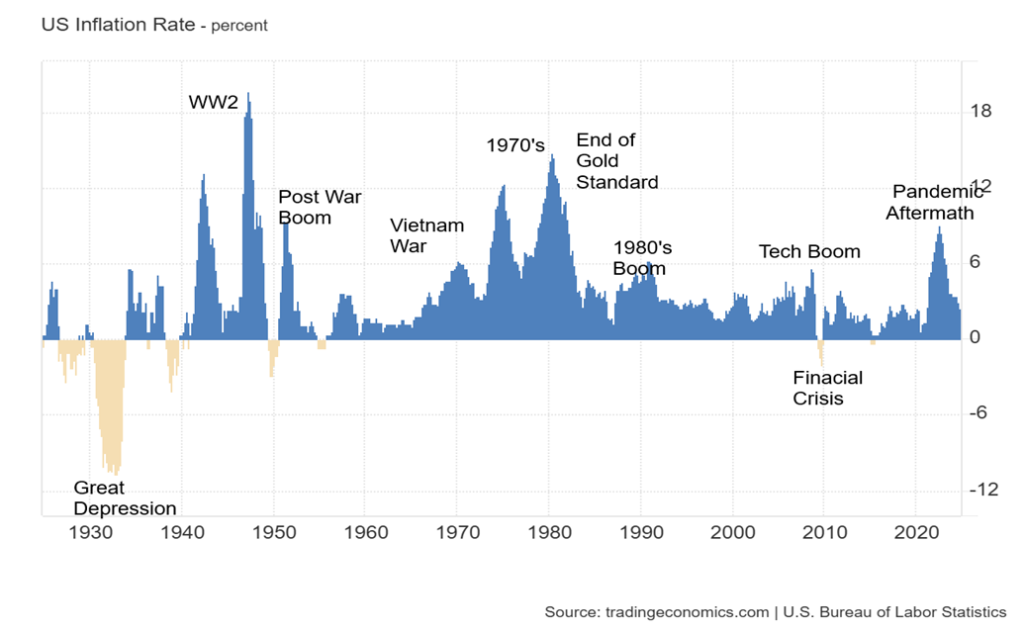
The potential policies of the Trump administration could be quite inflationary. It is noteworthy that there is some history of a period of inflation followed by a downward drift in inflation, only to have it rise a second time. Our opening chart shows that inflation started rising in 1941 before peaking in 1942. It coincided with the outbreak of World War II. After peaking, it fell sharply into 1944. Then came the second wave, which covered most of the post-war boom.
That peaked in 1947 at almost 20% and well above the peak of 1942. Fast forward to the 1970s. The Vietnam War unleased a huge bout of inflation that started in 1972, peaking at about 12% in 1974. Inflation fell but started rising again in 1977 before peaking at over 14% in 1980. That was all due to the rise in oil prices, which were a much larger part of the economy than they are today, and culminating with the Iranian hostage crisis.
There was a mini-rise in inflation in the late 1980s, but after that inflation was largely benign—that is, until the pandemic of 2020. That sparked global supply disruptions and unleashed a torrent of money to prevent the world from falling into a depression, as happened during the Spanish flu of 1918–1920 and the exceptionally deep recession (depression?) in 1921. The sharply lower interest rates and torrent of money following the pandemic worked in averting a depression.
However, they unleashed inflation as well as a stock market and housing mania which started in 2021 and then peaked in June 2022 at just over 9%. In response, the Fed hiked interest rates to combat the inflation. Inflation fell 6.5% to the current levels, but the 10-year is down only about 1% from its peak in October 2023. Current rising bond yields are a signal that the bond market is not so confident with the potential proposals of tax cuts and tariffs. As noted, the Fed can control the short end of the curve, but beyond that the bond market rules.
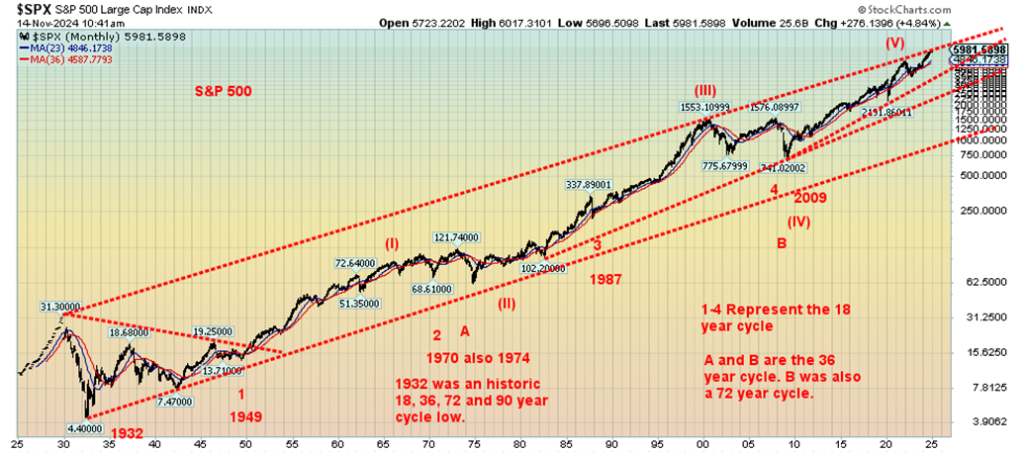
So, what does all this mean for the stock and housing markets that soared following the pandemic? The housing market is already teetering with house prices coming down for the first time in years. The stock market is overvalued. The euphoria from the election of Donald Trump just made the stock market even more overvalued. As an observer of cycles, Merriman cycles (www.mmacycles.com) notes an 18-year (range 15–21 years) cycle for stocks. The longest cycle noted by Merriman is 72 years (range 60–84 years), of which the 18-year cycle is a sub-cycle of the larger cycle. The 72-year cycle last bottomed in 2009, 77 years after the Great Depression low in 1932. We believe we are in the next 72-year cycle and approaching the peak of the current 18-year cycle. There are four 18-year cycles in the 72-year cycle.
Merriman also noted the potential for a 90-year cycle (range 75–105 years), so there is some overlap with the two. Ninety years is, coincidently, 18 years from 72 years. That cycle is often a severe recession, but there have only been two observations since 1790: first in 1843 and then 1932. Both were depressions. The next 90-year cycle is due in 2022 +/- 15 years or 2007-2037). The last 18-year cycle bottomed in 2009, so the next one is due in 2024–2030. Naturally, that overlaps with the 90-year cycle, and right now we are in the heart of it with a mania in the stock market and Bitcoin. It’s always difficult to pinpoint the crest as it can lean left or right of the centre point, in this case 2022. Currently it appears we could have a crest as right translation.
Nonetheless, it sends a signal to us that our peak could occur anytime, given the current mania of the stock market. The Fear and Greed index is currently at greed. Buffett says to buy when investors are most fearful and sell when they are greedy. Buffett has already sold, and is sitting now on a mountain of cash, some $325 billion. Given that most valuations of the stock market are currently grossly overvalued, Buffet may have a point.
We noted in our November 11 Scoop that this is 2024, not 2016. We are in a completely different place. The warning signs are there. Caveat emptor.
“The one thing we learn from history is that nobody learns from history.”
- Warren Buffett
Chart of the week
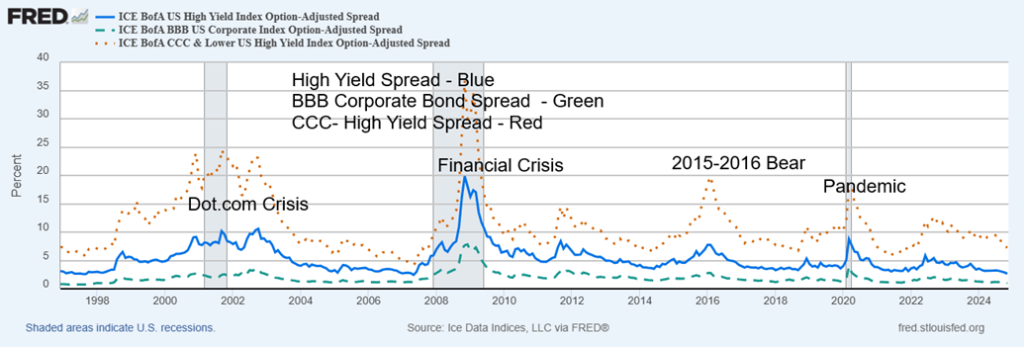
In another sign of a dangerous and overvalued market, yield credit spreads between U.S. Treasuries and high yielding corporate bonds have rarely ever been so low. Based on just the above, current spreads are lower than they were in 2000 at the time of the dot.com crash, lower than before the financial crisis, lower than before the mini-bear of 2015–2016 and lower than before the pandemic.
Currently, CCC and lower corporates (junk bonds) are sitting at 725 bp, and at 264 bp for high yield total (junk bonds but not CCC and lower) and BBB lowest investment grade bonds. This is the sign of a very dangerous market as they really only have one way to go and that is up.
Markets & Trends
| % Gains (Losses) Trends | ||||||||
| Close Dec 31/23 | Close Nov 15, 2024 | Week | YTD | Daily (Short Term) | Weekly (Intermediate) | Monthly (Long Term) | ||
| Stock Market Indices | ||||||||
| S&P 500 | 4,769.83 | 5,870.62 (new highs)* | (2.1)% | 23.1% | up | up | up | |
| Dow Jones Industrials | 37,689.54 | 43,444.99 (new highs)* | (1.2)% | 15.2% | up | up | up | |
| Dow Jones Transport | 15,898.85 | 17,227.87 (new highs) | (0.7)% | 8.4% | up | up | up | |
| NASDAQ | 15,011.35 | 18,680.12 (new highs)* | (3.2)% | 24.4% | up | up | up | |
| S&P/TSX Composite | 20,958.54 | 24,890.68 (new highs)* | 0.5% | 18.8% | up | up | up | |
| S&P/TSX Venture (CDNX) | 552.90 | 591.22 | (3.0)% | 6.9% | down | up | down (weak) | |
| S&P 600 (small) | 1,318.26 | 1,462.97 (new highs)* | (3.0)% | 11.0% | up | up | up | |
| MSCI World | 2,260.96 | 2,327.58 | (2.2)% | 3.0% | down | up | up | |
| Bitcoin | 41,987.29 | 91,285.33 (new highs)* | 19.0% | 117.4% | up | up | up | |
| Gold Mining Stock Indices | ||||||||
| Gold Bugs Index (HUI) | 243.31 | 285.11 | (8.6)% | 17.2% | down | up | up | |
| TSX Gold Index (TGD) | 284.56 | 339.64 | (8.2)% | 19.4% | neutral | up | up | |
| % | ||||||||
| U.S. 10-Year Treasury Bond yield | 3.87% | 4.44% | 3.3% | 15.0% | ||||
| Cdn. 10-Year Bond CGB yield | 3.11% | 3.30.% | 2.8% | 6.1% | ||||
| Recession Watch Spreads | ||||||||
| U.S. 2-year 10-year Treasury spread | (0.38)% | 0.13% | 160.% | 134.2% | ||||
| Cdn 2-year 10-year CGB spread | (0.78)% | 0.10% | flat | 112.8% | ||||
| Currencies | ||||||||
| US$ Index | 101.03 | 106.73 | 1.7% | 5.6% | up | up | up | |
| Canadian $ | 75.60 | 70.96 (new lows) | (1.3)% | (6.1)% | down | down | down | |
| Euro | 110.36 | 105.32 | (1.8)% | (4.6)% | down | down | down (weak) | |
| Swiss Franc | 118.84 | 112.60 | (1.4)% | (5.3)% | down | neutral | up | |
| British Pound | 127.31 | 126.11 | (0.9)% | (2.4)% | down | down (weak) | neutral | |
| Japanese Yen | 70.91 | 64.80 | (1.2)% | (8.6)% | down | down | down | |
| Precious Metals | ||||||||
| Gold | 2,071.80 | 2,570.10 | (4.6)% | 24.1% | down | up | up | |
| Silver | 24.09 | 30.43 | (3.2)% | 26.3% | down | up (weak) | up | |
| Platinum | 1,023.20 | 943.30 | (2.4)% | (4.4)% | down | down | down (weak) | |
| Base Metals | ||||||||
| Palladium | 1,140.20 | 992.20 | (4.9)% | (17.3)% | down | up | down | |
| Copper | 3.89 | 4.31 | (1.4)% | 10.8% | down | down | up (weak) | |
| Energy | ||||||||
| WTI Oil | 71.70 | 66.92 | (4.9)% | (6.8)% | down | down | down | |
| Nat Gas | 2.56 | 2.82 | 5.6% | 10.2% | up | up | down (weak) | |
Source: www.stockcharts.com
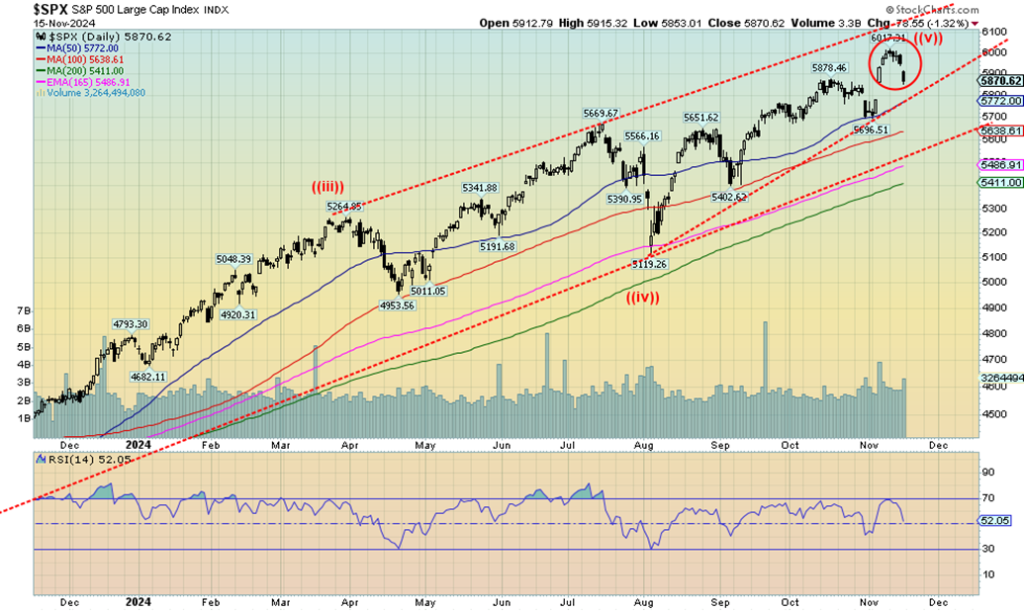
Is the honeymoon over? If so, that was the fastest we’ve ever seen. Trump was elected November 5. The next day the markets gapped higher. The peak was November 11. After that it was downhill. The market reversed and closed down on the week by 2.1% for the S&P 500 (SPX). Beware. That could be an island up there and Monday we gap down. That would be interesting and suggest a peak. After all, this has been a euphoric market and we are grossly overvalued with negative divergences everywhere. Bitcoin remained the star rising 19% to all-time highs. Promises to make the U.S. the crypto capital of the world is having an impact. But you still can’t do much of anything with Bitcoin except speculate.
Adding to the weak week was the Dow Jones Industrials (DJI) down 1.2%, the Dow Jones Transportations (DJT) off 0.7%, and the NASDAQ down 3.2%. The DJI and NASDAQ made all time highs. So did the S&P 400 (Mid) and the S&P 600 (Small) and they were down on the week 2.7% and 3.0%. The S&P 500 Equal Weight fell 1.7% and the NY FANG Index was down 2.3%. They too made all-time highs first then fell.
In Canada the TSX Composite bucked the trend and was up 0.5% after making all-time highs but the TSX Venture Exchange (CDNX) was down 3.0%. In the EU the London FTSE fell 0.1%, the EuroNext was down 0.3%, the Paris CAC 40 off 0.9% and the German DAX down 0.2%. In Asia China’s Shanghai Index (SSEC) fell 3.5%, the Tokyo Nikkei Dow (TKN) dropped 2.2% and Hong Kong’s Hang Seng (HSI) fell 6.3%. The MSCI World Index fell 2.2% and has been dropping steadily of late.
So, what sparked the reversal of fortune? Maybe it sunk in that since the Fed cut interest rates, bond market rates have done nothing but go up. The Fed meeting was Nov 7 and since then the U.S. 10-year treasury note has gone up 10 bp. The first cut came on Sep 18 and since then the 10-year is up 74 bp. That’s a rise of 20%. Not helping was Fed Chair Jerome Powell hinting that the stronger than expected U.S. economy might dampen thoughts of another rate cut at the Dec 17-18 meeting.
Also not helping is Trump’s potentially inflationary policies such as tariffs, escorting out 11 million illegals, firing 80% of the government (or 18 million employees, yes 18 million) and slashing taxes that primarily benefits corporations and the wealthy thus increasing inequality.
Ok maybe escorting out 11 million illegals and firing 18 million government employees is hyperbole but reality is that could spark serious labour shortages and that in turn is inflationary. Just escorting out 11 million illegals could spark labour shortages. Who’s going to pick the berries? If government employees who’s going to send out the social security cheques, collect taxes etc.?
Adding to the woes was inflation that perked up a bit this past week while a few economic numbers were stronger than expected. As we’ve noted before – this is 2024 not 2016. We are in a completely different space and compared to 2016 and it’s not as good as one. Maybe Trump will attempt to control the Fed but he can’t control the bond market. The Fed influences short rates but the Fed cannot control the bond market. And thus Fed rate cuts are having the opposite effect. Yes, short rates fell, but long rates have shot up. We’d be paying attention to the bond market, not the Fed rates.
Could we gap down Monday morning? It wouldn’t surprise us. That trendline is not that far away from Friday’s close of 5,870 for the S&P 500. Under 5,700 signals a short-term top. Under 5,400 a top is in. Under 5,100 panic sets in. Only new highs could keep things alive and we’re not optimistic we’ll see new highs any time soon. It could be over.
The cheerleaders at CNBC, MSNBC, Fox, CNN etc. were all agog at the leap following Trump’s election. But Friday’s close and a down week may quickly wipe that smile off their faces.
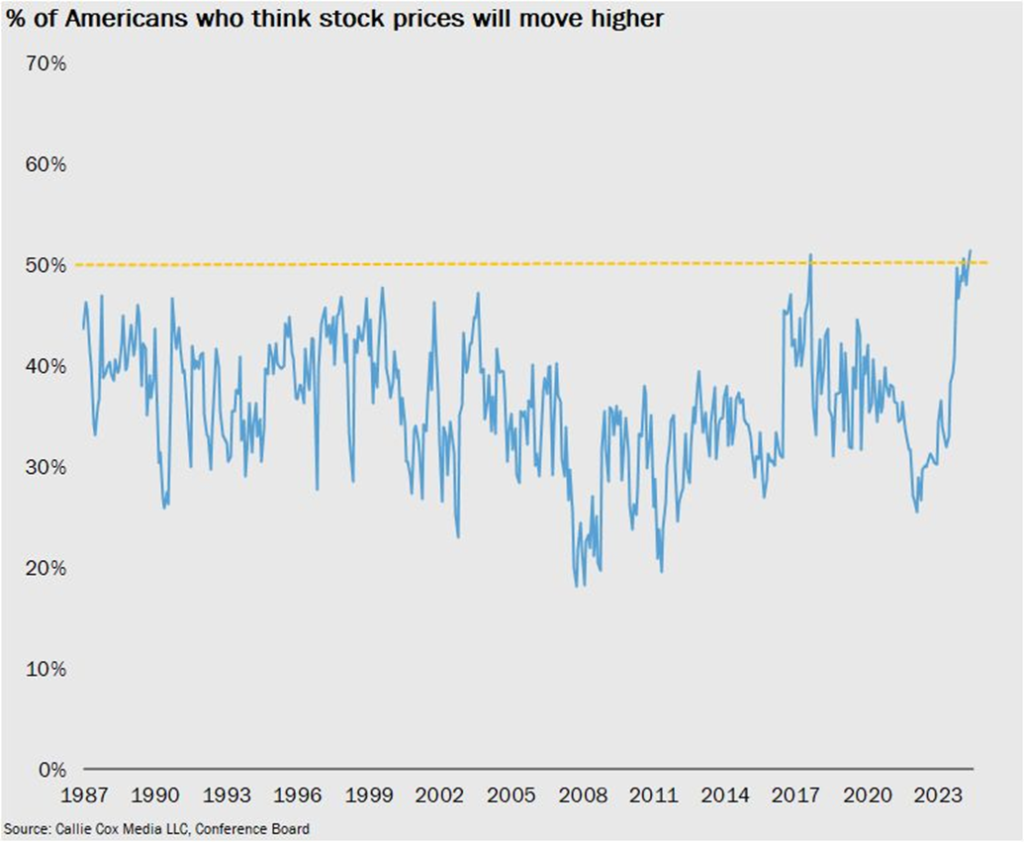
According to this survey 51.4% of investors think the stock market is going to move higher over the next 12 months. It is the highest percentage on record going back to 1987. It apparently only the third time in history it has gone over 50%. If that it is the case this is another sign of the extreme complacency in the market. This is higher than in 1999/2000 and 2007. And we know what happened back then.
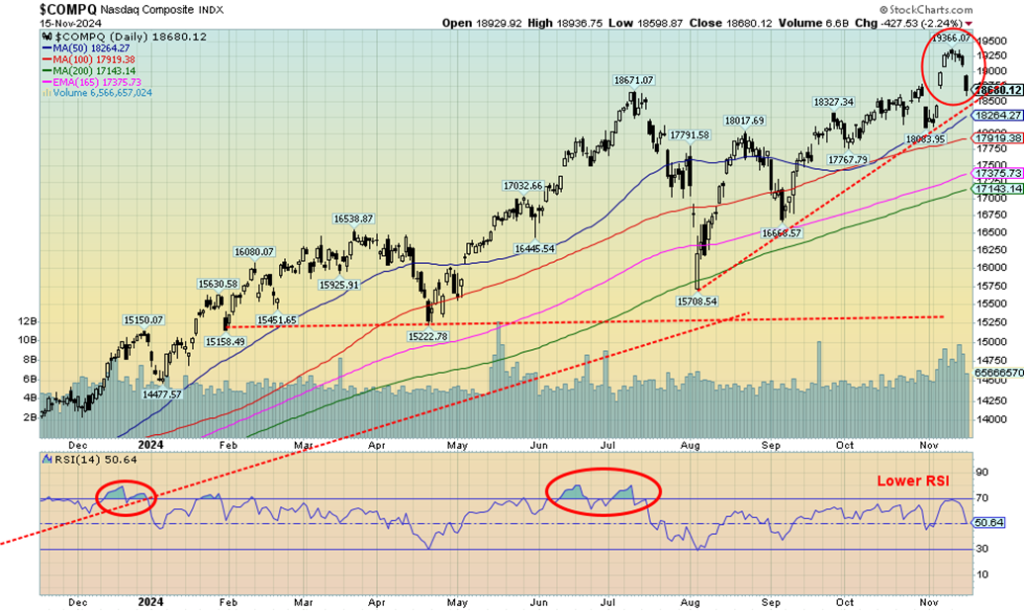
The NASDAQ made fresh all-time highs then reversed and closed lower on the week. As with the SPX the NASDAQ left a big black bearish candlestick on the charts. It was a reversal week but not a key reversal week as no lows were seen below the previous week’s lows. As usual the FAANGS/MAG7 played a role. A few all-time highs helped. Making them were Amazon, Netflix, Tesla and Nvidia.
But things didn’t go with their way as many of them made their all-time highs then reversed and closed lower on the week. So far that includes Amazon down 2.7%, Tesla down 0.2% despite making all-time highs, and Nvidia down 3.8%. But the worst performers on the week was Broadcom down 10.2% and Meta off 6.0%. Trump Media lost 11.9%. Is the bloom off Trump?
Despite the fresh all-time highs, the NASDAQ indicators diverged with earlier highs. However, all trends across time frames remain up in 2024. The question is – have we topped? We’re not that far from that uptrend line at 18,600. Below 17,900 things get worse. Long-term support is near 17,200. New highs could change the scenario but the reversal from up to down on the week should give pause.
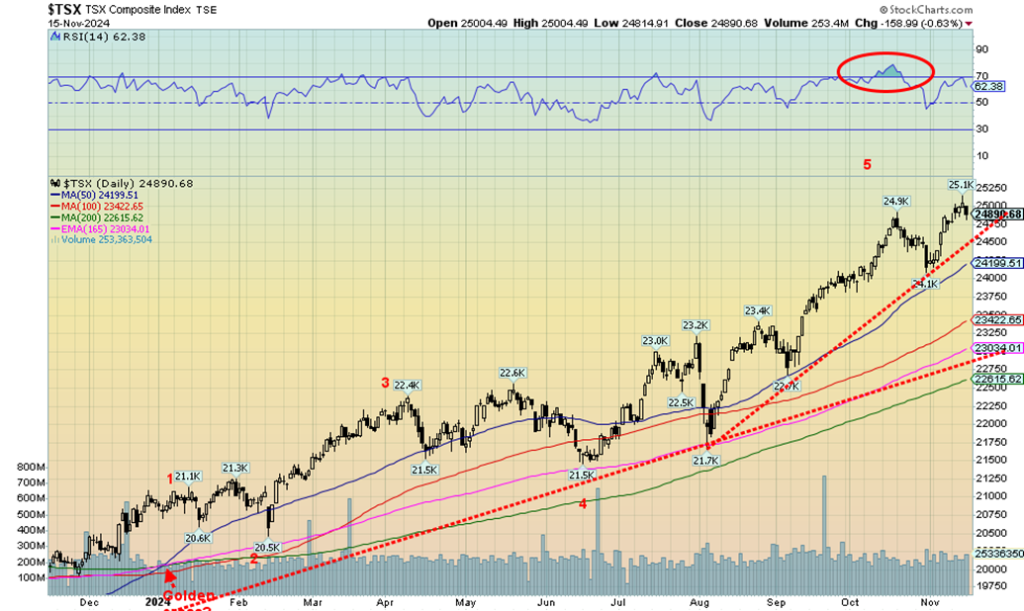
The TSX Composite bucked the negative U.S. stock indices and finished higher on the week. The TSX gained 0.5% but the blue chip TSX 60 was up 0.9%. Both made new all-time highs. Of the 14 sub-indices 9 were actually down on the week with only 5 up. But one of the up ones was Information Technology TTK up 6.7% to new all-time highs. Technology has about a 10% weighting in the composite. All other gainers were under 1.0%.
Some made new all-time highs such as Financials TFS +0.7%, Consumer Staples TCS +0.1% and Consumer Discretionary TCD down 0.1%. Of the downers Golds TGD led the way off 8.2%. Metals & Mining TGM fell 6%, Materials TMT was down 6.5% and Health Care THC was off 4.5%. So, despite the small gain on the week the overall picture was more negative.
Friday was a down day and the TSX finished down on the week despite all-time highs. Seems to be good support down to 24,500 but below the initial stop is around 24,200. If 24,000 breaks then a fall to 23,000/23,400 could occur. New highs keeps the rise alive.
U.S. 10-year Treasury Note, Canada 10-year Bond CGB
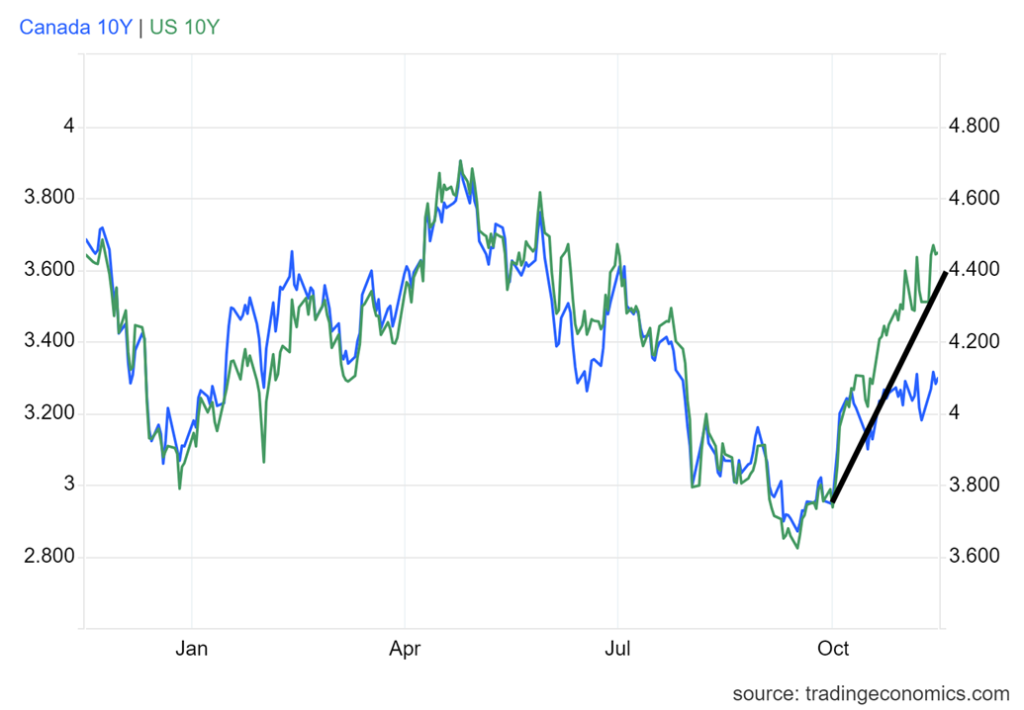
U.S. interest rates are on the rise. This past week the U.S. 10-year treasury note jumped 14 bp or 3.3%. The Canadian 10-year Government of Canada bond (CGB) was up 12 bp or 2.8%. The catalyst was concern that the Fed might not be so willing to cut given stronger than expected economic numbers and concern over Trump’s proposed policies of tariffs, expulsion of immigrants and tax cuts. All are potentially inflationary. Inflation was the subject of our opener so no need to rehash here. Initial jobless claims came in much better than expected at 217,000 vs. 221,000 last week and 225,000 expected.
The labour market remains buoyant. The four-week average of jobless claims also fell to 221,000 vs. the expected 226,000. Retail sales were also stronger. The October retail sales was 2.8% y-o-y well above the expected 1.9%. The monthly retail sales were up 0.4% vs. the expected +0.3%. The NY Empire State Index (manufacturing) was a surprisingly strong 31.2 when it was expected to be negative 5. That’s a big one. All these stronger numbers helped push longer rates higher.
Longer rates impact mortgage rates that also rose. Next week we get housing starts, existing home sales and the global PMI. We also get the final Michigan Consumer Sentiment Index.
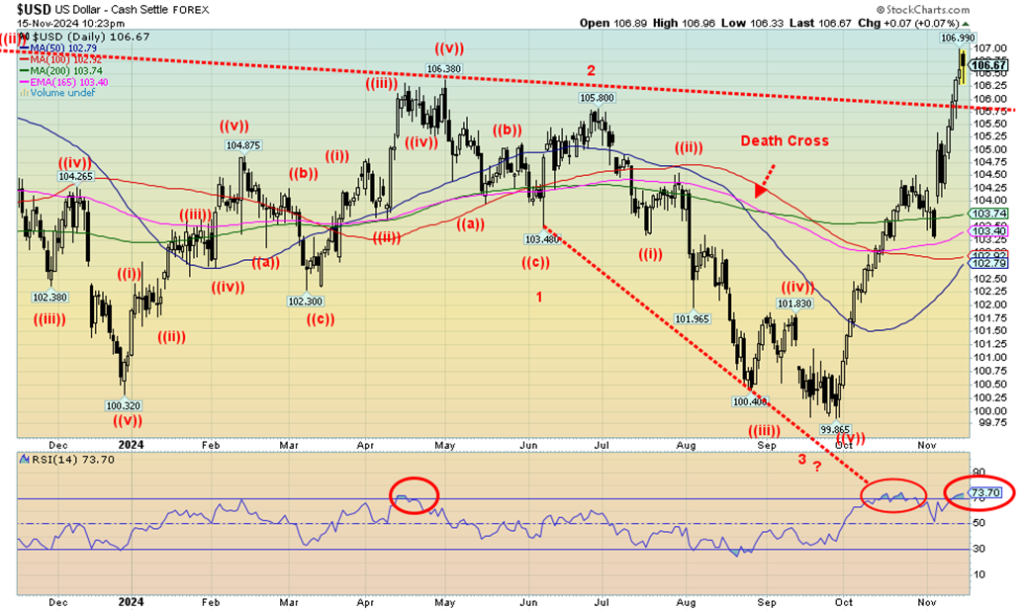
The US$ Index is on fire. Up another 1.7% this past week. It’s all thanks to some good economic numbers, and continued elation on Trump’s election. The strong US$ Index is, however, having a negative impact on gold prices. If there is a silver lining here it is that sharp upward moves like that are usually not sustainable. But right now, the US$ Index looks like it has broken out above the trendline from the September 2022 high. Irrespective we are in a resistance zone of highs seen in March and October 2023 and April 2024 that ranges between 106 and 107.
A strong move above 107 could set the US$ Index on a run towards that September 2022 high of 114.75. We doubt that could happen without at least a correction of some sort. The move has been straight up from the October 2024 low with barely a pause. It has unfolded as an ABC pattern suggesting despite the dramatics it is a corrective wave only. That suggests that the down wave from April 2024 to the October low was also only a corrective wave because we unfolded in three waves or an ABC.
With a strong US$ Index the other currencies suffered. The euro fell 1.8%, the Swiss franc down 1.4%, the pound sterling off 2.4% and the Japanese yen down 1.2%. The Cdn$ fell to 52-week lows losing 1.3%. None of the other currencies are up on the year with the yen the worst, down 8.6%. It’s U.S. dollar mania.
Trouble is a strong U.S. dollar makes exports more expensive and it is a threat to the mountain of debt denominated in U.S. dollars particularly sovereign debt that makes them all more expensive as the revenues for the country are in the (sinking) local currency. When the US$ Index has gone up like this it is difficult to pin point where the breakdown point is. Under 105.75 might be an initial sign better under 105 but we do break for sure under 103.50. In the interim it is U.S. dollar on fire.
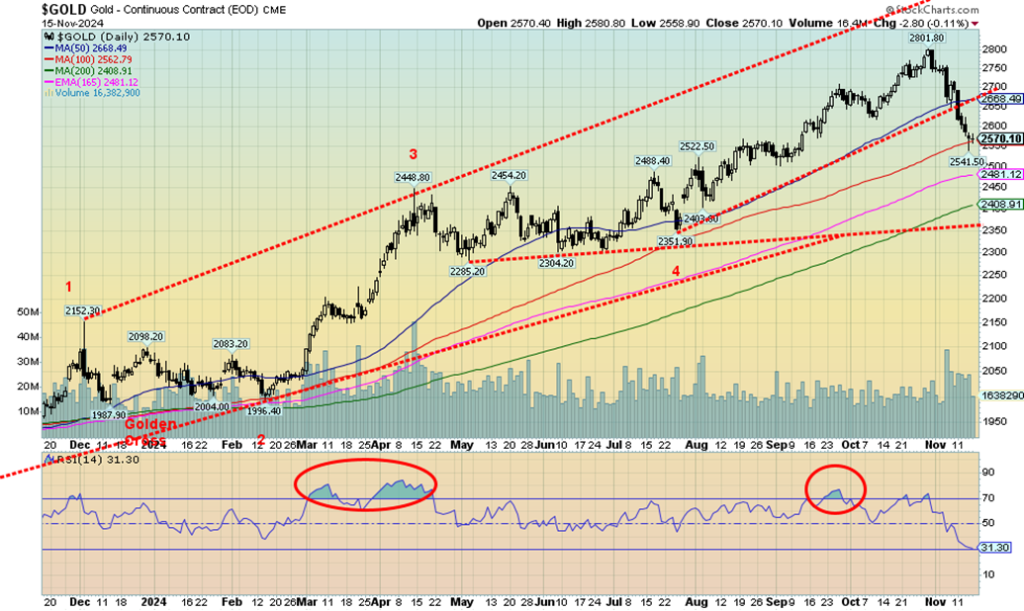
It was not a good week for gold. Gold has reacted negatively to Trump’s election losing out to the stock market and Bitcoin. It hasn’t helped that interest rates are higher, the U.S. economy is still demonstrating strength and there is even talk that the Fed might now not lower rates as earlier predicted. Higher interest rates are negative for gold given increased carrying charges. And as well the US$ Index has been fire. The thus far 9.3% drop from the October high is the worst drop in three years. Despite the drop, gold remains up 24.1% on the year.
Above $2,740 new highs are possible. Ironically gold falling as it has it been following Trump’s election has also happened in 2016. Then gold didn’t make its low until mid-December. After that gold embarked on a 22% gain into September 2017 and a marginally higher high in April 2018. Gold then fell and made its final low in August 2018. If it is any consolation gold went up some 73% from October 2022 to the recent high in October 2024.
On the week gold fell 4.6%, silver dropped 3.2% a divergence with gold, and, platinum continues to be miserable off 3.4% on the week and down 7.6% on the year. Of the near precious metals’ palladium continues its woes down 4.9% on the week and 17.3% on the year. Copper also felt the drop as it fell 5.8% but clings to 4.4% gain in 2024. The gold stocks were “whacked” with the Gold Bugs Index (HUI) down 8.6% and the TSX Gold Index (TGD) off 8.2%.
Not helping gold is that many of Trump’s proposals from tariffs, to the expelling of illegal immigrants to tax cuts are all potentially inflationary. And that translates into higher interest rates. Better for gold is stagflation rather than inflation. Deflation is usually good for gold as well. Gold is approaching oversold if the RSI were to drop under 30. But we don’t really see a good sign that we may have bottomed until we regain above $2,675.
The result of all of this is the seeming bounce we got this past week may not last long and we continue a decline into December. At the time the Trump decline in 2016 was 16%. So far, the drop is 8.2% suggesting we may have more downside.
We continue to view the current decline as a correction to the run-up from October 2023 to the high in November 2024. The run-up was over 53%. So, a 10% correction thus far isn’t much.
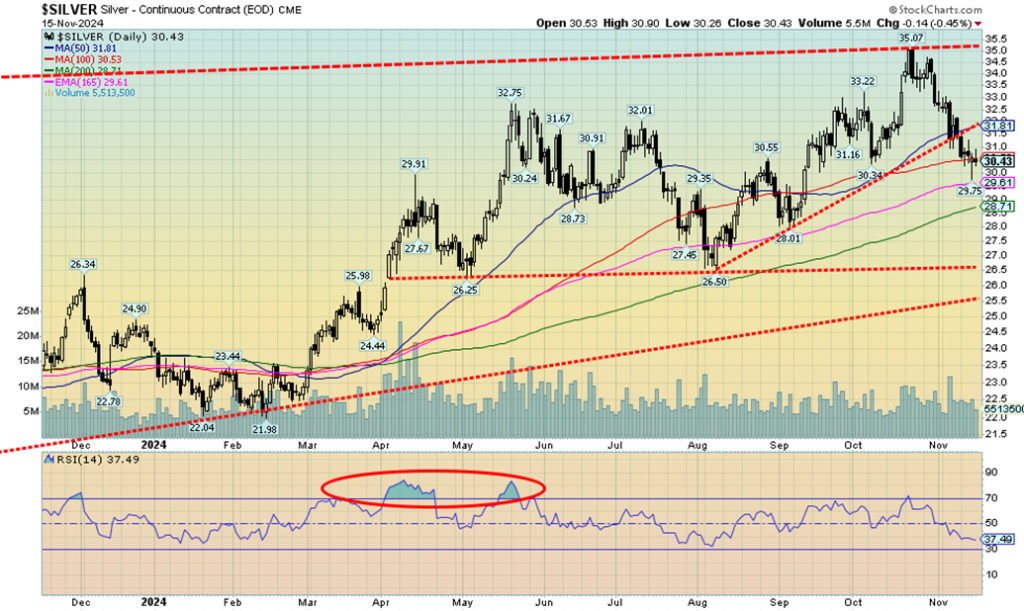
Silver followed gold lower this past week losing 3.2%. While silver lost it was encouraging as silver lost less than gold. Could it be signaling a turn around? Silver entered correction territory with a drop now of 15.2% from the October high. We broke an uptrend line as well putting silver in the position of facing further losses. Granted we did bounce off support when we hit the weekly low at $29.75. Longer term we see support down to around $28.50 but would be quite concerned if we broke that level.
Longer term we see major support down to $26.50 even as we believe we won’t go that low. Course breaking $29.75 might change our minds. Silver like gold has been in a downswing since the Trump election. It did the same thing in 2016. That year the low wasn’t seen until at least mid-December. We are not as yet oversold on the RSI so we do have potentially more downward to come. Only back above $32 could we feel comfortable that a low might be in.
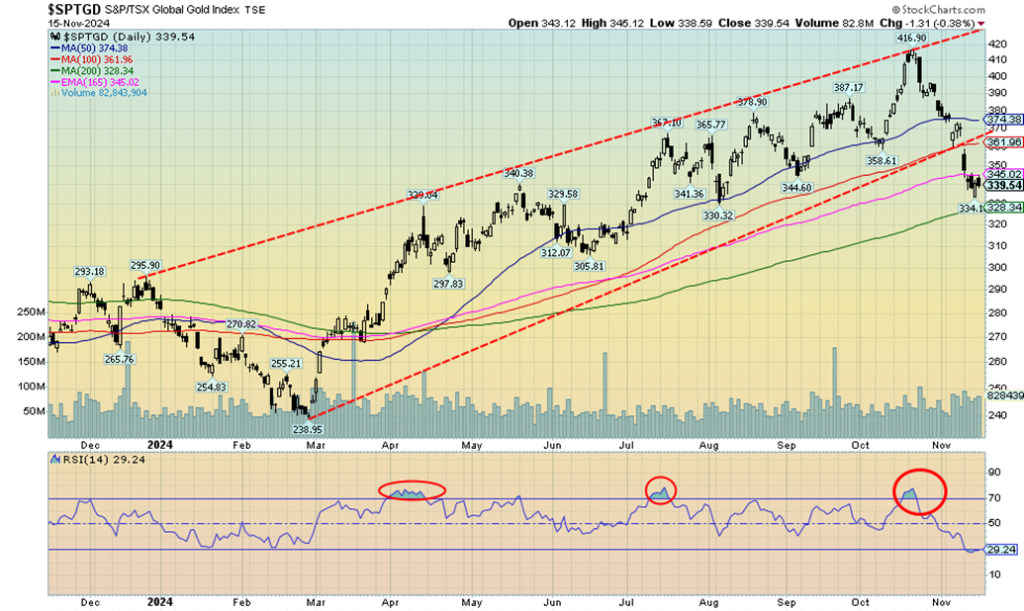
It was a very unpleasant week for the gold stocks. The TSX Gold Index (TGD) fell 8.2% while the Gold Bugs Index (HUI) dropped 8.6%. Lower gold and silver prices will do the trick. It also seemed to be a mini-panic sell off. It’s a thin market at the best of times so movements up and down can sometimes be exaggerated. The dop this past week has shaved 18.5% off the TGD and 19.5% off the HUI. It’s the worst drop since the decline in January to March 2024 when the TGD fell almost 18%. Still all this move might be is a steep correction in a bull market. We are now not that far from the major 200-day MA support near 328.
The low on the week was 334. We’d be more concerned if we broke under 320 but the action towards the end of the week while negative was somewhat encouraging with a bounce back. We won’t feel comfortable until we at least regain above 360 or even 375. Volume on the week wasn’t great and we note that the RSI has now fallen under 30 into oversold territory. No, that doesn’t guarantee a rebound but it does bring us into better buying areas if we are to consider the bull intact. We broke our uptrend line.
We had no real topping pattern just the sudden drop in the market. Despite all the negatives this past week the TGD is still up 19.4% and the HUI up 17.2% in 2024. But it felt a lot better when the indices were up over 30% before this drop hit.
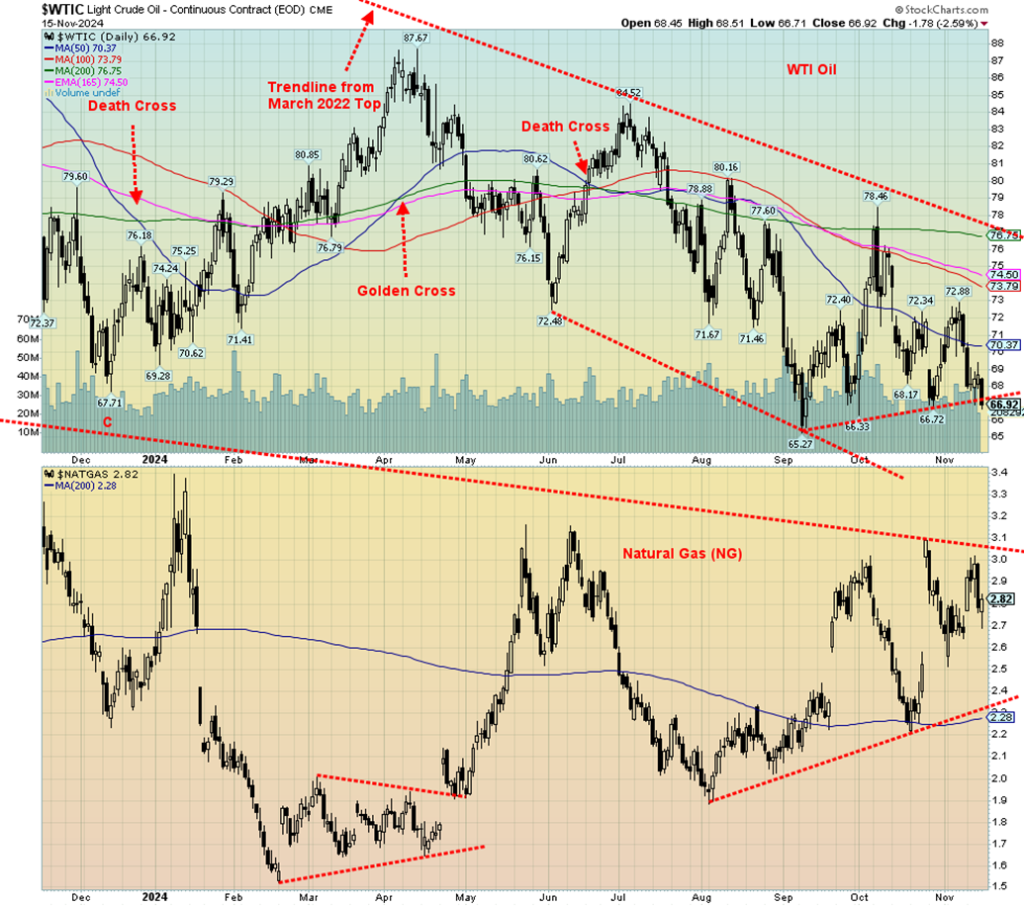
Despite gasoline and diesel draws this past week oil prices continued to be pressured to the downside. Waning demand from China, a high U.S. dollar, OPEC forecasts of declining demand plus dampening possibilities of the Fed cutting rates in December all put downward pressure on oil prices. Brent was pushed under $72 while WTI fell below $67.
On the week WTI oil was down 4.9% and Brent fell 3.9%. Natural gas (NG) rose instead. In the EU at the Dutch Hub prices were up 8.7% on forecasts of colder weather in Europe. At the Henry hub prices also rose up 5.6% on fears of more hurricane disruption and drops in production helped push prices higher. Demand is expected to rise later in November with colder forecasts. All of this left the energy stocks waffling but they didn’t manage to rise on the week. The ARCA Oil & Gas Index (XOI) rose 0.9% while the TSX Energy Index (TEN) was up 0.8%.
WTI oil is now dangerously clinging to the what might be the neckline of a potential top head & shoulders consolidation pattern. WTI oil could fall to $54. We’re now not far from the September low of $65.27. We’d really need to regain above $69 first but more preferably above $70.50 to convince that a low might be in. Otherwise, we are the past the point that would suggest new lows lie ahead. NG may be trying to establish an uptrend, but only a breakout above $3/$3.10 would convince us we’re headed higher. A drop back under $2.50 would be negative and suggest lower prices.
Seasonally we don’t usually start seeing better prices in the energy sector until December. Meanwhile a blow up in the Mid-East with Iran in the middle is always a catalyst for higher oil prices. In the interim we could see new lows. But the positive divergences suggesting a low would only become more pronounced.
__
(Featured image by Marga Santoso via Unsplash)
DISCLAIMER: This article was written by a third party contributor and does not reflect the opinion of Born2Invest, its management, staff or its associates. Please review our disclaimer for more information.
This article may include forward-looking statements. These forward-looking statements generally are identified by the words “believe,” “project,” “estimate,” “become,” “plan,” “will,” and similar expressions, including with regards to potential earnings in the Empire Flippers affiliate program. These forward-looking statements involve known and unknown risks as well as uncertainties, including those discussed in the following cautionary statements and elsewhere in this article and on this site. Although the Company may believe that its expectations are based on reasonable assumptions, the actual results that the Company may achieve may differ materially from any forward-looking statements, which reflect the opinions of the management of the Company only as of the date hereof. Additionally, please make sure to read these important disclosures.
Copyright David Chapman 2024
David Chapman is not a registered advisory service and is not an exempt market dealer (EMD) nor a licensed financial advisor. He does not and cannot give individualised market advice. David Chapman has worked in the financial industry for over 40 years including large financial corporations, banks, and investment dealers. The information in this newsletter is intended only for informational and educational purposes. It should not be construed as an offer, a solicitation of an offer or sale of any security. Every effort is made to provide accurate and complete information.
However, we cannot guarantee that there will be no errors. We make no claims, promises or guarantees about the accuracy, completeness, or adequacy of the contents of this commentary and expressly disclaim liability for errors and omissions in the contents of this commentary. David Chapman will always use his best efforts to ensure the accuracy and timeliness of all information.
The reader assumes all risk when trading in securities and David Chapman advises consulting a licensed professional financial advisor or portfolio manager such as Enriched Investing Incorporated before proceeding with any trade or idea presented in this newsletter. David Chapman may own shares in companies mentioned in this newsletter. Before making an investment, prospective investors should review each security’s offering documents which summarize the objectives, fees, expenses and associated risks.
David Chapman shares his ideas and opinions for informational and educational purposes only and expects the reader to perform due diligence before considering a position in any security. That includes consulting with your own licensed professional financial advisor such as Enriched Investing Incorporated. Performance is not guaranteed, values change frequently, and past performance may not be repeated.

-

 Cannabis2 weeks ago
Is Aurora Cannabis Stock a Risk Worth Taking?
-

 Crowdfunding1 day ago
PMG Empowers Italian SMEs with Performance Marketing and Investor-Friendly Crowdfunding
-

 Fintech1 week ago
Robinhood Expands to Europe with Tokenized Stocks and Perpetual Futures
-
 Markets3 days ago
The Big Beautiful Bill: Market Highs Mask Debt and Divergence


