Markets
Trump’s Policy Puts Pressure on Markets: Economic Uncertainty Looms
Trump’s unpredictability fuels market confusion as tariffs fluctuate. U.S. markets tumbled, while EU markets rose on defense spending optimism. Gold climbed amid economic and geopolitical uncertainty, while Tesla and AI stocks declined sharply. February job reports showed weakness. Oil fell, and central banks eyed rate cuts. As markets shift, history may be repeating itself.

We have to admire The Economist. One week it is Donald Trump the King. The next week it is Donald Trump the Don (as in mafia Don) (“Dealing with the Don” – The Economist, March 1–7, 2025). We haven’t seen too many other mainstream publications refer to Donald Trump as first a King, then a Don.
Trump, as he is wanton, is turning the world order on its head and what he is doing is difficult to avoid. The result is that the NASDAQ has now fallen into correction territory and the other indices are getting close. So much for the Trump bump.
Perceived unfair trade practices and the perception that the U.S. is paying for all foreign wars is translating into a quest for territory, attacking of alliances, the quest to control technology and minerals, and the unleashing of potentially dangerous trade wars. The possible became the reality this past week as Canada, Mexico, and China were hit with tariffs (25% on Canada and Mexico, but only 10% for energy, plus 10% on China). Then as he is wont Trump pulled some tariffs back on goods under the USMC. It’s a yo-yo situation and driving everyone into a high level of uncertainty. As expected, Canada is not budging and its retaliatory tariffs remain in place. Regardless of this, the tariff war is self-destructive and we’ll all suffer.
Canada and China struck back immediately with their own tariffs on goods while Mexico should be responding soon. Instead of focusing on the economy, the Trump administration is focusing on things that will increase inflation and unemployment (thanks to DOGE and its attempts to slash $2 trillion from government spending), while giving out tax cuts that primarily benefit the wealthy. Tax cuts are also inflationary as are tariffs.
Eventually all the tariffs and job cuts (which translate into more job cuts) will show up in the economic numbers. Already the Atlanta Fed is projecting at least a 1.5% contraction in Q1 and has indicated it could be as high as 2.8%. The stock market is also responding by plunging, with the S&P 500 now down 7% from its all-time high and the NASDAQ down 11%, officially in correction territory. It is also becoming very volatile with 500-point movements both up and down for the Dow Jones Industrials (DJI), an almost daily occurrence. The DJI is down 6% from its all-time high.
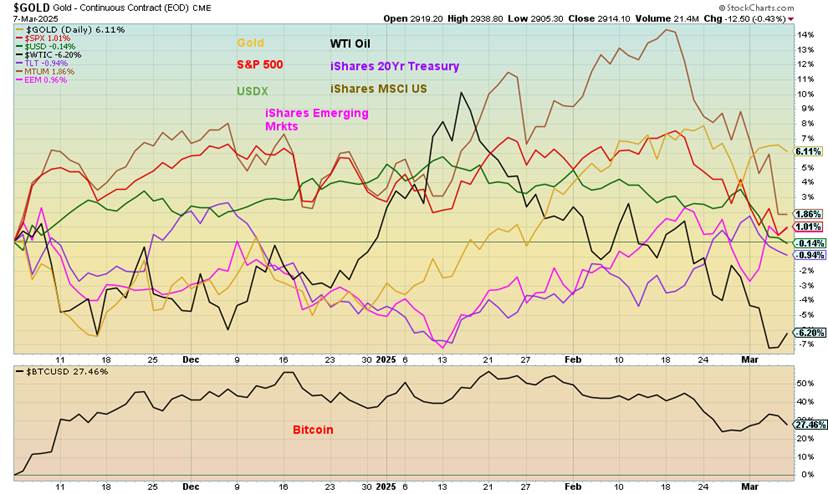
Maybe it’s no surprise that gold has surged into the lead in terms of performance from November 5. The former frontrunner, iShares MSCI U.S. Momentum Factor (MTUM) has faded, now down about 10% from its high in February. Bitcoin, however, remains the big winner, up 27%. But it too is beginning to fade as it too is down on the year. Turning negative has been WTI oil as the world faces a glut and no oil wars, while also turning negative is the iShares MSCI Emerging Markets, bonds represented by the TLT iShares 20-year Treasury Bond and the US$ Index. All others, including the S&P 500, have all turned down from their highs. Gold is turning up and once again poised to make new all-time highs.
Atlanta Fed GDP Estimate 2025: Q1
Scorecard November 5, 2024 to Present
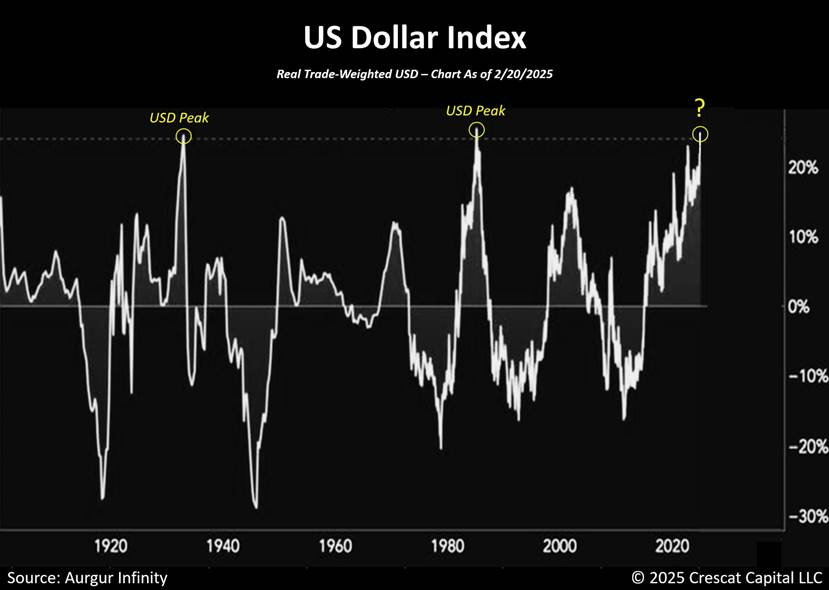
The US$ Trade-Weighted Index remains near record levels, even as it has now begun to fall (see commentary on US$ Index). The trade-weighted US$ Index differs from the US$ Index regularly seen. The US$ Index is composed of six currencies vs. the U.S. dollar: the euro, Swiss franc, Japanese yen, Canadian dollar, U.K. pound, and Swedish krona. The US$ Trade-Weighted Index covers a larger number of currencies—26 in all.
The index is a weighted average of the foreign exchange value of the U.S. dollar against the currencies of a broad group of major U.S. trading partners. The broad currency index includes the euro area, Canada, Japan, Mexico, China, United Kingdom, Taiwan, Korea, Singapore, Hong Kong, Malaysia, Brazil, Switzerland, Thailand, Philippines, Australia, Indonesia, India, Israel, Saudi Arabia, Russia, Sweden, Argentina, Venezuela, Chile, and Colombia.
The trade-weighted index is at its most extreme since the last major peak in 1985 that triggered the Plaza Accord to devalue the U.S. dollar. Before that, the most extreme was seen in 1933. In 1934 the Gold Reserve Act increased the price of gold to $35/ounce from $20.67/ounce. That helped devalue the U.S. dollar and unleashed a mining boom. Given the current peak’s proximity to previous peaks, the U.S. dollar could be in for a significant fall. Some believe this could threaten the U.S.’s role as the world’s reserve currency. However, we believe we are nowhere, as of now, near that.
The vulnerability lies in the U.S. bond market where there is $28.9 trillion of public debt outstanding. There is also a further $7.3 trillion held by intragovernmental departments; i.e. Social Security. Of the public debt, some $8.5 trillion is held by foreigners. As we have noted, the two largest holders, Japan and China, have been reducing their holdings. Other central banks have had to pick up the slack, particularly the G7 central banks.
Again, as we have noted, some $9 trillion plus comes due in 2025, which could face refunding problem. As the trade wars intensify and the previous world order breaks down, others could be sellers of U.S. securities which in turn would put pressure on the U.S. dollar. That could lead to higher interest rates in the long end and a falling U.S. dollar. A falling US$ Index is already underway. Long interest rates rose this past week.
U.S. Trade-Weighted U.S. Dollar Index 1900–2025
Trump’s tariffs are all over the map. It’s like “whack-a-mole”—you never know what’s going to pop up next. Dates change. What is being tariffed changes. See games with auto tariffs. Delays are announced, then rescinded then delayed again. The United States-Mexico-Canada Agreement (USMCA) is routinely ignored.
Former agreements are becoming essentially worthless. Canada becoming the 51st state is endlessly repeated, even by other U.S. officials. This is already having a dampening impact on Canada and the U.S. as well. Job losses are slowly rising, uncertainty is putting projects on hold, Canadians are boycotting the U.S., while the housing market, already feeling downward pressure, risks falling even further. A telephone call between U.S. president Donald Trump and Canadian PM Justin Trudeau went poorly.
The housing market, which was already tipping over, is becoming a concern. Sales are falling and listings are rising. In the U.S., the key one to watch is pending home sales, which fell 5.2% in January after a 5% decline in December. Both existing home sales and new home sales are also falling. Existing home sales fell 4.9% in January while new home sales dropped 10.5% in January. Inventory is rising and sitting on the market longer. And we haven’t even got into the heart of tariffs, etc. Florida in particular is suffering a fall in its housing market. Insurance costs are through the roof adding another layer.
U.S. Existing Home Sales, New Home Sales, Pending Home Sales 2015–2025
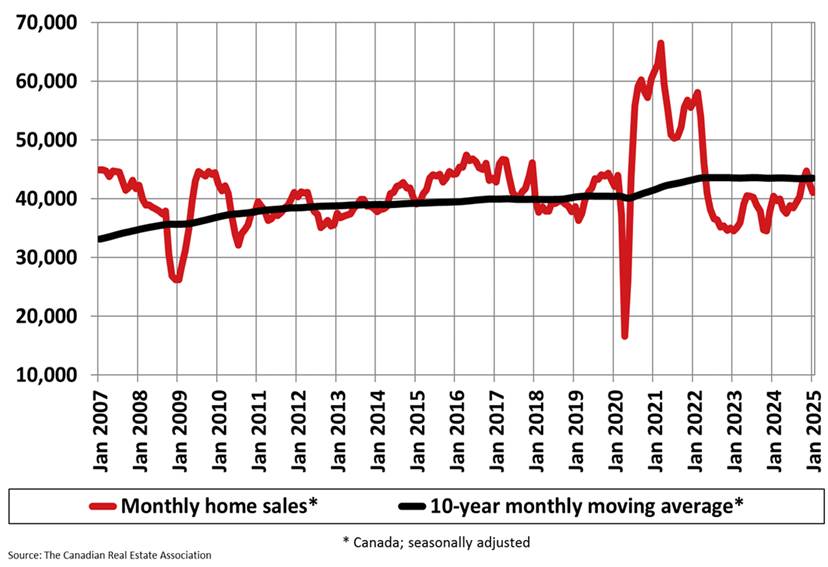
We’re seeing the same phenomena in Canada. The latest numbers from the Canadian Real Estate Association (CREA) show falling numbers. It was reported that February sales fell and inventory is rising. Numerous condo projects are in trouble. Again, we don’t have the worst of this yet. A falling housing market spills over into other markets including appliances, repairs, and more.
The housing market is one of the most important components in the market. If it’s falling, others are too. CREA reported that housing sales fell 3.3% in January while new listings rose 11%. Again, as the trade wars intensify and job losses mount, these numbers could fall even further. They also put downward pressure on house prices that are already under pressure.
Canada Monthly Home Sales 2007–2025
Not that long ago, The Economist declared the U.S. the envy of the world with low unemployment, falling inflation, and a growth rate that the other G7 countries could only wish for. Not anymore. Consumer confidence is falling, the jobs market is slowing, the stock market is falling off its all-time highs, and world alliances are being shattered.
The CNN Fear & Greed Index is showing extreme fear. The US$ Index is falling, while bond market yields after falling are starting to rise again. The yield curve that used to be negative has turned positive, a sign that a recession is coming.
The trade war is intensifying, with Greenland, Panama, and Canada shoving off threats to annex them. Manufacturing is still in the growth area, but it won’t take much now to tip it over into recession territory. The former high-flying MAG7 are crashing to earth. The richest man in the world is now a little less rich as his net worth has fallen $120 billion from its heights. Tesla, the stock that made him rich, is approaching down 50% from its highs. The Atlanta Fed is predicting Q1 GDP to fall up to 2.8%. And a reminder the discretionary funding of the government expires on March 14. To date, there is no deal to extend it and a government shutdown could follow.
The constant yo-yo action on tariffs is creating confusion and uncertainty. In that environment, people and companies put their hands in their pockets. Spending falls. To come—tax cuts and deregulation. The Supreme Court may want to rescind the president’s immunity. Instead, they may be poised to give him more power. So far, as The Economist notes, he is less a president than a mafia Don.
“Fasten your seatbelts, it’s going to be a bumpy night!”
—Margo, played by Bette Davis in All About Eve (1950)
Or, in this case, a bumpy four years. Worse, maybe longer.
Chart of the Week: U.S. Job Numbers
NonFarm Payrolls vs. Unemployment Rate 2022–2025
It’s a softening. Not a collapse. That seems to be the consensus from the February employment numbers. The closely watched Nonfarm Payrolls (Establishment Survey) rose to 151,000 from January’s revised downward 125,000. It was a bit below the consensus of 160,000 in expected gains. Softer, but not yet a big drop as we haven’t yet received the negative impact of job layoffs in February, including the chaos going on in Washington as a result of Musk’s DOGE trying to fire everyone.
Seems Musk now has to work through the cabinet ministers that head up the departments as opposed to taking his chainsaw to entire departments. Nonetheless, it is admittedly difficult to predict the negative impacts of job-cutting in the federal government. At least, not now.
The unemployment rate (U3) edged up to 4.1% from 4.0%. The market had expected it to remain at 4.0%. More important was the U6 unemployment rate (total unemployed, plus all persons marginally attached to the labour force, plus total employed part-time for economic reasons, as a percent of the civilian labour force, plus all persons marginally attached to the labour force), which jumped to 8.0%, up from 7.5%. That was a far cry from the expected 7.6%.
We also have updated Shadow Stats (www.shadowstats.com) unemployment numbers (U6 plus those not in the labour force defined out in 1994 who are looking for work). That rose to 27.4% from 26.8%. The labour force participation rate also dropped to 62.4% from 62.6%. They expected it to hold steady at 62.6%. The employment population ratio fell to 59.9% from 60.1%, which indicates fewer people working as a percentage of the population.
The civilian labour force fell by 385,000 while the employment level fell 585,000. Neither is a good sign. The unemployment level rose by 203,000 but the total population level (those 16 years of age and over that are eligible to work) rose 162,000. Full-time employment fell 1,220,000 while part-time employment rose 610,000. The result of all of this is that the total population has gone up but the civilian labour force has fallen, while the unemployment level has also gone up with fewer having full-time jobs and more have part-time jobs.
All these are signs of softening. Those considered not in the labour force rose by 546,000. The NILF number includes retirees, disabled, stay-at- home parents, full-time students, etc. Those considered not in labour force but who want to work rose by 197,000. None of these are positive signs. The worst is yet to come.
Those holding down two jobs or more rose to 5.4% from 5.3%, the average number of weeks unemployed fell to 21.3 weeks from 22 weeks, while the median weeks unemployed rose to 9.9 from 9.1. More hints of softening.
Hours worked was 34.1 vs. the expected 34.2. It’s the lowest level since 2010. Average hourly earnings rose 0.3% as expected while year-over-year (y-o-y) average hourly earnings were up 4.0% vs. the expected 4.1%. Job losses were seen in retail, temporary help, and leisure/hospitality.
The softening job numbers have a number of economists suggesting the Fed will cut at least 75 bp in 2025. The next FOMC meeting takes place on March 18–19, 2025. Could they cut then? So far, the expectation is no, they won’t, but will instead hold off until the May meeting. By that time, they should have a better handle on the layoffs and the government employment situation.
There is always a delay in releasing these numbers. The February employment report only goes to February 15. Up until then the number losing their jobs in government was only about 10,000. Similarly, a vast number of the announced layoffs in February came after the 15. The real deluge of job losses should begin to show up in the March report, to be released April 4. Hold on to your hats. The worst is yet to come.
Canada Job Numbers
Canada Employment Change, Unemployment rate 2022–2025
Canada’s wave of big job gains appears to have come to an end. That’s not surprising, given all of the uncertainty surrounding the imposition of tariffs on Canada by the U.S. and its insistent calls that Canada become the 51st state. It creates huge uncertainty. We suppose that’s the bad news. Canada produced 1,100 jobs in February vs the expected 20,000.
The good news is that the unemployment rate remained unchanged at 6.6%. Better yet, R8 unemployment, the highest level reported by Statistics Canada (plus discouraged searchers, waiting group, portion of involuntary part-timers) fell to 9.1% from 9.4%. However, given the level of the past few months, a slowdown was to be expected.
Full-time employment fell 19,700 while part-time employment was up 20,800. Gains were seen for wholesale and retail trade and, surprisingly, finance. Losses were in professional, scientific, and technical services. Nova Scotia was hit, but everyone else was fairly stagnant. Average weekly earnings y-o-y were up 4.0% vs. the expected 3.5%. All this raises expectations that the BofC will cut rates by 25 bp again at their March 12 meeting, in an attempt to stave off the worst of the tariff uncertainty.
Markets & Trends
| % Gains (Losses) Trends | ||||||||
| Close Dec 31/24 | Close Mar 7/25 | Week | YTD | Daily (Short Term) | Weekly (Intermediate) | Monthly (Long Term) | ||
| Stock Market Indices | ||||||||
| S&P 500 | 5,881.63 | 5,770.20 | (3.1)% | (1.9)% | down | neutral | up | |
| Dow Jones Industrials | 42,544.22 | 42,801.72 | (2.4)% | 0.6% | down | up (weak) | up | |
| Dow Jones Transport | 16,030.66 | 15,610.42 | (2.4)% | (1.8)% | down | down | up | |
| NASDAQ | 19,310.79 | 18,196.22 | (3.5)% | (5.8)% | down | neutral | up | |
| S&P/TSX Composite | 24,796.40 | 24,758.26 | (2.5)% | 0.1% | down | up | up | |
| S&P/TSX Venture (CDNX) | 597.87 | 614.30 | (0.1)% | 2.8% | down | up (weak) | neutral | |
| S&P 600 (small) | 1,408.17 | 1,315.05 | (3.6)% | (6.6)% | down | down | up (weak) | |
| MSCI World | 2,304.50 | 2,511.69 | 2.6% | 9.0% | up | up | up | |
| Bitcoin | 93,467.13 | 86,392.54 | 2.6% | (7.6)% | down | up (weak) | up | |
| Gold Mining Stock Indices | ||||||||
| Gold Bugs Index (HUI) | 275.58 | 326.77 | 4.5% | 18.6% | up | up | up | |
| TSX Gold Index (TGD) | 336.87 | 414.23 | 3.5% | 23.0% | up | up | up | |
| % | ||||||||
| U.S. 10-Year Treasury Bond yield | 4.58% | 4.31% | 2.4% | (5.9)% | ||||
| Cdn. 10-Year Bond CGB yield | 3.25% | 3.05% | 4.5% | (6.2)% | ||||
| Recession Watch Spreads | ||||||||
| U.S. 2-year 10-year Treasury spread | 0.33% | 0.31% | 47.6% | (6.1)% | ||||
| Cdn 2-year 10-year CGB spread | 0.30% | 0.43% | 26.5% | 43.3% | ||||
| Currencies | ||||||||
| US$ Index | 108.44 | 103.80 | (3.5)% | (4.3)% | down | neutral | up | |
| Canadian $ | 69.49 | .6957 | 0.6% | 0.1% | down (weak) | down | down | |
| Euro | 103.54 | 108.48 | 4.6% | 4.8% | up | neutral | down | |
| Swiss Franc | 110.16 | 113.68 | 2.7% | 3.2% | up | neutral | neutral | |
| British Pound | 125.11 | 129.29 | 2.8% | 3.3% | up | neutral | neutral | |
| Japanese Yen | 63.57 | 67.62 | 1.8% | 6.4% | up | up (weak) | down | |
| Precious Metals | ||||||||
| Gold | 2,641.00 | 2,914.10 | 2.3% | 10.3% | up | up | up | |
| Silver | 29.24 | 32.81 | 4.2% | 12.2% | up | up | up | |
| Platinum | 910.50 | 966.50 | 3.1% | 6.2% | down (weak) | down | neutral | |
| Base Metals | ||||||||
| Palladium | 909.80 | 955.50 | 4.8% | 5.0% | down | down | down | |
| Copper | 4.03 | 4.71 | 3.5% | 16.9% | up | up | up | |
| Energy | ||||||||
| WTI Oil | 71.72 | 67.04 | (3.9)% | (6.5)% | down | down | down | |
| Nat Gas | 3.63 | 4.38 | 14.4% | 20.7% | up | up | neutral | |
Another week, another breakdown. This time it is potentially more serious. The background is negative. Trade wars, global alliances breaking, global alignments shifting, and a weakening economy (see the latest job numbers) are all conspiring against a rising stock market. The Trump bump is now officially gone. The U.S. is weakening, even against European and Asian stock indices that are all starting to look better, particularly the EU. It has been suggested that the Trump administration is deliberately trying to bust the economy so that they can remake it in their own image.
The attack on all things “woke” or whatever they perceive as “woke” intensified this week. MAGA, which claimed they would restore free speech, are instead doing the opposite, attacking everything they consider “woke”, disallowing all sorts of phrases that refer to DEI. The attack is racist as it suggests “woke” is an attack on white people. It’s also an attack on civil rights. The resulting chaos and uncertainty are not positive for stock markets. Could things get violent? Yes, see torching of Tesla car dealerships destruction of a Trump gold course in Scotland.
On the week, the S&P 500 (SPX) fell 3.1%, the Dow Jones Industrials (DJI) dropped 2.4%, the Dow Jones Transportations (DJT) was off 2.4%, while the NASDAQ broke down, off 3.5%. Only the DJI remains up in 2025, a mere 0.6%. Everything else has turned negative. Worse, the S&P 400 (Mid) was down 3.5% and the S&P 600 (Small) dropped 3.6%. Both indices are down in 2025.
The short term/daily trends of all the U.S. indices are down and the weekly/intermediate trend has turned down for the DJT and the S&P 600. Others are very close to turning down. The MAG7 (see later) are killing the NY FANG Index as it fell 5.9% and is now down 7.7% on the year. Bitcoin tried to rebound after talk of a strategic reserve for cryptos, but in the end it faded, staying up 2.6% on the week but down 7.6% on the year.
In Canada, the TSX Exchange fell 2.5% but the TSX Venture Exchange (CDNX) was off a mere 0.1%. The CDNX remains up in 2025 by 2.8%. In the EU, thoughts of increased liquidity and a pivot to improving their defense capability saw the Paris CAC 40 up 0.1%, the German DAX gaining 2.0%, and the EuroNext up 0.4%. Only the London FTSE faltered, off 1.0%, although earlier it had hit all-time highs.
A reversal week for the FTSE. In Asia, China’s Shanghai Index (SSEC) rose 1.6%, the Tokyo Nikkei Dow (TKN) fell 0.7%, but Hong Kong’s Hang Seng (HSI) rose 5.6% to fresh 52-week highs. U.S. negative, EU positive, and Asia mixed but generally up. The MSCI World Index rose 2.6% but we don’t expect that to hold. The MSCI World Index is up 9% on the year.
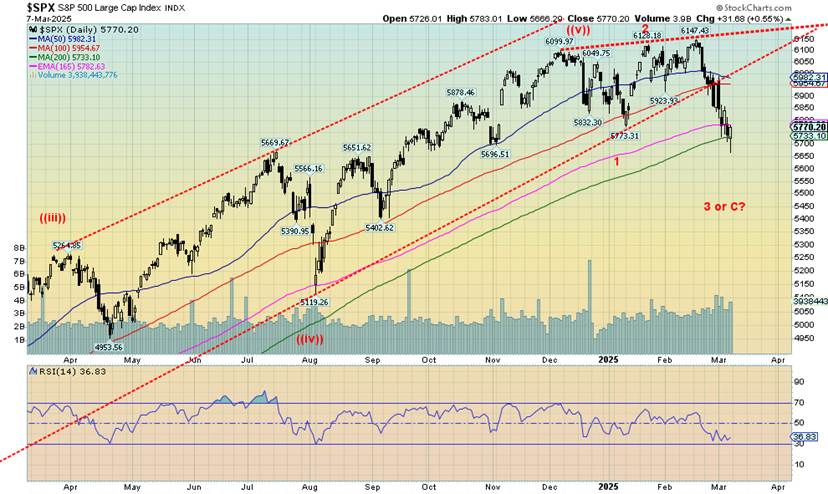
The SPX has found potential temporary support at the 200-day MA near 5,700. We broke up trendline support and we suspect we’ll soon break the 200-day MA. The next target would be 5,400. Below 5,400, the market becomes even more dangerous. Could a crash happen? Yes. We’d have to get back above 6,000 to suggest a low may be in. But this market and the technical pattern looks dangerous. Kind of like the sinking background.
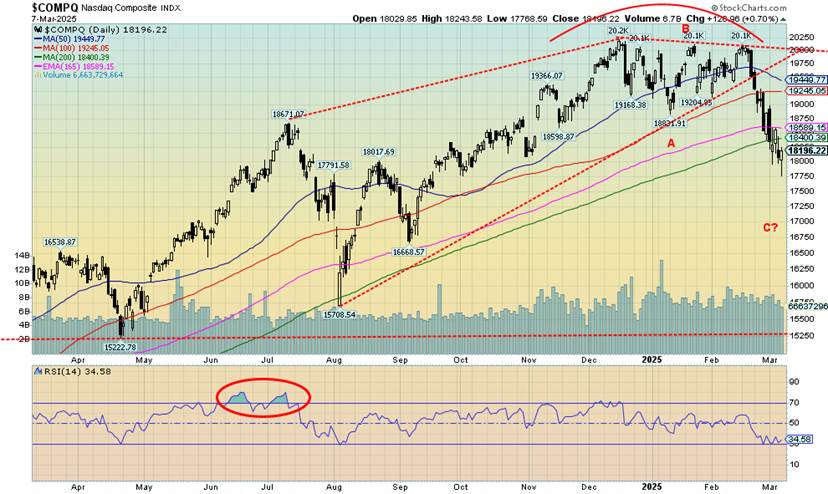
The NASDAQ, dominated by the MAG7, is leading the way to the downside. This past week the NASDAQ fell 3.5%, breaking below its 200-day MA at 18,400 and closing at 18,196. The pattern that appears to have formed at the top suggests an ultimate decline to at least 18,130, which it is close to, but more likely the target could be down to 17,285 or even 16,615.
We note long-term support down to 15,250. The NASDAQ is leading the way down, a signal that the stock market could have further to go. The NASDAQ short term/daily trend is down while the weekly/intermediate term is now neutral. Another down week and it too turns negative. The pattern suggests lower.
A Second Chart of the Week
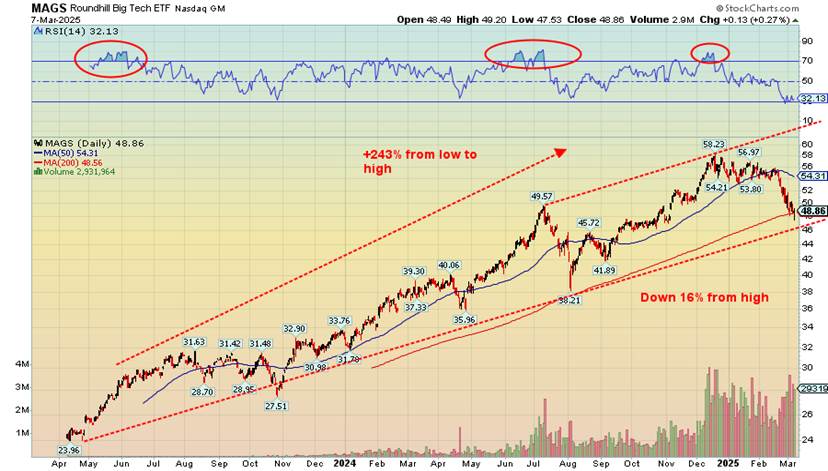
Good-bye MAG7? Okay, we have not as yet taken out the trendline below around $40. Overall, we are down some 16% from that high in December 2024. That’s correction territory. MAGS is the stock symbol for the Roundhill Big Tech ETF. It trades on the NASDAQ. As its name implies, the major components are the MAG7: Nvidia, Meta, Apple, Amazon, Google, Microsoft, and Tesla. Oh yes, Tesla is now down 34.9% in 2025 and down 46.2% from its December 2024 high.
Of the MAG7, so far, the only one spared of trading in the hole in 2025 is Meta, which is still up 6.8% in 2025. How long will that last? As for the rest, and this is for 2025 only, not from their all-time highs, Apple is down 4.4%, Amazon off 9.0%, Google is down 7.6%, Microsoft is down 6.5%, and Nvidia is off 16.0%. Lest we feel any sympathy for the MAG7 billionaires, well, the good news for them is they are still billionaires. Yes, you—Elon Musk (Tesla), Jeff Bezos (Amazon), Mark Zuckerberg (Meta), Larry Page and Sergey Brin (Google), Steve Balmer and Bill Gates (Microsoft), Jensen Huang (Nvidia), and Tim Cook (Apple).
But what about all the funds that hold the MAG7? What about all the latecomers to the party? Suddenly, things don’t look too rosy any longer. For the third time since 1970 we are having a tech meltdown. The first came in 1973 with the peak of the Nifty Fifty. What followed was a 48.2% haircut for the S&P 500. The second was the dot.com/high-tech boom of the 1990s that peaked in 2000. The drop this time was 49.2%, but it came in two tranches, the first going from the top in March 2000 to the 9/11 crash bottom in September 2001, while
the second went from January 2002 to October 2002. So here we are once again. What will be final drop? We suspect as with the others at least 50% from the top. That would put the S&P 500 down at 3,075. The president won’t be pleased. What goes up fast comes down even faster. Noteworthy was the DJI saw technology tops also in 1929 and 1966. The drops then? 1929-1932 down 89%, 1966-1968 down 35.9%. Yes, we eventually recovered but it usually took years to get back to the former top.
S&P 500 1970-2025

Here is the S&P 500 from 1970. We’ve highlighted the two major tops, plus the suspected third one. The Nifty Fifty top in 1972/1973, the dot.com/high-tech top in 2000, and finally the potential current top in 2024 for AI stocks and the MAG7. That’s a nice trendline up from the 1974 low for the S&P 500. Do we test that line again? It’s down around 2,100. That’s a drop of 66% from the top. Okay, maybe we are overdoing it. But it’s a possibility. It may not happen all in one fell swoop. The connecting line was the 2009 low following the sub-prime mortgage financial crisis meltdown of 2008.
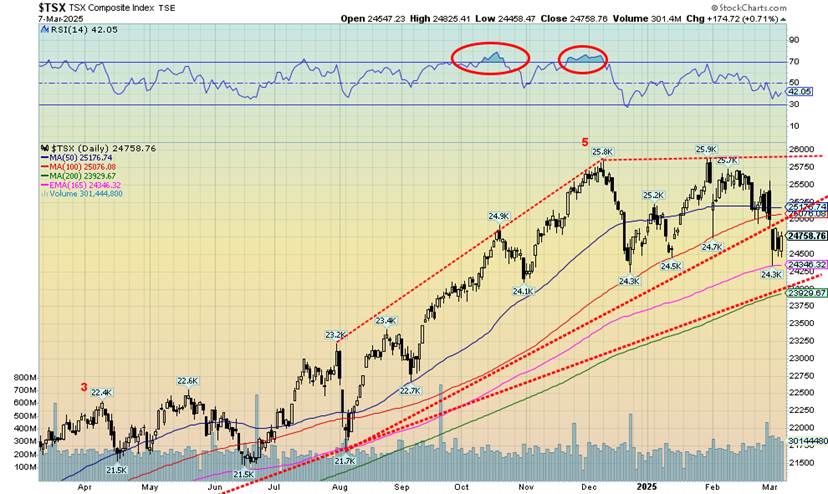
If the U.S. stock market falls, Canada’s TSX Exchange feels the backlash. But Canada has a trick up its sleeve. It is commodity rich and, while the TSX fell 2.5%, the TSX Materials Index (TMT) rose 1.4%. That’s a hint of where one should be. TSX Golds (TGD) were up 3.5% and TSX Metals & Mining (TGM) gained 2.3%. Because of weak oil prices, the TSX Energy Index (TEN) fell 4.4%. Indeed, the Energy index was the second-worst performer this past week, surpassed only by Information Technology (TKK) losing 5.7%.
The MAG7 are falling, so tech stocks become collateral damage. Seven of the 14 sub-indices were down this past week. Financials (TFS) fell 4.1%. Between TFS, TEN, and TKK, it helped push the TSX lower. The Materials sector couldn’t offset it. The best performer was actually telecommunications TTS, up 4.2%. The TSX 60 was worse than the much broader-based TSX, losing 2.6%. The TSX broke an up trendline support and the next target could be the 200-day MA near 23,900.
The TSX is down 4.0% from its high and is up a small 0.1% on the year so far. A break now under 24,300 signals lower prices ahead. Under 23,900, a more serious drop could get underway. If that is a double top on the charts it projects down to at least 22,800. The daily short-term trend has turned down, while the intermediate/weekly trend is still up but weakening. Another down week and it too could turn negative.
U.S. 10-year Treasury Note, Canada 10-year Bond CGB
Long-term interest rates rose this past week, seemingly in defiance of Trump’s wish for lower rates. The U.S. 10-year treasury note rose to 4.31% from 4.21%. While the February job numbers weakened, Fed Chair Jerome Powell reiterated that, so far, at least the U.S. economy remains good. However, a lot of uncertainty remains. A falling US$ Index isn’t helping. We need to await figures on foreign holdings of U.S. treasuries.
Powell indicated that the Fed is likely to hold at its March 18–19 FOMC. That led some to believe that inflation isn’t going down and, while the economy might weaken, stagflation is real possibility. We still have a way to go for the 10-year to get over 5% and new highs. We can’t help but note that attempts to fire Fed Chair Jerome Powell will likely intensify. Rising interest rates is not what the Trump administration wants.
In Canada too, rates rose with the 10-year Government of Canada bond (CGB) rising to 3.05% up from 2.92%. Threats to the Canadian economy may be real, but the long rates are not reflecting that potential weakness. The 2–10 spreads also went up with the U.S. rising to 31 bp from 21 bp and Canada’s 2–10 up to 43 bp from 34 bp. All this does is highlight that a recession is looming.
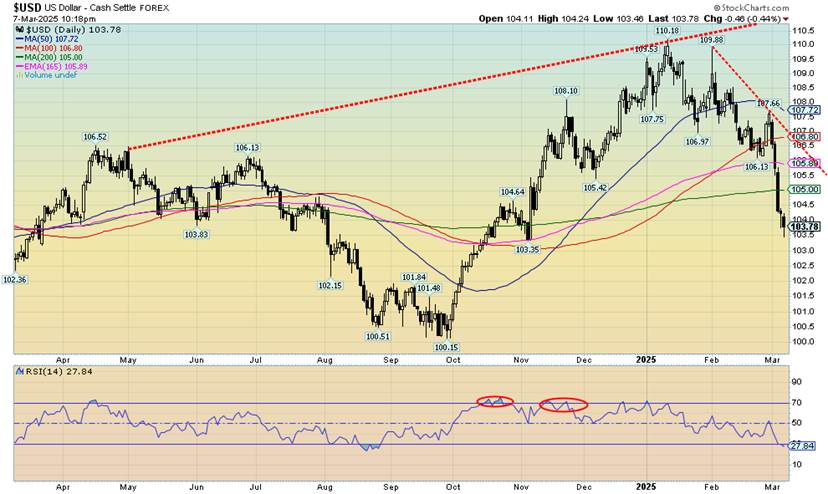
Are the days of the U.S. dollar as the world’s reserve currency nearing an end? That’s a hard call and, for the moment at least, highly unlikely. But the upending of the global world order by the Trump administration could lead to the collapse of the U.S. dollar and ultimately its role as the world’s reserve currency. We are not saying it will happen, but it could happen over the next few years.
Fifteen years ago some 80–85% of international payments were transacted in U.S. dollars. Today that is down to around 60% and only 50% in China. The U.S. dollar is losing its cachet. No wonder the Trump administration is threatening anyone and everyone with huge tariffs if they try to switch off the U.S. dollar or create an alternative currrency.
This past week, the US$ Index suffered its worst drop since November 2022 losing 3.5%. That was a boon for the other major currencies. The euro was up 4.6%, the Swiss franc up 2.7%, the pound sterling gained 2.8%, and the Japanese yen was up 1.8%. Only the Canadian dollar didn’t really catch fire because of Canada remaining under threats of tariffs and takeover from the U.S. The Cdn$ gained 0.6% on the week.
The euro is on fire as, with the U.S. attacking European allies pulling back on Ukraine while cozying up to Russia, Europeans are getting nervous. They are prepared to open the spiggots and upgrade their own defense in the potential absence of the U.S., including a possibility that the U.S. pulls out of NATO. Opening the spiggots and building up their defense could spurt growth in the moribund European economies. EU economic growth for Q4 was 0.9% compared to the U.S.’s 2.5%. Austria, Germany, and Norway recorded negative growth in Q4. Most of the rest reported anemic growth. That helped the U.S. dollar then, but this is now.
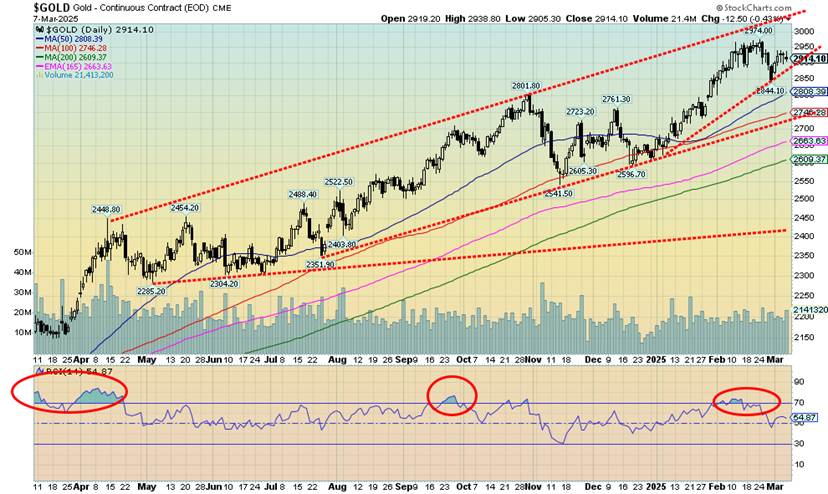
With a stock market in turmoil, trade wars with on again-off again tariffs (the yo-yo effect), huge uncertainty, the potential for the U.S. to fall into a steep recession, a breakdown in the West’s global order as the U.S. cozies up to Russia, potential loss of confidence in government, everything is being upended. Add in a sinking dollar and indications that the job market is tipping over and we have ideal conditions for gold as a safe haven. And this past week we got it with gold up 2.3%, even as the S&P 500 fell 3.1%. Gold up, stocks down. The new order of things?
At the recent high near $2,974 gold was somewhat overbought. The pullback has taken us back to neutral. No, we have not taken out the point where gold would be telling us we should take out the $2,974 high. That point comes to the fore over $2,944. Nonetheless, we have to be encouraged by the action. Elsewhere, silver gained 4.2% this past week, platinum was up 3.1%, while the near precious metals saw palladium gain 4.8% and copper up 3.5%. Copper, a leading indicator, closed at $4.71 and now $5 is in its sights.
Central banks continue to accumulate gold (but not the U.S.). They may be selling U.S. treasuries to pay for it. China’s central bank PBOC has been a steady buyer, continuing purchases for the fourth successive month.
Gold has also been flooding into the U.S. market, especially from London as buyers are looking to avoid tariffs on it going forward. It is not being imported for consumption purposes; rather, it’s being imported for stock piling and a safe haven. Gold, which is real, gives credence to a fiat currency knowing there is something there besides a promise (empty) to pay. And, no, cryptos are not the answer, despite the Trump administration’s attempt to create a crypto reserve. Cryptos, like fiat currencies, are merely a digital promise. They buy nothing (okay, little) and remain a favourite for money launderers and hackers looking to steal your cryptos.
Gold is back over $2,900 and we’d like to see gold hold that level. New lows below $2,844 spell trouble so we do not want to see that. All signs point to higher gold prices. We still have targets up to $3,600, but let’s get through $3,000 first. Economic uncertainty and geopolitical uncertainty—these conditions are ideal for gold. No wonder it has been the best-performing asset (setting aside Bitcoin) since November 5, 2024.
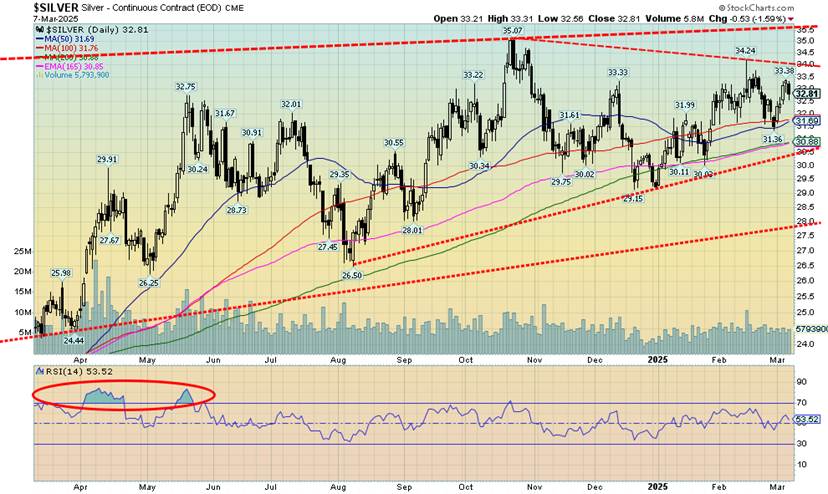
Silver continues to frustrate. That’s setting aside predictions from numerous pundits, including well-known mining guru Eric Sprott, that silver is set to explode with potential targets as high as $200. Right now, even the all-time high seen in 1980 and again in 2011 near $50 seems distant. Silver can’t get out of the way of itself. Stories of supply shortages and more seems to have little impact. Others say shortage, what shortage? When we adjust those two highs for inflation, silver needs to reach $70 to equal 2011 and $193 to equal the 1980 high. No wonder Sprott and others are calling for $200 silver.
All it is, is the equal of the 1980 high on an inflation-adjusted basis. The infamous gold/silver ratio currently sits at a lofty 89. That’s a lot closer to the all-time high of 120 seen during the pandemic scare in 2020 than to the low of 29 seen in 2011 when both gold and silver topped out at the time at record highs. We’ve talked about the potential top in the gold/silver ratio until we are blue in the face, but still the topping pattern has not proved fruitful.
However, with gold at record prices near $3,000, silver becomes attractive on a relative basis. It also has more upside potential if it can get out in front of itself, given how expensive gold is. Silver needs to break above $34 to suggest new highs above $35. At the same time, we would not like to see a pullback that takes out $31. The most recent high was $34.24, and at $32.81 we still need to see a break above $33.55 to suggest new highs above $34.24. We’re waiting.
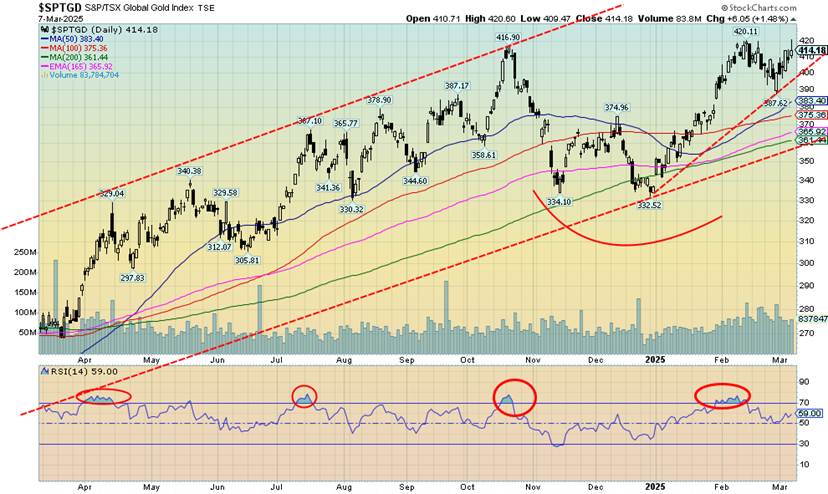
Gold stocks on the move? We have already passed the point that would suggest we should see new highs soon. Despite the weakness in the stock market, gold and gold stocks were up on the week. The TSX Gold Index (TGD) gained 3.5% while the Gold Bugs Index (HUI) did better, up 4.5%. They are now up 23% and 18.6% respectively so far in 2025. Hardly anyone is close. The recent pullback has helped create a potential uptrend line. It breaks if we go back under 400.
The pullback took the TGD from overbought back to neutral. It never got oversold. That could be a positive development. Nonetheless, we need to see new highs, hopefully this coming week. We are only 9% under the 2011 now. But that’s on a nominal basis. On an inflation-adjusted basis we remain almost 34% under the 2011 high. We’ve already passed the point that suggests we should make all-time highs above the nominal basis top of 455 seen in 2011.
So, there is lots to be optimistic about. We’re even seeing some signs of life in the junior gold mining stocks that dominate the TSX Venture Exchange (CDNX). What we haven’t seen is a wholesale move towards them. Any strong move towards these junior stocks could quickly result in doubles, triples, and even 10-baggers in a hurry. It’s a thin market. But they have what the seniors need: more resources.
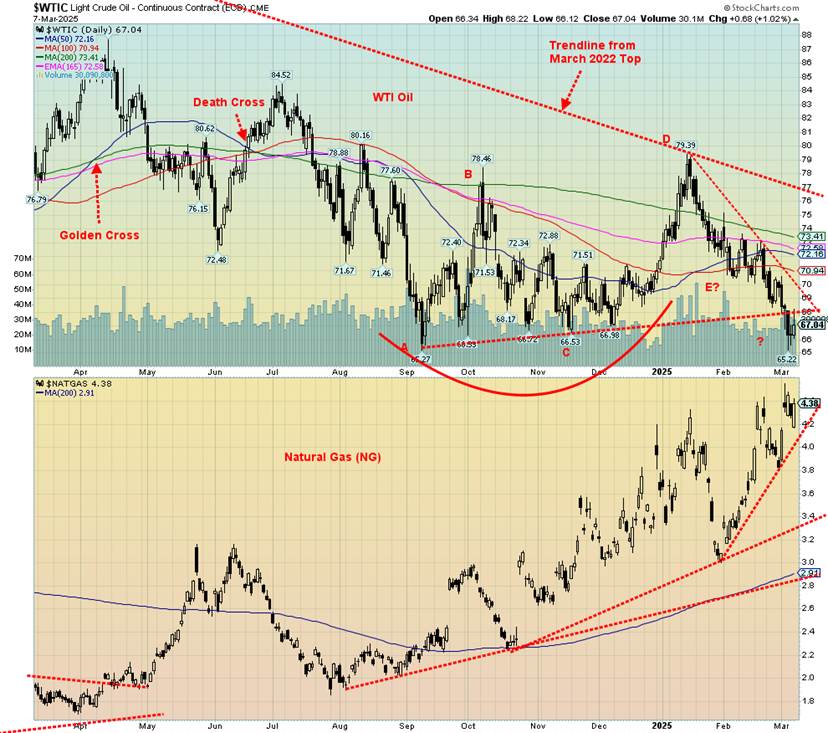
Oil prices are having a rough time. They fell through our $66 support zone. By that measurement, we are now supposed to fall to at least $52. Our saviour could be if we rebound and close solidly back over $70. We continue to believe that this wave is the final one to the downside. The question is, at what level is the bottom? Now, or $52? We have a long way to go to break out. That comes once we are over $77.
So what’s going on? We have a glut. There are trade wars that are negatively impacting demand. There are fears that OPEC will increase production. There are ongoing disputes with Iran, which is positive, and the U.S./China trade war, which is negative. The oil futures curve was in backwardation—meaning that spot was higher than futures months as the futures curve was expecting lower prices ahead. The curve is flattening now, signaling a possible end to the backwardation and a more normal futures curve ahead. Still, trouble is on the way with Trump’s tariffs if he hits oil imports from both Canada and Mexico. That would most likely be positive for oil prices.
On the week, WTI oil fell 3.9% while Brent crude dropped 3.4% and is now barely above $70. The energy stocks didn’t like any of this as the ARCA Oil & Gas Index (XOI) fell 4.3% while the TSX Energy Index (TEN) dropped 4.4%. This is despite a big jump in natural gas (NG) prices. At least NG prices jumped in North America due to increased LNG exports and colder weather.
NG was up 14.4%. However, in the EU it went in the opposite direction—while North America is feeling the cold, the EU is warm. As a result, NG at the Dutch Hub fell 12.5%, offsetting the gains at the Henry Hub. A drop back under $4.20 for NG might help send prices lower, particularly if the weather warms up as is expected.
Another potential catalyst for higher oil prices is the low inventory for U.S. oil stocks and distilates. Both are hanging near the low of their five-year range and need replenishing. Nonetheless, we need to get over $70, then over $77 to suggest to us that low may be in and we are on a potential up wave. A breakdown under $65 could send us lower, towards $60.
__
(Featured image by Adeolu Eletu via Unsplash)
DISCLAIMER: This article was written by a third party contributor and does not reflect the opinion of Born2Invest, its management, staff or its associates. Please review our disclaimer for more information.
This article may include forward-looking statements. These forward-looking statements generally are identified by the words “believe,” “project,” “estimate,” “become,” “plan,” “will,” and similar expressions, including with regards to potential earnings in the Empire Flippers affiliate program. These forward-looking statements involve known and unknown risks as well as uncertainties, including those discussed in the following cautionary statements and elsewhere in this article and on this site. Although the Company may believe that its expectations are based on reasonable assumptions, the actual results that the Company may achieve may differ materially from any forward-looking statements, which reflect the opinions of the management of the Company only as of the date hereof. Additionally, please make sure to read these important disclosures.
Copyright David Chapman 2025
David Chapman is not a registered advisory service and is not an exempt market dealer (EMD) nor a licensed financial advisor. He does not and cannot give individualised market advice. David Chapman has worked in the financial industry for over 40 years including large financial corporations, banks, and investment dealers. The information in this newsletter is intended only for informational and educational purposes. It should not be construed as an offer, a solicitation of an offer or sale of any security. Every effort is made to provide accurate and complete information.
However, we cannot guarantee that there will be no errors. We make no claims, promises or guarantees about the accuracy, completeness, or adequacy of the contents of this commentary and expressly disclaim liability for errors and omissions in the contents of this commentary. David Chapman will always use his best efforts to ensure the accuracy and timeliness of all information. The reader assumes all risk when trading in securities and David Chapman advises consulting a licensed professional financial advisor or portfolio manager such as Enriched Investing Incorporated before proceeding with any trade or idea presented in this newsletter.
David Chapman may own shares in companies mentioned in this newsletter. Before making an investment, prospective investors should review each security’s offering documents which summarize the objectives, fees, expenses and associated risks. David Chapman shares his ideas and opinions for informational and educational purposes only and expects the reader to perform due diligence before considering a position in any security. That includes consulting with your own licensed professional financial advisor such as Enriched Investing Incorporated. Performance is not guaranteed, values change frequently, and past performance may not be repeated.


TopRanked.io Weekly Affiliate Digest: What’s Hot in Affiliate Marketing [Bovada Affiliate Program]
This week, we're mashing up 80s tech with 2020s private messaging apps. Why? Because Big Tech just dropped a big...


Euro Stablecoins Struggle to Compete with Dollar Dominance in Crypto Markets
Euro stablecoins remain marginal despite the euro’s global importance, with minimal trading volume compared to dollar rivals like USDT and...


Gilead Sciences Advances Growth Strategy with Focus on HIV, Oncology, and Innovation
Gilead Sciences focuses on developing treatments for HIV, cancer, and inflammatory diseases, driven by blockbuster drugs like Biktarvy. Growth relies...


Casablanca Stock Exchange Profits Surge in 2025 as Growth Momentum Strengthens
In 2025, Casablanca Stock Exchange profits rose 40% to MAD 50.9 billion. Net income grew 22.3%, driven by strong industrial...


Credibur Scales Rapidly: €2 Billion in Structured Debt Facilities in Six Months
Infrastructure fintech Credibur has added over two billion euros in structured debt facilities within six months. Its platform connects lenders,...
 |
|
 |  |
 |
|
-
 Business1 week ago
TopRanked.io Weekly Affiliate Digest: What’s Hot in Affiliate Marketing [1xBet Affiliate Program]
-

 Crypto5 days ago
Crypto Markets Edge Up as Caution Persists and April Fools’ Scams Loom
-

 Cannabis2 weeks ago
Aurora Shifts Strategy Toward Global Medical Cannabis Markets
-

 Markets7 days ago
Dow Jones Tests Correction Zone Amid Bullish Momentum and Bubble Concerns