Markets
Trump’s Tariff Threats, Stock Market Parallels, and Energy Insights
President-elect Trump’s proposed 25% tariffs on Canada and Mexico sparked controversy, echoing failed 1930s trade policies. Stock market analysis highlights parallels with prior peaks in 1929, 1972, and 2000, cautioning on bubble risks. While markets hit highs, gold weakened seasonally, oil basing, and Secure Energy Services posted robust financial performance, reflecting sector resilience.

One seemingly can’t avoid it. It’s on the news everywhere, quickly becoming the number one topic, at least here in Canada. Yes, the Trump tariffs. Analysts are agog. Economists are dismayed. Everyone else is on the edge of their seat. Newspapers, TV news shows, podcasts are all buzzing with the president elect Trump’s announcement, before he is even inaugurated, that he would put a 25% tariff on all goods exported from Canada and Mexico to the U.S. Oh yes, he’s threatened other countries as well, in particular China and the EU.
But does he really mean it? Or is this just more Trump bluster, an opening salvo for his transactional approach to everything, a big threat just to draw concessions? After all, he needs Congress’s approval, although that’s never stopped him. But what emergency powers does he have? It would raise the price of many items. It would be open to legal challenges; it would disrupt supply chains. Many states whose main trade is with Canada (or Mexico) might object.
That would include every state in the U.S. with more northerly states Canada as their main trading partner and southerly states Mexico. It would negatively impact anywhere from Canadian oil to Mexican food. Imposing these tariffs would most likely be prohibited under the USMC trade agreement. Would he just tear up the agreement that he himself signed?
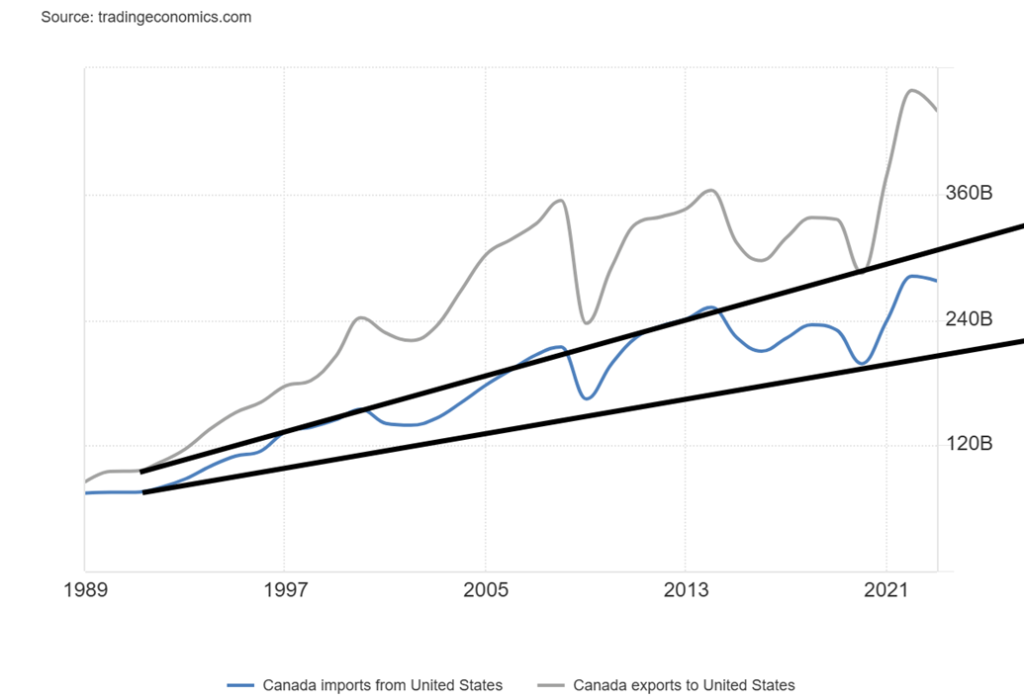
Canada last reported in 2023 that they exported some US$439.6 billion of goods to the U.S. in that year. Canada also imported US$227.0 billion of goods from the U.S. in 2023. Canada’s leading export to the U.S.? Oil and oil products: US$128.5 billion in 2023.
The tariffs would remain in effect until drugs, particularly fentanyl, and illegal aliens stop crossing the border into the U.S. That the problem is considerably larger on the U.S.’s southern border with Mexico is beside the point. That it is Americans heavy use of drugs such as fentanyl (demand) is also beside the point. Mexican President Claudia Sheinbaum noted Mexico would place retaliatory tariffs on the U.S. and that the measures could cost upwards of 400,000 jobs. Trump has promised this will happen on Day 1 of his presidency. Canadian Prime Minister Justin Trudeau visited Trump at Mar-a-Lago the first foreign leader to do so in order to discuss U.S. Canada trade.
It may well be Trump bluster or a negotiating tactic, but everyone—politicians, economists, and businesses—are taking it seriously. It’s all about the U.S., not Canada or Mexico. For that matter, nothing is said about the flow of illegal guns into Canada or Mexico from the U.S.
Canada Exports and Imports to/from the United States 1989–2023
$billions
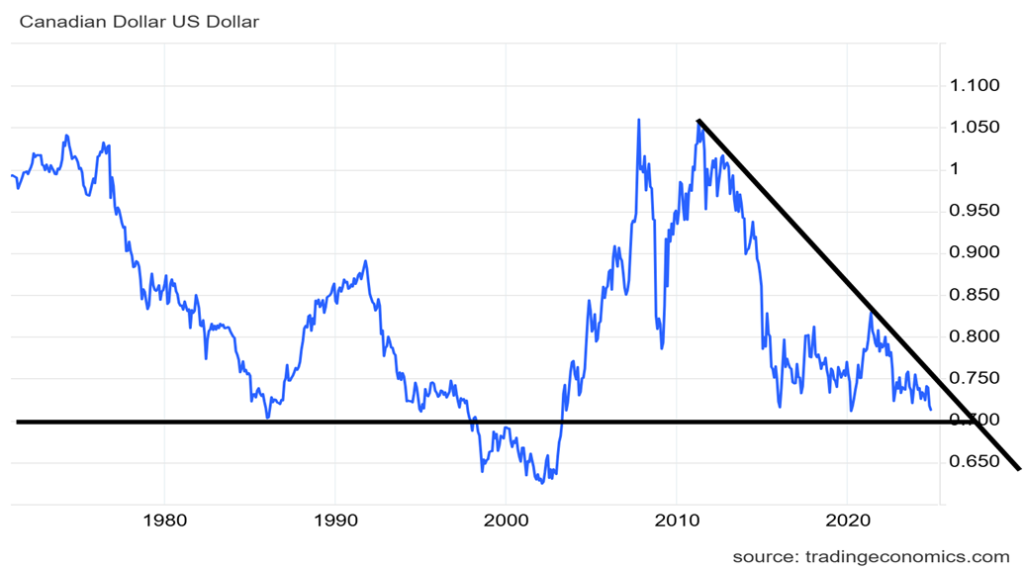
Ah, yes. “Beggar thy neighbour.” These policies were tried in the 1930s, sparked by the Smoot-Hawley Tariff Act of 1930, and all they accomplished were to deepen and prolong the Great Depression. The Canadian dollar (Cdn$ aka “the loonie”) has already taken a hit and is threatening to break below 70.00 (1.42857), a level not seen since the early 2000s. The all-time low for the Cdn$ is 61.86 (1.61655), set in January 2002. There does appear to be some good support for the Cdn$ around 68.00 (1.4706).
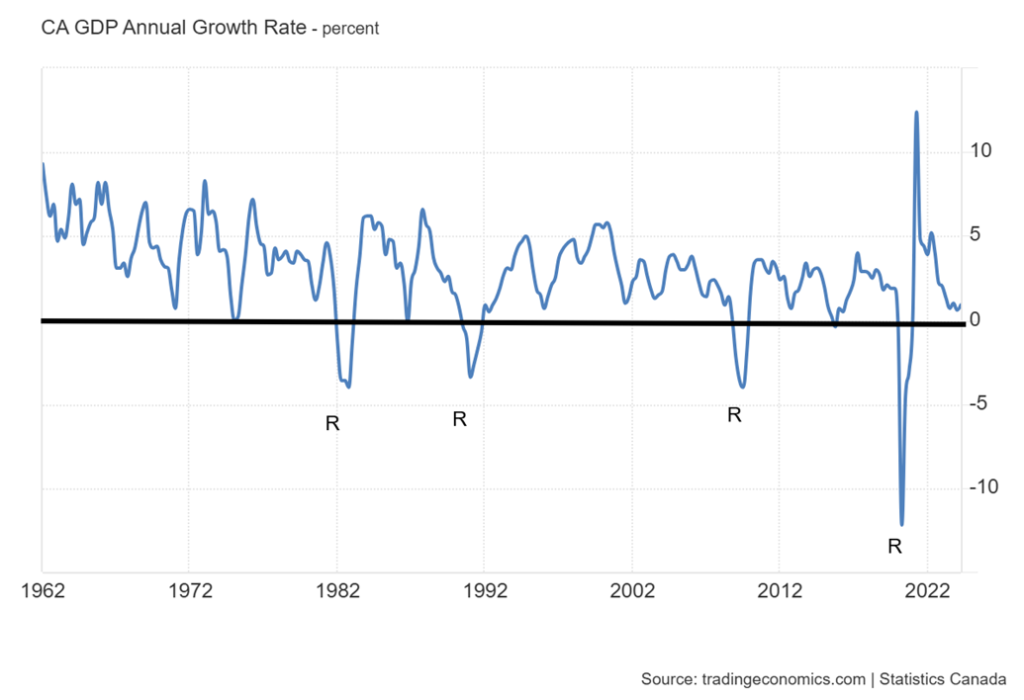
Initially, the threat has seen long rates fall on fears of a prolonged recession. But if the impact on the Cdn$ deepens, the BofC may be forced to raise interest rates rather than cut, as has been the case currently. That in turn could force long rates up as well. Canada’s GDP has been steadily declining since a post-pandemic peak in 2021. However, it remains above an official recession. Canada still has the second-best GDP growth rate in the G7, behind the U.S.
Two-way trade between Canada and the U.S. totals some US$717.0 billion, making Canada the U.S.’s third largest trading partner behind Mexico and China. The U.S. is Canada’s largest trading partner. A trade war between the two countries would negatively impact both, with Canada potentially losing more than the U.S. It would push Canada into a recession. A trade war between Canada and the U.S., or for that matter anywhere in the world, would shrink global trade and potentially push the world into a recession or worse. Globalization, despite its winners and losers, has been a success, but hiding behind trade walls does no one any good. The World Trade Organization (WTO) has been losing support as more move behind tariff walls, disputes arise, or WTO rules are being deliberately broken.
The Sinking Loonie 1982–2024
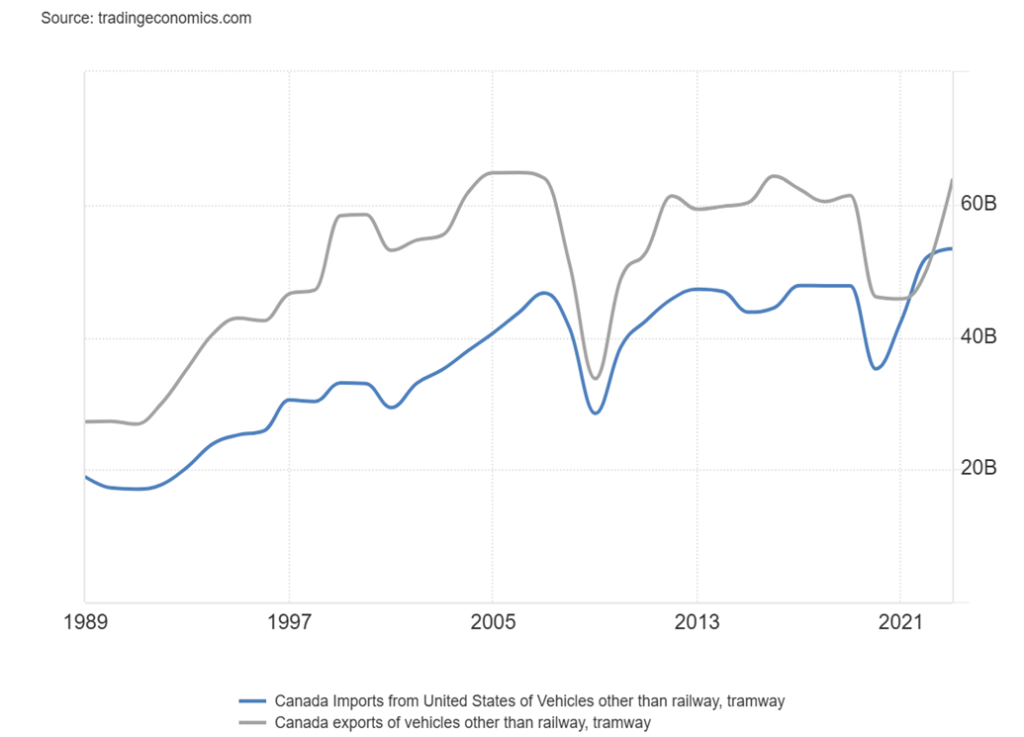
According to Avery Shenfeld, Chief Economist at CIBC, a tariff at the 25% level would no doubt be a major shockwave for Canadian industry, but the affected players would include many US-based companies in industries, like autos, where these companies have integrated supply chains that cross both the US-Canada and US-Mexico border. In 2023, auto trade with the U.S. totaled some US$111.5 billion, made up of US$58.2 billion of exports and US$ 53.3 billion of imports.
So far, the TSX Composite has not reacted negatively to the threat, having quickly moved once again to new all-time highs.
Canada Exports of Vehicles, etc. to the U.S., Canada Imports of Vehicles, etc. from the U.S 1989–2023
We have identified a couple of articles that readers may wish to go to, to try to better understand the dispute. They are:
- “Five things we know so far as Trump threatens tariffs,” The Globe and Mail, November 27, 2024 https://www.theglobeandmail.com/business/article-trump-tariffs-canada-mexico-what-to-know/
- “Trump’s 25% Tariff Threat on Canadian Imports Triggers Fears of Economic Damage,” MorningStar, November 26, 2024
A second Trump presidency already promised to be a roller coaster ride with potentially steep peaks and valleys. It is not even inauguration day, January 20, 2025, and the ride is already underway. More charts follow:
Canada 10-year Government of Canada Bond (CGB), Bank of Canada Interest Rate, Canada Inflation Rate 2015–2024
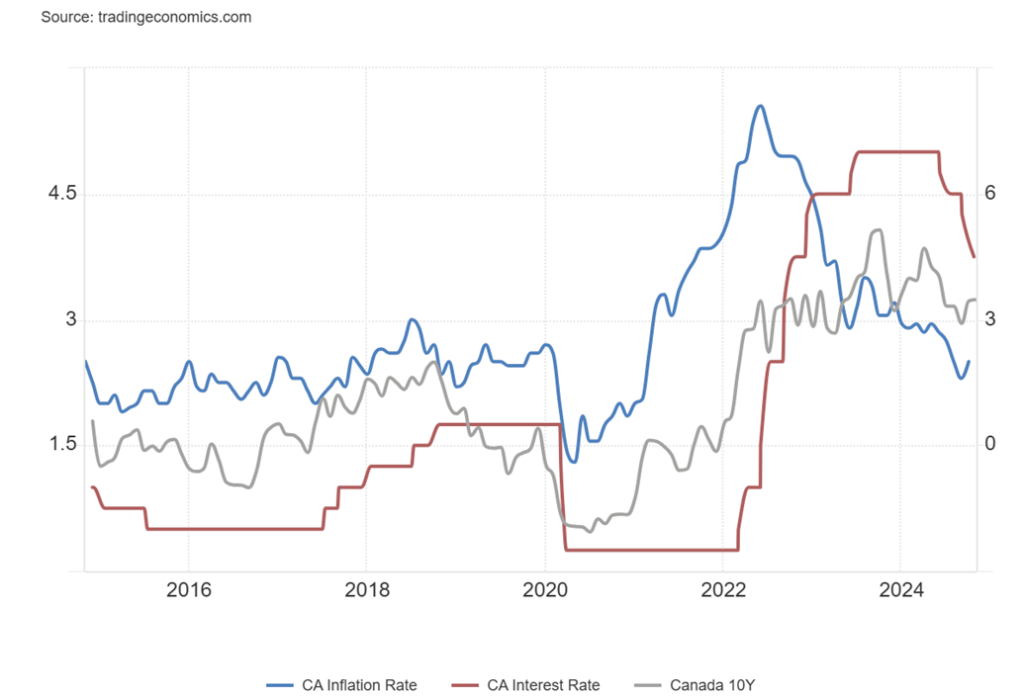
One thing that stands out is that the BofC interest rate is now higher than both the rate of inflation and the Canada 10-year Government of Canada bond (CGB). Following a period of an inverted yield curve from 2020 to 2023, the yield curve has now been normalized. However, as we have noted many times, the switch from a long period of an inverted yield curve to a positive yield curve often signals that a recession could be imminent.
Many are holding to a soft landing, but the rocky nature of a Trump presidency could instead help trigger a hard landing. As we have pointed out before, this is 2024, not 2016. We are in a completely different space. In 2016, we were still coming out of the 2008 financial crisis and Great Recession, along with the EU debt crisis. Stock markets were still in the early stages of a significant rise into 2019/2020 while unemployment was falling. Today, stock markets are grossly overvalued and unemployment is rising. And that is just a part of it.
Canada Annual GDP Growth 1962–2024
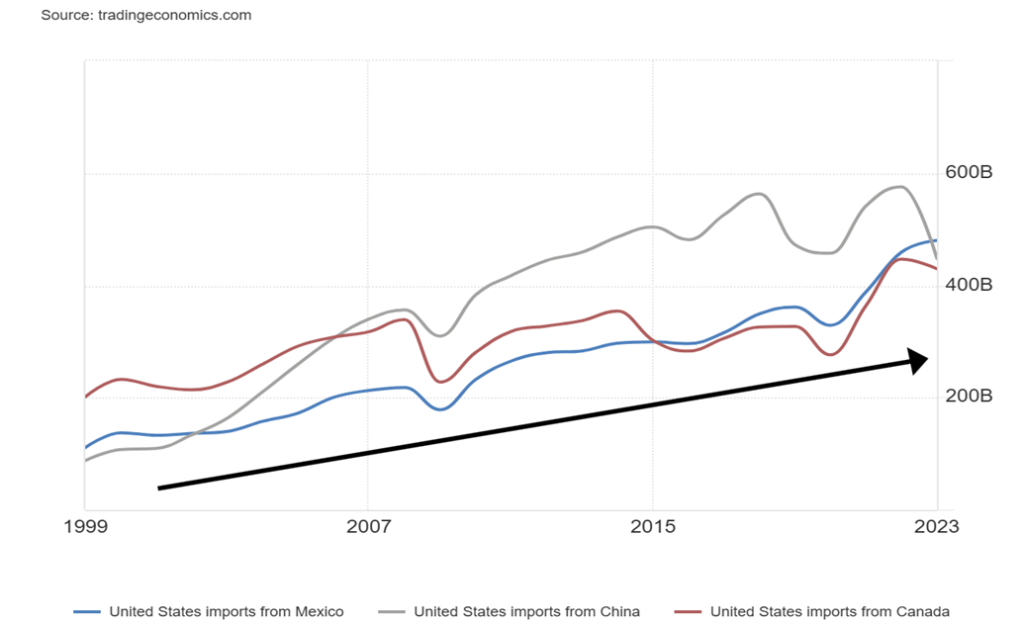
To show just how important China, Mexico, and Canada are to the U.S. for trade, our last two charts show both U.S. imports from them and U.S. exports to them. Together, the three are the U.S.’s largest trading partners by far, with US$2.1815 trillion of combined trade between them last reported in 2023. No others are even close. Imports show in total the U.S. receives US$1.358 trillion of goods from them (Mexico US$481.1 billion, China US$448.0 billion, and Canada US$429.6 billion) and exports US$823.8 billion to all three (Canada US$352.7 billion, Mexico US$323.2 billion, and China US$147.8 billion). This is not insignificant. Picking a trade war with your three largest trading partners is going to hurt you as much as it will hurt them.
As we have noted, this may be all Trump bluster, an opening salvo to negotiate further to get what he wants (a form of blackmail). But negotiations are all about trade-offs and, as we have discovered, Trump plays to win. A trade war would be lose-lose for everyone, as they discovered in the 1930s.
U.S. Imports from China, Mexico and Canada 1999–2023
U.S. Exports to China, Mexico, and Canada 1999–2023
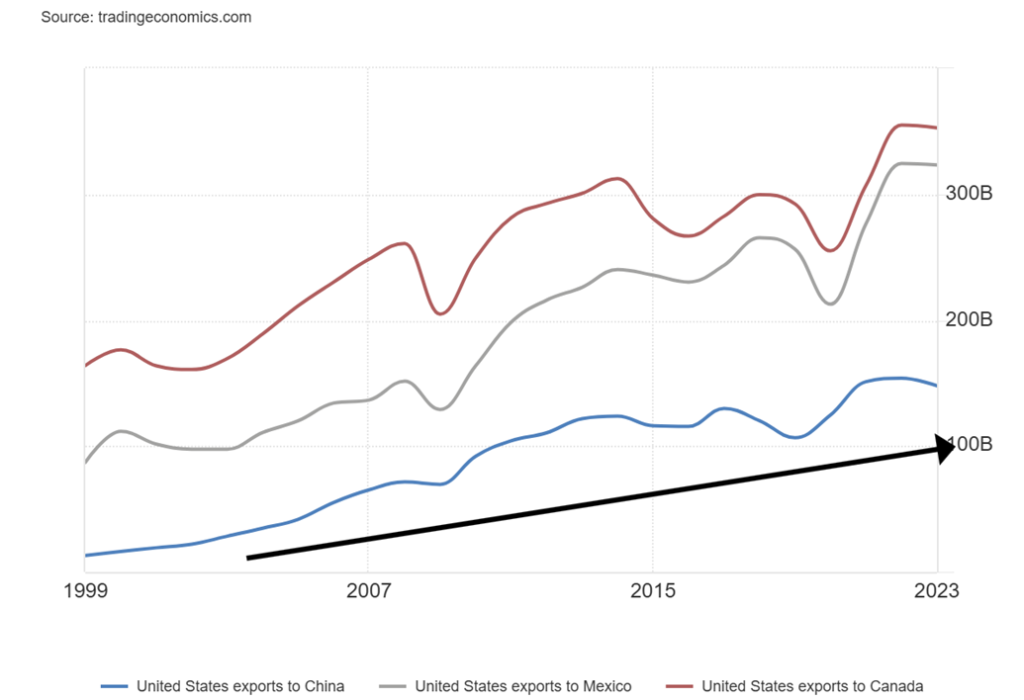
Chart of the Week
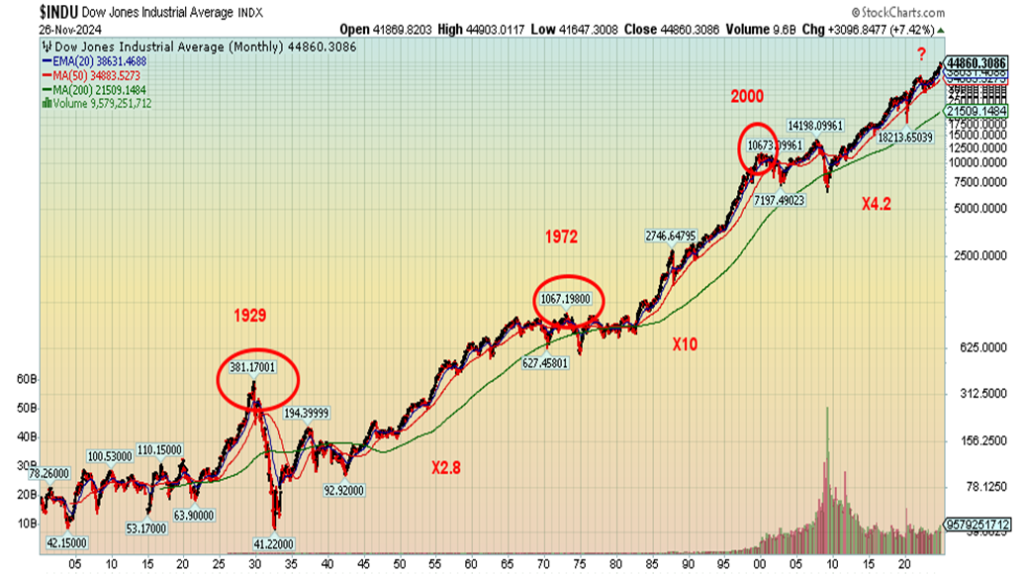
Our chart shows the Dow Jones Industrials (DJI) for the past century or so. What stands out are three important tops during this period: the 1929 Roaring 20s bubble top, the 1972 Vietnam War and Nifty Fifty top, and the 2000 dot.com bubble top. Those tops were followed by declines of 89.2%, 45.1%, and 53.8% respectively for the Dow Jones Industrials (DJI). The 1929 decline lasted about two years, the 1972 (final top was January 1973) also lasted about two years, while the 2000 top decline lasted nine years but was broken into two phases: the dot.com bubble collapse in 2000–2002, followed later by the financial crisis housing bubble collapse in 2007–2009 aka The Great Recession.
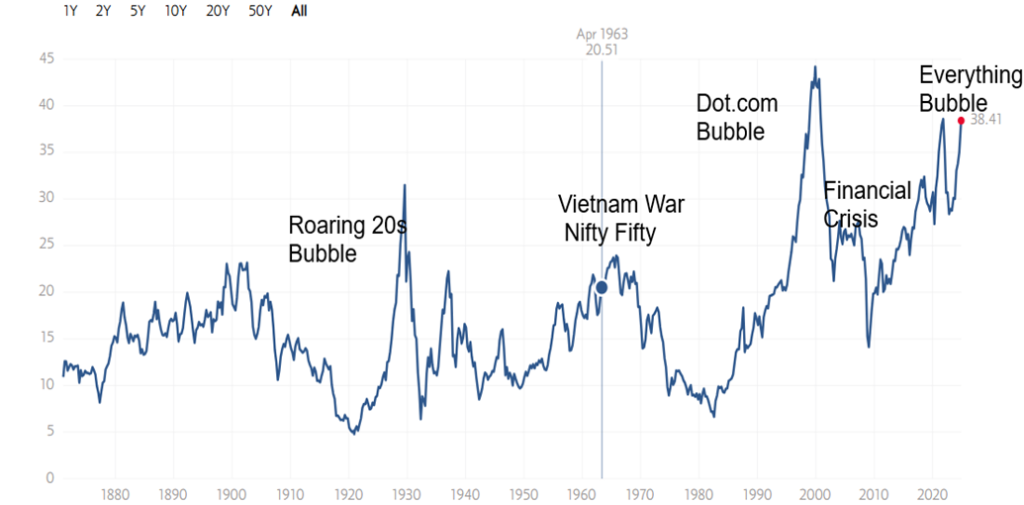
In between were impressive rallies. From the peak in 1929 to the peak in 1972, the DJI multiplied 2.8 times. The period from 1972 to 2000 was even more impressive as the DJI multiplied 10 times. To date, the current run for the DJI from 2000 to present has seen the DJI rise 4.2 times. Sharp corrections are followed by impressive rallies. Each peak was preceded by a sharp rise in the Shiller P/E, as our next chart suggests. An exception was the 2008 financial crisis and Great Recession where the P/E was lower than where it was during the dot.com bubble. Today’s P/E is the second highest on record behind the dot.com peak of 2000. The 1972 top was actually nominally made in 1966 when the P/E was higher than at the 1972 top.
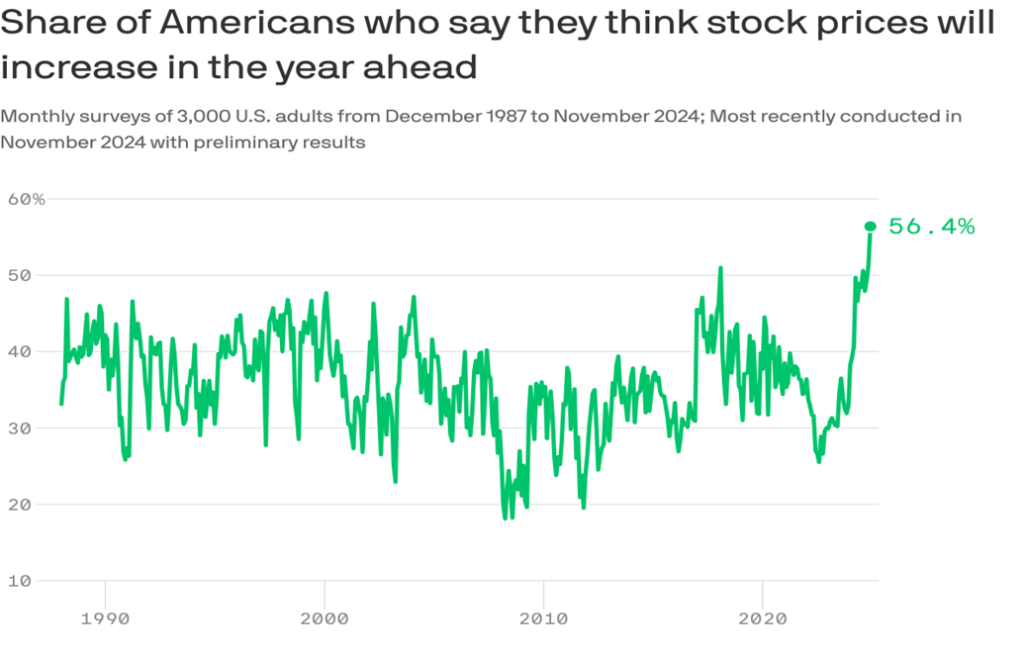
What is shocking is the complacency that exists in the market today, with the percentage of Americans who think the stock market will go higher this coming year, already at record levels (third chart). This optimism contrasts sharply with forecasts from Wall Street, Bay Street, and other analysts. This optimism also contrasts sharply with the consumer indices of the Conference Board and the Michigan Sentiment Index. All this seems to be yet another sign of overconfidence and complacency in the market. The CNN Fear Greed Index is also registering Greed. The potential for an important high coming is more likely than a continuation of the bull market.
Shiller P/E 1871–2024
Markets & Trends
| % Gains (Losses) Trends | ||||||||
| Close Dec 31/23 | Close Nov 29, 2024 | Week | YTD | Daily (Short Term) | Weekly (Intermediate) | Monthly (Long Term) | ||
| Stock Market Indices | ||||||||
| S&P 500 | 4,769.83 | 6,032.38 (new highs)* | 1.1% | 26.5% | up | up | up | |
| Dow Jones Industrials | 37,689.54 | 44,910.65 (new highs)* | 1.4% | 19.2% | up | up | up | |
| Dow Jones Transport | 15,898.85 | 17,618.63 (new highs) | 1.5% | 10.8% | up | up | up | |
| NASDAQ | 15,011.35 | 19,218.17 | 1.1% | 28.0% | up | up | up | |
| S&P/TSX Composite | 20,958.54 | 25,648.00 (new highs)* | 0.8% | 22.4% | up | up | up | |
| S&P/TSX Venture (CDNX) | 552.90 | 614.26 | 1.3% | 11.1% | up | up | down (weak) | |
| S&P 600 (small) | 1,318.26 | 1,532.61 (new highs)* | 1.0% | 16.3% | up | up | up | |
| MSCI World | 2,260.96 | 2,353.26 | 1.1% | 4.1% | down | up | up | |
| Bitcoin | 41,987.29 | 97,429.19 | (1.6)% | 132.0% | up | up | up | |
| Gold Mining Stock Indices | ||||||||
| Gold Bugs Index (HUI) | 243.31 | 301.10 | (2.3)% | 23.8% | down | up | up | |
| TSX Gold Index (TGD) | 284.56 | 358.18 | (2.1)% | 25.9% | down | up | up | |
| % | ||||||||
| U.S. 10-Year Treasury Bond yield | 3.87% | 4.18% | (5.4)% | 8.0% | ||||
| Cdn. 10-Year Bond CGB yield | 3.11% | 3.11% | (10.1)% | flat | ||||
| Recession Watch Spreads | ||||||||
| U.S. 2-year 10-year Treasury spread | (0.38)% | 0.02 | (33.3)% | 105.3% | ||||
| Cdn 2-year 10-year CGB spread | (0.78)% | 0.06% | (14.3)% | 107.7% | ||||
| Currencies | ||||||||
| US$ Index | 101.03 | 105.75 | (1.7)% | 4.7% | up | up | up | |
| Canadian $ | 75.60 | 71.45 | (0.1)% | (5.5)% | down | down | down | |
| Euro | 110.36 | 105.73 | 1.5% | (4.2)% | down | down | down (weak) | |
| Swiss Franc | 118.84 | 113.55 | 1.6% | (4.5)% | down | neutral | up | |
| British Pound | 127.31 | 127.28 | 1.6% | flat | down | down (weak) | neutral | |
| Japanese Yen | 70.91 | 66.84 | 3.5% | (5.7)% | up | neutral | down | |
| Precious Metals | ||||||||
| Gold | 2,071.80 | 2,681.00 | (1.2)% | 29.4% | neutral | up | up | |
| Silver | 24.09 | 31.11 | (0.7)% | 29.1% | down | up (weak) | up | |
| Platinum | 1,023.20 | 954.10 | (2.2)% | (6.7)% | down | down (weak) | down (weak) | |
| Base Metals | ||||||||
| Palladium | 1,140.20 | 995.50 | (2.3)% | (12.7)% | down | neutral | down | |
| Copper | 3.89 | 4.14 | 1.2% | 6.4% | down | down | up (weak) | |
| Energy | ||||||||
| WTI Oil | 71.70 | 68.15 | (4.3)% | (5.0)% | down | down | down | |
| Nat Gas | 2.56 | 3.36 | 2.1% | 31.3% | up | up | down (weak) | |
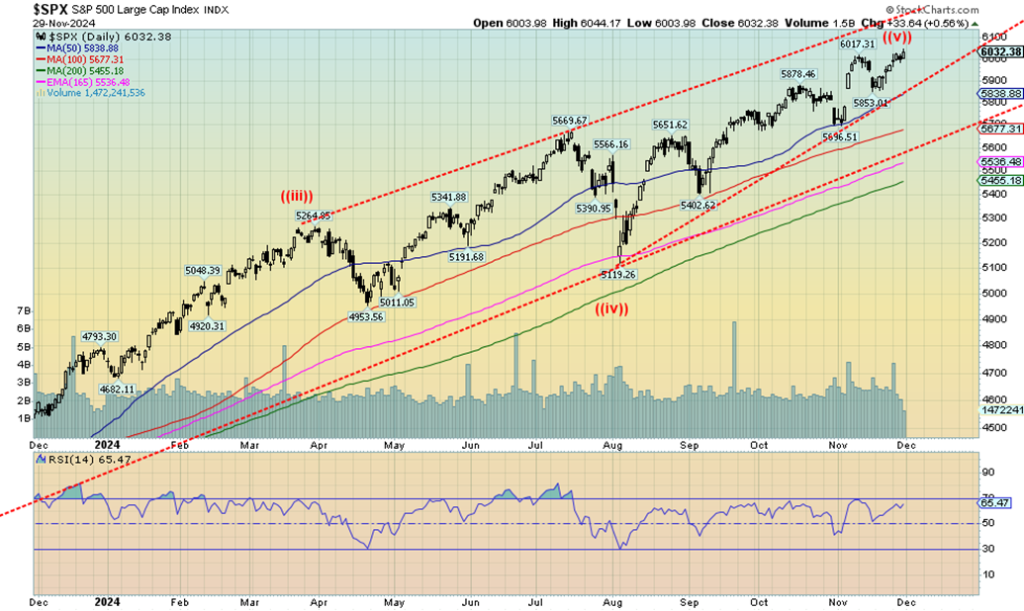
What can we say? Every time we believe we may have topped, the pullback is shallow, and then it’s onward and upward to yet another all-time high. It’s getting crazy. But such are the nature of bubbles, and we have been in a bubble. When it ends, the fall won’t be pretty as that is how all bubbles end.
Yes, the S&P 500 (SPX) once again made all-time highs, up 1.1% on the week, the Dow Jones Industrials (DJI) gained 1.4% to all-time highs, while the Dow Jones Transportations (DJT) was up 1.5% but remains well off its all-time highs. It did, however, make 52-week highs. The divergence? The NASDAQ gained 1.1% but did not join its brethren making all-time highs. However, in a possible head fake, the S&P 400 (Mid) and the S&P 600 (Small) also made all-time highs, up 0.7% and 1.0% respectively. For the record, all-time highs were also seen for the Dow Jones Composite (DJC), the Dow Jones Utilities (DJU), the Wilshire 5000, the Russell 1000, 2000, and 3000.
Surprisingly, not making an all-time high was the S&P 100 (OEX), which is the large cap version of the S&P indices. This is a divergence that could be significant. Bitcoin also did not join the parade and actually fell 1.6%.
In Canada, the TSX Composite did make all-time highs (again), up 0.8%, while the TSX Venture Exchange (CDNX) gained 1.3%. In the EU, the London FTSE was up a small 0.3%, the EuroNext fell 0.3%, the Paris CAC 40 was also off 0.3%, but the German DAX gained 1.6%. In Asia, China’s Shanghai Index (SSEC) gained 1.8%, the Tokyo Nikkei Dow (TKN) was down 0.2%, and Hong Kong’s Hang Seng (HSI) gained 1.0%.
It was a holiday-shortened week for the indices, so trading was thin. Nonetheless, the market still seems enamoured by the potential for business-friendly policies from the Trump administration and the market was friendly towards the appointment of hedge fund manager Scott Bessent to Treasury. It was Black Friday and sales were reported to be good. Big retailers like Walmart, Costco, and Target all gained. It was hoped that the appointment of Bessent might help temper Trump’s desire for tariffs, which, as have been outlined, are potentially damaging.
It’s been a wild up year with the SPX, up 26.5%. It’s also a bubble—and we’ve never seen a bubble that doesn’t burst. When? That is harder to call, but the market is, as we have noted, very overvalued up here so caution is warranted. Greed is still driving the market. The break point now comes at 5,850, but a better one occurs at 5,700. Under 5,400 and it could be all over; under 5,100 spells panic. We still have, in theory, room to wiggle higher within the context of the bull channel. However, we’d be very cautious as we continue to see distribution, insider selling, and smart money getting out.
Oh yes, we still have the wild cards of the Russia/Ukraine and Israel/Gaza/Hezbollah/Iran wars. The cease fire with Hezbollah seems to have lasted five minutes, with each side accusing the other.
Caveat emptor.
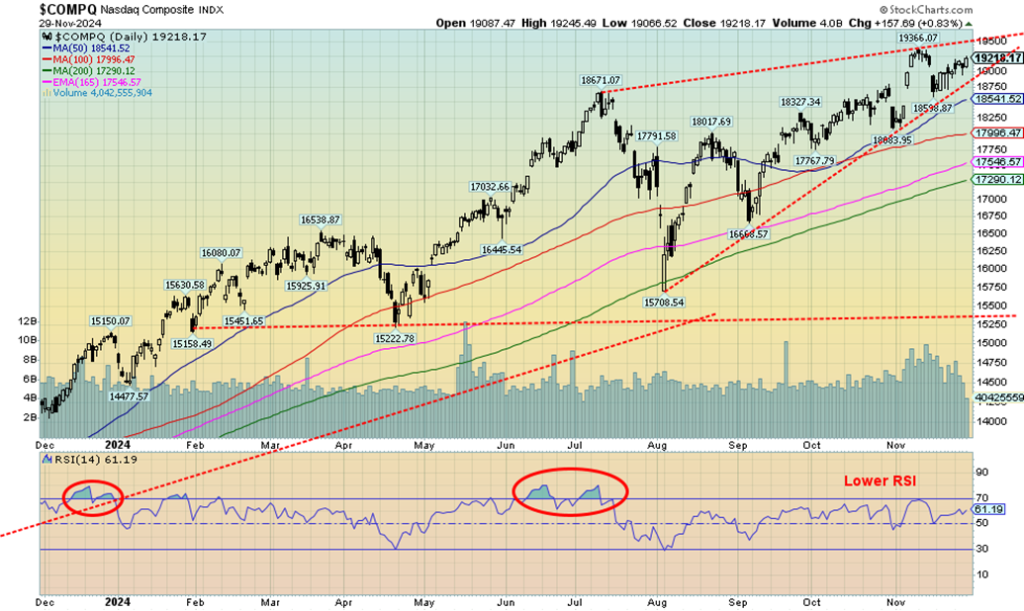
The NASDAQ gained 1.1% this past week but did not join its fellow indices in making all-time highs. To put it simply, we see the MAG7/FAANGs sector rolling over, suggesting the next move should be down, not up. The NY FANG Index was off a small 0.1%. Of the MAG7, Apple made new all-time highs, up 3.3%, but Tesla fell 2.1% on the week, despite making new all-time highs. A reversal? Amazon gained 5.5%, Meta was up 2.7%, and Google up 2.4%.
Winners as well were Baidu, up 5.9%, and Alibaba, up 5.1%. But Baidu remains down on the year and Alibaba is barely up. The big winner on the year Nvidia fell 2.6%. Is that a signal the party is over? Netflix lost 1.2% as well. Given the wobbliness with the MAG7/FAANGs making clear distribution/topping patterns, we’d be cautious on the entire market. That’s a huge ascending wedge triangle (bearish) that the NASDAQ is making and, if it breaks under 18,750, we could, in theory, fall all the way back to 15,500. Caution is warranted.
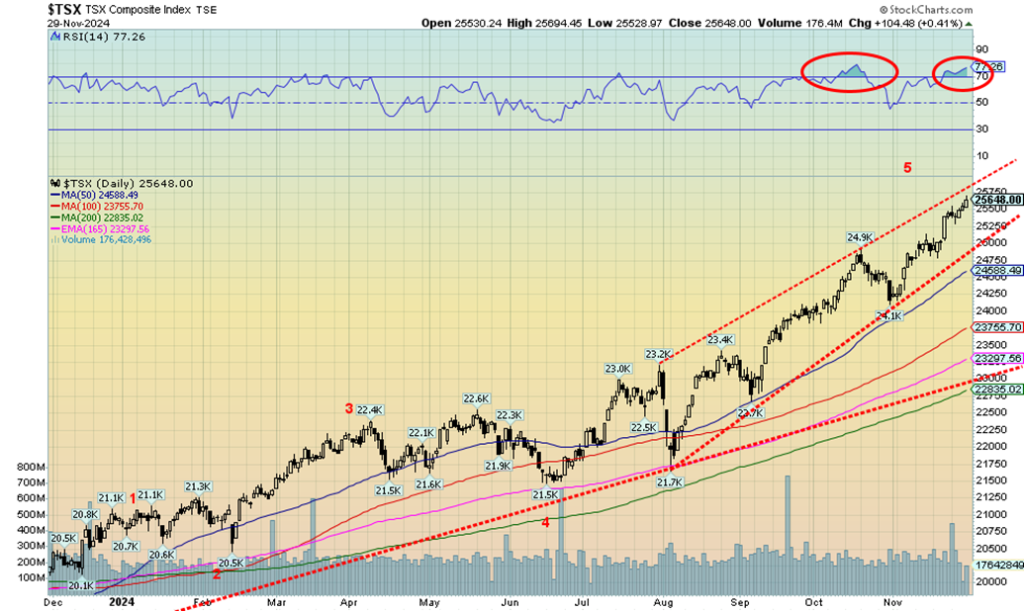
Once again, the TSX Composite soared to new heights. So did the RSI indicator, now at 77.3 and firmly in overbought territory. The question is, will it just be a pullback or will it signal the final top (as we’ve thought many times before)? The TSX gained 0.8% this past week to new heights while the junior TSX Venture Exchange (CDNX) was up 1.3% on the week. Nonetheless, the CDNX remains so far off its all-time high it can’t even see it, let alone contemplate being that high. In all, the CDNX is down almost 82% from its all-time high in 2007.
It’s still down about 45% from its high in February 2021. Misery is the CDNX. Still, we believe it only has one way to go and that is up, once everyone figures out how cheap everything there is, especially in the junior gold mining sector. It was like that in the late 1990s/early 2000s as well. At that time, we thought the CDNX had only one way to go and that was up. The feeling is the same today.
For the TSX, we are close to the top of the channel so that should act as resistance. The breakdown point remains at around 25,000. Below that, 24,100 remains an even better breakdown point. Volume was poor this week so this rally has become highly suspect. On the week, only four of the 14 sub-indices were down. The hardest hit was the materials, the mining sector and energy, with Energy (TEN) down 3.2%, Golds TGD down 2.1%, Materials TMT down 1.2%, and Metals & Mining TGM off 0.7%. Four sub-indices made all time highs: Consumer Discretionary TCD, up 1.0%, Consumer Staples TCS, up 2.2%, Financials TFS gaining 1.2%, while Information Technology TKK jumped 3.8%. TKK was the clear winner on the week. Health Care THC was up 2.8%.
We seem to be on a fifth wave up from a low in June 2024, so we wouldn’t put too much faith in this rising further. If, as we suspect, the commodity sector (gold, materials, metals, and energy) heats up, it still might not be enough to raise the TSX, given the domination of Financials.
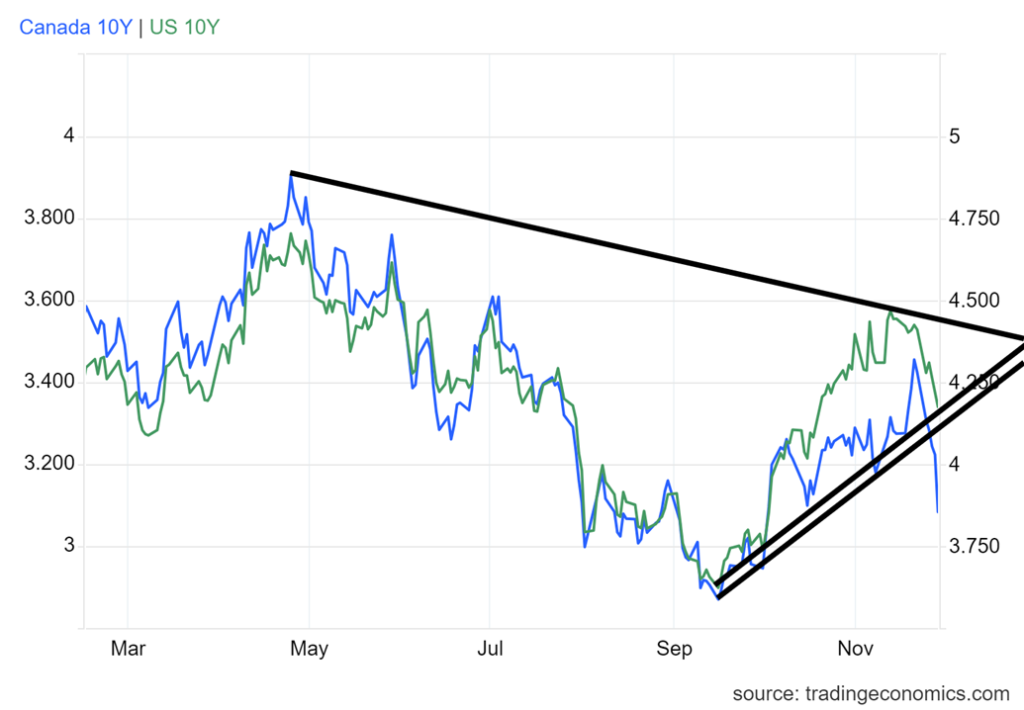
U.S. 10-year Treasury Note, Canada 10-year Bond CGB
The appointment of Scott Bessent at Treasury seemed to ease some concern over any drastic policy shifts. PCE prices came in line with expectations at 1.5% in Q2 and at 2.6% year over year (y-o-y). Expectations were 1.5% and 2.5%. Q2 GDP growth remained at 2.8% as was expected and below the previous report of 3% growth. The Chicago PMI was 40.2, below the expected 44 and below last month’s 41.6. The manufacturing sector is still showing recession. Initial jobless claims were 213,000, same as the previous week but below the expected 215,000.
The labour market still shows life. This Friday, December 6 we get the jobs report with nonfarm payrolls expected at 194,000 vs. last month’s 12,000. Expect revisions as the previous month was impacted by the hurricanes. The unemployment rate is expected to be 4.1%, the same as last month.
Canada also reports its job numbers, with expectations of gaining 32,000 jobs and an unemployment rate of 6.5%, also unchanged. Canada’s much higher number is a result of different calculating methods. According to Statistics Canada www.statcan.gc.ca reporting Canada’s unemployment using similar methods as the U.S. the rate (R3) would be 5.2%.
On the week, the U.S. 10-year treasury note fell 24 bp to 4.18% vs. 4.42%. The Canada 10-year Government of Canada bond (CGB) fell 35 bp to 3.11% from 3.46%. The 2–10 spread was still recessionary at +2bp in the U.S. and +6bp in Canada. The U.S. yield appears to have broken support and Canada is on the cusp of breaking support. Is this a correction to the recent upswing, or is it the start of a new leg down for bond yields? Let’s get under 4% in the U.S. and under 3% in Canada to determine that. Lower long-term rates help set mortgage rates.
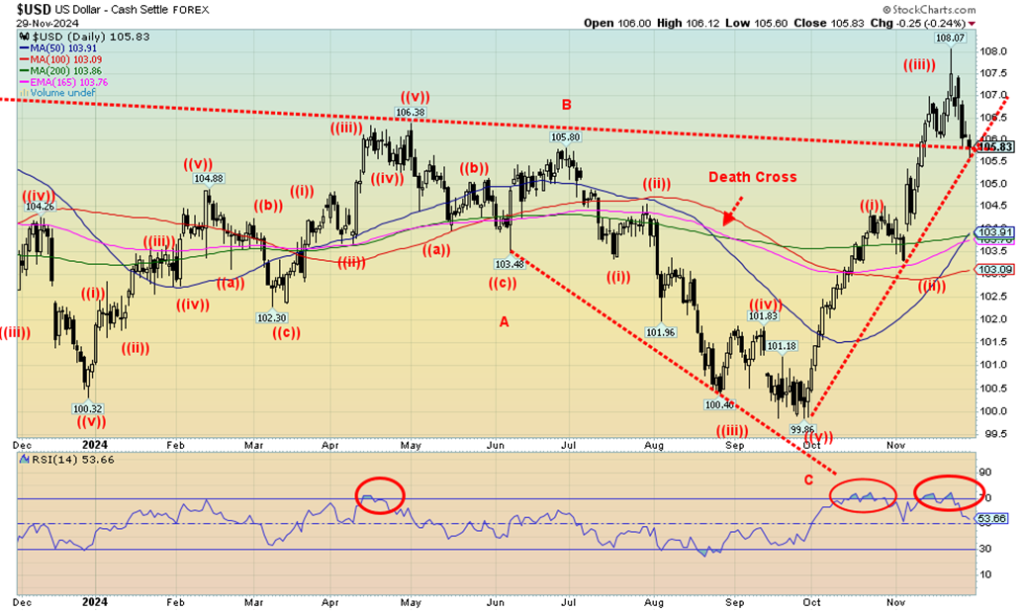
Is the U.S. dollar rally over? That’s a legitimate question, given the US$ Index fell 1.7% this past week, the steepest drop since August. The other currencies responded positively with the euro up 1.5%, the Swiss franc gaining 1.6%, the pound sterling up 1.6% as well, and the Japanese yen up 3.5%. Only the Cdn$ was down, off a small 0.1% over the Trump’s proposed steep tariffs. The US$ Index is now down, testing that breakout line, just under 106.00.
A break below 105.50 could send us tumbling to support to near 104.00. It has been a steep, almost straight-up move for the US$ Index, but the bloom may be coming off. Helping to push the US$ Index lower this week was Trump’s appointment of Scott Bessent as Treasury Secretary. It brings some stability to the post, given Bessent’s long experience in financial markets. Bessent, like Trump, would like to see a lower U.S. dollar. Both are also believers in gold. Gold did well under Trump 1 as it gained roughly 56% during his first tenure. For whatever reason, gold tends to do well under Republican presidents.
Under Biden, gold is up roughly 44%. No, neither Trump or Biden are directly involved in the gold market, but it is their policies, along with events that occur, that help (or hinder) gold’s rise. The US$ Index had been going through considerable overbought conditions, so in some ways this is a relief. We’d have to get back above 107.50 to think about new highs.
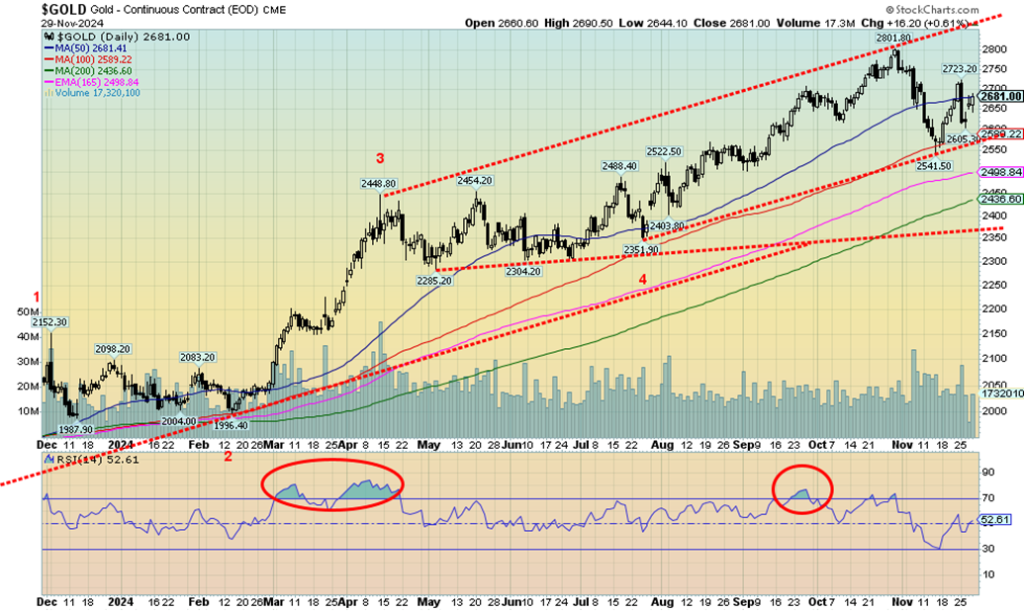
Gold took a nasty hit last Monday, November 25 as gold (and silver) had a mini-heart attack over stronger PCE prices and the ongoing resilient U.S. economy. Gold fell 3.5%. Gold then spent the rest of week recovering, down only about 1.2% at close. Silver fell 0.7%, a positive sign that it is outperforming gold, while platinum was off 2.2%. Of the near precious metals, palladium dropped 2.3% but copper gained 1.2%, a positive move as copper often leads gold.
The gold stocks fared badly as well with the Gold Bugs Index (HUI) off 2.3% and the TSX Gold Index (TGD) down 2.1%. On the year, only platinum and palladium are down, off 6.8% and 12.7%. Gold, silver, and copper remain up on the year: 29.4%, 29.1%, and 6.4%. The HUI and TGD are also up on the year at 23.8% and 25.9%. We’d prefer to see the gold stocks outpacing gold itself. That would be a positive development.
Following the November 25 debacle, gold spent the rest of the week recovering as a falling U.S. dollar and the upping of tensions between Russia/Ukraine took hold. The peace agreement between Israel/Hezbollah was announced but, in no time, breaches were seen on both sides. Gold acts as a safe haven from geopolitical tensions and even domestic political tensions. A loss of confidence in government would spur gold sales. Despite gold’s recent debacle, demand for it has been strong, particularly with central banks (the latest being the Eastern European central banks) loading up and strong demand in Asia.
October/December is often a weak period for gold following strength in August/September. We saw important lows for gold in December 2015, 2016 and in November 2022. Once a low is found, we often rally into January/February. The question is identifying the bottom and when. We are looking at the FOMC meeting on December 17–18 as a potential period for a potential low. Of course, that is over two weeks away so, as we always say about the gold market, it is going higher but patience is required through these pullbacks. Above $2,725 would be positive and above $2,740 new highs become probable.
The strong US$ Index helped propel gold higher in other currencies, but they pulled back a little as the US$ Index weakened this past week. To the downside, a break of $2,550 would be quite unfriendly but good support below that is at $2,450/$2,500. We don’t believe we’ll fall that far, but we have to be prepared if we do. Irrespective of this, a low sometime this month should occur.
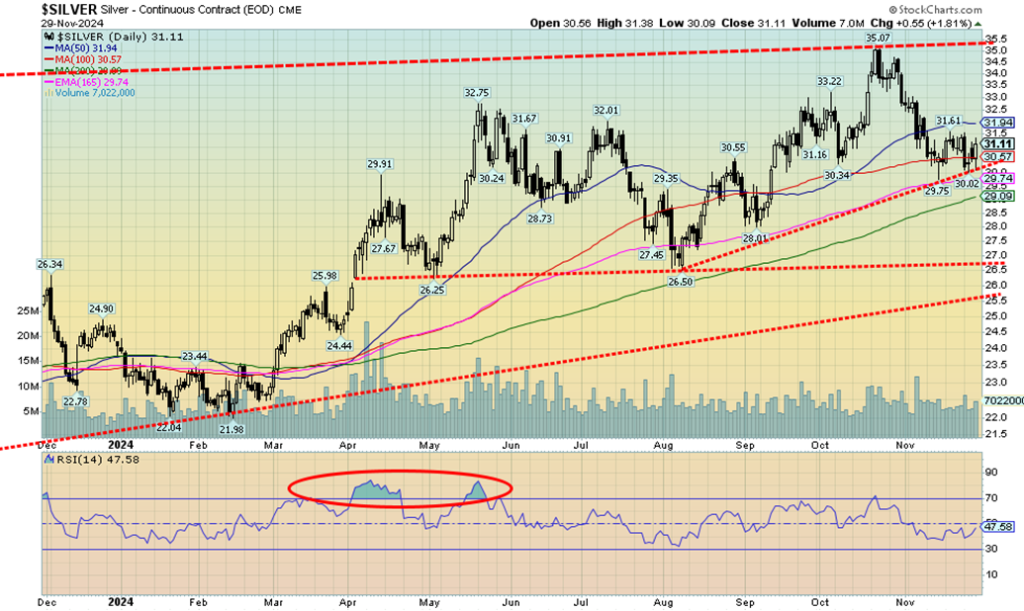
It was a pretty quiet week for silver. The best part was that, given that both gold and silver fell, silver actually outperformed, down 0.7% vs. gold down about 1.2%. The bad day was November 25 when silver fell, along with gold, down 3.5%. However, after that silver just range traded and ended the week down only 0.7%. Like gold, silver attracts safe-haven funds, given the ongoing conflicts in Russia/Ukraine and Israel/Gaza/Hezbollah/Iran. So far, it looks like silver is holding that uptrend line currently near $30.
Below $30 we could fall back to $29 and the 200-day MA. We need to first break above $32 and especially above $34. Above $34 (even above $33.80), new highs above $35 become probable. We maintain our targets of $39/$40. It has just been a struggle to get there. And with a gold/silver ratio of 86, silver remains ridiculously cheap compared to gold. It has been in this range for so long that people think it’s normal. As we’ve noted many times, silver tends to lead in both up and down markets. This past week, with silver outperforming gold, we view that as potentially positive.
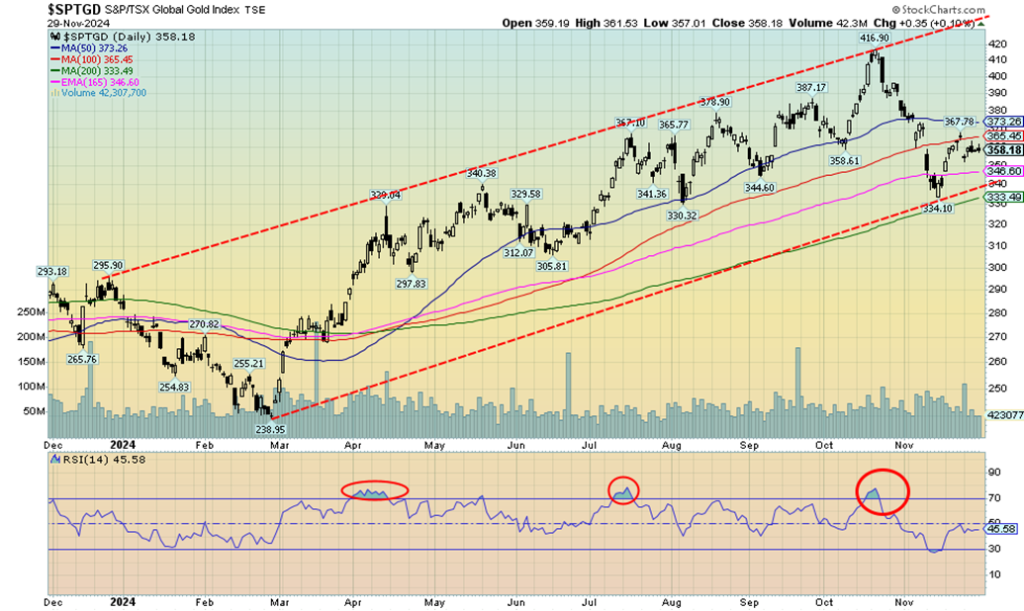
Following a strong up week the previous week, this week saw what appears to be a corrective pullback. The TSX Gold Index (TGD) fell 2.1% while the Gold Bugs Index (HUI) was off 2.3%. Nothing much changed. With gold and silver both off on the week, it was no surprise the gold stocks fell as well. Technically, the rebound stopped just short of the 50-day MA. That sets in motion a move back above 370 that could take us to the next level near 400. Overall, the drop since the October peak was about 20%.
As we have noted, this is not unusual as the big run-up in 2009–2011 saw more than a few drops of at least around 15 drops on their way to record highs. Such is the thin and volatile nature of the gold market which, compared to the broader stock market and the bond market, is small. There continues to be good support down to 340, but a drop under that level and especially under 330 could propel us even lower. Nonetheless, we are working off the overbought levels hit in October and are currently neutral. However, a move above 375 and especially above 400 would be positive. Above 400 new highs are probable.
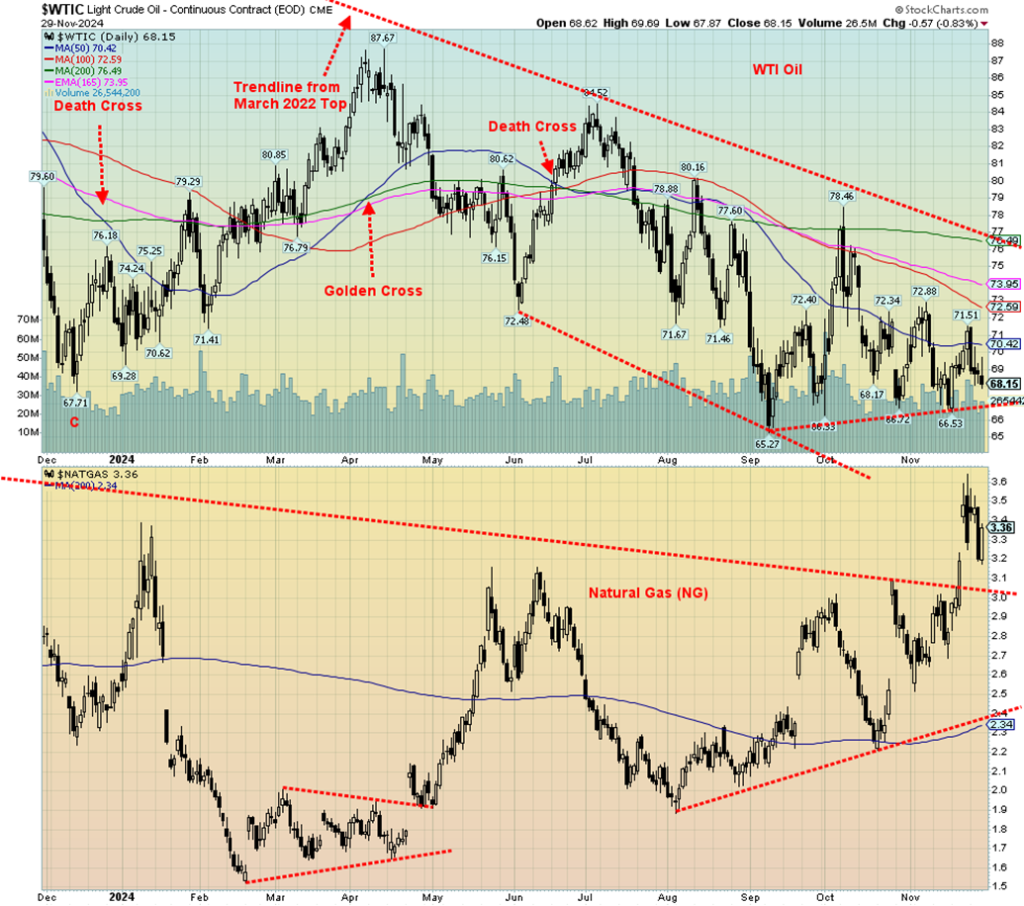
Once again, oil prices fell this past week as cease fires and lower demand weighed on the market. WTI oil fell 4.3% while Brent crude was off 3.9%. Despite cease fires in the Israeli/Hezbollah war and an upping in the Russia/Ukraine war, oil prices fell. OPEC delayed its meeting and Iran remains firmly in the background, but that could change as Iran was at the forefront of Trump’s former policy moves, upping the tension in the Gulf. As a result, OPEC is maintaining its cutbacks and there is talk of putting off proposed production hikes into January 2025. The production cuts help maintain higher prices.
Colder weather has helped spike natural gas (NG). NG at the Henry Hub was up 2.1% while NG at the EU Dutch Hub gained about 2.2%. The EU is also more concerned about the goings-on with the Russia/Ukraine conflict and the ongoing conflict in the Middle East. The energy stocks didn’t seem to enjoy all the uncertainty—the ARCA Oil & Gas Index (XOI) fell 1.9% while Canada’s TSX Energy Index (TEN) dropped 3.2%.
Technically, WTI continues to hold above that platform, currently around $67. A firm drop under that level could target WTI oil down to around $54. But it also could just be a platform to launch higher prices. Given global tensions, that could explode anywhere/anytime and, with weather cooling as we move into December, the odds are more in favour of an upward rather than a downward move. That’s particularly true of NG, which now appears to have broken out and is currently holding above $3. The current small pullback saw NG rally on Friday. Could it be the start of another upward thrust? The high so far is around $3.60. Above that level we could head for $4.
Lots of uncertainty surrounding energy prices. In the end, we expect geopolitics to win and push prices higher. We are also entering the strong seasonal period of oil and gas. That usually ensures prices rise, regardless of other factors. But much depends on weather and war.
__
(Featured image by History in HD via Unsplash)
DISCLAIMER: This article was written by a third party contributor and does not reflect the opinion of Born2Invest, its management, staff or its associates. Please review our disclaimer for more information.
This article may include forward-looking statements. These forward-looking statements generally are identified by the words “believe,” “project,” “estimate,” “become,” “plan,” “will,” and similar expressions, including with regards to potential earnings in the Empire Flippers affiliate program. These forward-looking statements involve known and unknown risks as well as uncertainties, including those discussed in the following cautionary statements and elsewhere in this article and on this site. Although the Company may believe that its expectations are based on reasonable assumptions, the actual results that the Company may achieve may differ materially from any forward-looking statements, which reflect the opinions of the management of the Company only as of the date hereof. Additionally, please make sure to read these important disclosures.
Copyright David Chapman 2024
David Chapman is not a registered advisory service and is not an exempt market dealer (EMD) nor a licensed financial advisor. He does not and cannot give individualised market advice. David Chapman has worked in the financial industry for over 40 years including large financial corporations, banks, and investment dealers.
The information in this newsletter is intended only for informational and educational purposes. It should not be construed as an offer, a solicitation of an offer or sale of any security. Every effort is made to provide accurate and complete information. However, we cannot guarantee that there will be no errors. We make no claims, promises or guarantees about the accuracy, completeness, or adequacy of the contents of this commentary and expressly disclaim liability for errors and omissions in the contents of this commentary.
David Chapman will always use his best efforts to ensure the accuracy and timeliness of all information. The reader assumes all risk when trading in securities and David Chapman advises consulting a licensed professional financial advisor or portfolio manager such as Enriched Investing Incorporated before proceeding with any trade or idea presented in this newsletter. David Chapman may own shares in companies mentioned in this newsletter. Before making an investment, prospective investors should review each security’s offering documents which summarize the objectives, fees, expenses and associated risks.
David Chapman shares his ideas and opinions for informational and educational purposes only and expects the reader to perform due diligence before considering a position in any security. That includes consulting with your own licensed professional financial advisor such as Enriched Investing Incorporated. Performance is not guaranteed, values change frequently, and past performance may not be repeated.

-

 Biotech1 week ago
CIPM Expands Drug Funding and Indications
-

 Cannabis6 days ago
KONOPEX Expo 2026: Celebrating Europe’s New Era of Legal Cannabis
-

 Crowdfunding2 weeks ago
Terrenta Launches as Colombia’s First Regulated Real Estate Crowdfunding Platform
-

 Impact Investing3 days ago
Inter IKEA Launches Electric Truck Fleet to Decarbonize Heavy-Duty Logistics in Italy


