Markets
Trump, Tariffs, and Turbulence: What’s Next for the Economy?
The potential return of Donald Trump to the presidency has reignited discussions about the economic risks and opportunities, potential gains for the stock market and gold, and concerns about a falling U.S. dollar and rising debt. Despite current market volatility and seasonal weaknesses, gold stocks remain historically cheap, with a potential for outperformance in the face of uncertainties.
The attempted assassination on former president Donald Trump has renewed thoughts that he could reclaim the presidency in November. The events of the weekend with the resignation of president Joe Biden has added another twist to an already dramatic and divisive election.
But the focus here is on Trump as we note that this has brought forward numerous articles outlining the risks of another Trump presidency. Our focus is the economic risks both positive and negative. On the positive side it could bring further gains for both the stock market and gold with the latter to outperform. On the negative side it could bring a falling U.S. dollar and another upward explosion of debt. All occurred during the first Trump presidency. Our opening essay walks through these risks with an emphasis on the potential for another gold rush similar to 1977-1980 and 2008-2011.
Gold stocks continue to be cheap relative to the price of gold. This is one of the longest periods of time that gold stocks have remained so relatively cheap. This is unlike the period from 2003-2008 when it was the opposite. We cover this in our chart of the week (page 8) examining the gold/HUI ratio.
Some stock markets once again made new all-time highs this past week before reversing. Notably was the fall of the MAG 7 signalling that they may have topped. We are entering seasonal weakness for the stock market. Bond yields were marginally higher on fears of increased debt under a Trump presidency. In Canada, inflation was more subdued than thought and with the Bank of Canada (BofC) meeting on Wednesday there are expectations of another 25 bp rate cut.
Gold hit new all-time highs and reversed. Silver was smashed. But surprisingly the gold stocks outperformed suggesting that this pullback may only be temporary. Oil prices fell on fears of a glut and slower economic growth lowering demand. But here again the energy stocks outperformed suggesting this too may be temporary. Peyto Exploration & Development Corp., for example, reported increased production and earnings and higher funds from operations, pays a dividend, and is held in the Enriched Capital Conservative Growth Strategy.*
Last Tuesday brought a deluge and severe flooding in the City of Toronto. So called 100-year storms now appear to occur every 10 years instead. Bring out your waders and cheque book to pay for the damage. Otherwise, have a good week. The forecast this week is sunny.
“With enough inside information and a million dollars, you can go broke in a year.” — Warren Buffett, American businessman, investor, philanthropist, CEO Berkshire Hathaway, known as the Oracle of Omaha, currently ranked as the 10th richest person in the world; b. 1930
“Explosive growth of shadow banking was about the invisible hand having a party, a non-regulated drinking party, with rating agencies handing out fake IDs” — Paul McCulley, American economist, former managing director PIMCO, coined phrases Minsky Moment and Shadow Banking during 2007–2009 financial crisis, senior fellow Cornell Law School; b. 1957
“Nobody can be a great economist who is only an economist—and I am even tempted to add that the economist who is only an economist is likely to become a nuisance, if not a positive danger.” — Friedrich Hayek, Austrian-born British economist, philosopher, psychologist, historian, 1974 shared Nobel prize for economics, major contributor to Austrian School of Economics; 1899–1992
With the rising possibility that former president Donald Trump could win the November election, we have noted a number of articles pointing out the potential risks from his presidency. These range from domestic and geopolitical risks to economic risks. Our focus is on the economic risks and the potential impact on the stock market, the U.S. dollar, and gold. We also look at the performance of the stock market (S&P 500), gold, GDP and the U.S. dollar under all presidents from Richard Nixon onward. We start when President Nixon ended the Bretton Woods system in August 1971. With this action, the world was taken off the gold standard, so that gold was no longer tied to the U.S. dollar and was set free to trade on international markets. The world moved to floating-rate fiat currencies, backed by nothing except the promise to pay (I.O.U.). Lastly, we note how the federal debt grew under each president.
According to what we have been able to gather, the following are risks. One source, amongst others, has been The Economist Intelligence Unit (EIU) (www.eiu.com), which recently published an article titled “The Trump Risk Index.” Our primary focus is on the economic risks.
Domestic political risks:
- Call for retribution against political opponents
- Possible implementation, full or partial, of Project 2025 (www.project2025.org)
- Non-acceptance of 2024 election results
- Potential deportation of millions of migrants, including children of migrants born, educated, and working in the U.S. Increased deterrence at borders
Geopolitical risks:
- Upending of international military ties, including NATO
- Upending of international trade ties and global institutions
- Upending of international political ties
Economic risks:
- High tariffs and trade restrictions
- Tax cuts benefitting primarily corporations and the wealthy
- A weakened U.S. dollar
- Further sharp rise in the U.S. federal debt
- Increased emphasis on the oil and gas industry and ending of support for the green energy industry
Trump has suggested a blanket 10% tariff on all imports, plus tariffs of up to 60% on Chinese goods. He also has proposed higher tariffs for Mexico. A blanket tariff on all imports, plus the implementation of higher tariffs on China and Mexico, could in turn set off devastating trade wars and a serious dent in globalization that is already under pressure. According to the Economist Intelligence Unit, countries that could be the most negatively impacted besides China and Mexico could be Canada, Germany, Japan, and Taiwan. There are others.
It was the implementation of the Smoot-Hawley Tariff Act in 1930 that set off global trade wars in the 1930s and deepened the Great Depression. Could history repeat with the onset of trade wars?
The first Trump administration lowered the corporate tax rate to 21% from 35%. The proposal is to lower it further to 15%. There were other tax benefits for individuals and families, but the main beneficiaries of the tax benefits were large corporations and the 1%. All the current tax adjustments expire in 2025. As a result of the tax benefits and lowering of the corporate tax rate, it sparked a sharp rally in the U.S. stock market as the S&P 500 rose about 48% into February 2020 before the pandemic crash hit in March 2020. The federal debt also rose sharply, mainly due to tax cuts that were not offset. After the March 2020 pandemic crash, the financial system was flooded with liquidity (quantitative easing or QE) and extremely low interest rates. The stock market exploded again, finally topping in January 2022 before a 20%+ correction got underway.
Trump has stated his desire for a weaker U.S. dollar. During the first Trump administration the US$ Index fell roughly 9%. Trade wars could certainly hasten a decline in the U.S. dollar. The U.S. dollar remains the global reserve currency and the strongest in the world. While there are challenges to the supremacy of the U.S. dollar, particularly by the BRICS led by China, the odds of it being supplanted currently are low as there is no immediate replacement. It would require a new Bretton Woods system. The odds of that happening, given the current geopolitical situation, are about nil. However, the U.S. dollar could continue to come under pressure as global investors and central banks dump U.S. treasuries and other securities.
During the first Trump administration, the U.S. federal debt soared in dollar terms by $6.7 trillion or percentage-wise 33.1%. Percentage-wise, that was nowhere near the largest increase—that belongs to Franklin D. Roosevelt who had to deal with both the Great Depression and World War II. Dollar-wise, it is the
second largest increase, surpassed only by the Obama administration (2009–2017). The Obama administration had to deal with the 2008 financial crisis. However, the $7.8 trillion increase was spread over eight years (average/year $0.98 trillion) vs. Trump’s four years (average/year $1.7 trillion). The Trump administration, however, had to deal with the COVID-19 pandemic.
The expectation is that further tax cuts plus the potential for trade wars could once again sharply increase the U.S. debt. Our chart below shows debt growth by president from Richard Nixon onward. Percentage-wise, the largest increase came under Ronald Reagan who almost tripled the debt. Much lower was under Bill Clinton
where the debt increased by only about 30%. The debt then began to increase considerably under President George W. Bush before the financial crisis hit. That was followed by another sharp increase under President Barrack Obama who dealt with the fallout from the financial crisis. It exploded further under President Trump, thanks primarily to the tax cuts. Debt growth has since moderated under President Joe Biden but not disappeared. The U.S. currently has a budget balance/GDP of negative 6.3%, the highest of any G7 nation. Many have noted it is an unsustainable pace.
Debt Growth by President 1968–2024
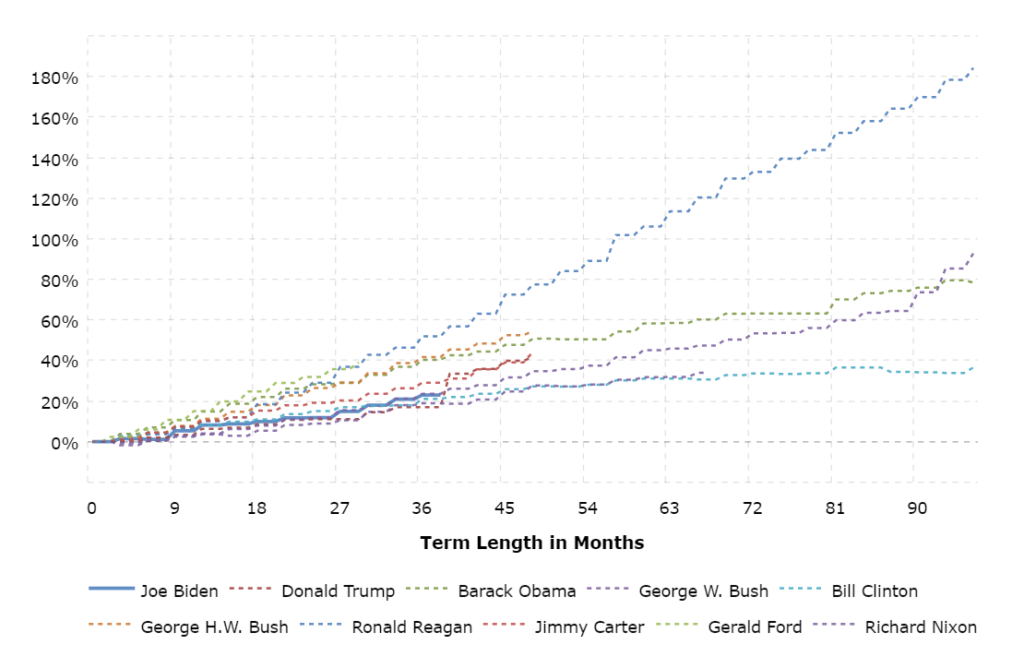
Source: www.macrotrends.net
There is the potential for winners and losers if another Trump administration comes to power. During the first Trump administration there was considerable favouritism and incentives to the oil and gas industry. This came at the expense of the green energy industry. Once again, the green energy industry could be under attack, including the elimination of the Environmental Protection Agency (EPA). There could be increased emphasis on coal. Ironically, given the number of battery plants in today’s red states, it could hurt those constituencies.
A primary beneficiary of a new Trump administration could be gold and, by extension, silver and gold stocks. We looked at the performance of the S&P 500, gold, the US$ Index, GDP and debt under various administrations since President Richard Nixon took the world off the gold standard in August 1971. What we learned is that stocks tend to perform better under Democrat administrations, gold is mixed (although performance under Republicans edges out performance under Democrats), the US$ Index performs better under Democrats, and debt grows faster under Republicans.
The reasons gold could perform well under a new Trump administration are as follows:
- Talk of further interest rate cuts, including at the September 17–18 meeting. Trump has talked about the desire for negative interest rates.
- The potential for violence surrounding the 2024 election. Trump has already indicated that if the Democrats win, the results will not be accepted. Could another January 6 erupt?
- Continued geopolitical risk that could deepen (Russia/Ukraine, Israel/Hamas/Hezbollah).
- The potential for trade wars under a Trump administration. During the 1930s, the trade wars that erupted after Smoot-Hawley saw gold, represented by Homestake Mining, triple while during the same period the DJI was falling 80%+. Gold was later revalued upward to $35 from $20.67 (69%) in 1934. The aim was to depreciate the U.S. dollar.
- Tax cuts that increase the debt, which would also be positive for gold. After the tax cuts were announced in December 2017, the stock market (SPX) soared 28% to a top in August 2020. At the same time, gold was up 60%. This included the March 2020 pandemic crash.
- Central banks, that have been selling U.S. securities while increasing their purchases of gold. Over the past year, foreign central banks have sold net $8 billion of U.S. treasuries to May 2024 (China $79 billion). This is against an increase of $2.9 trillion in U.S. debt during the same time period. The differential is picked up by intragovernmental departments and other public entities such as banks. Central banks have added some 362 metric tonnes ($26 billion with gold at $2,300) in the past year, primarily China and other Asian countries. Concern is over geopolitical risk, given U.S. sanctions and trade tariffs and a desire to move away from the U.S. dollar. Add in ongoing sabre-rattling between the U.S./China/Russia.
- The sharply-rising U.S. debt, which many maintain is unsustainable. Couple this with rising deficits and monetary growth. At the same time, bankruptcies in the private and consumer sectors are growing because of too much debt.
- A weakening U.S. dollar.
- Increase in demand for gold, particularly in Asia where India and China remain the largest buyers.
When we refer to gold we mean physical bullion only. Gold stocks, which have liability, are a leveraged play on the price of gold. Gold stocks remain cheap vs. gold as our chart of the week shows.
Gold tends to perform well during periods of economic uncertainty and political risk. Two gold rushes stand out. One is during the 1970s against the backdrop of stagflation, high interest rates, recessions, and geopolitical tensions with Russia over the invasion of Afghanistan. The other is the 2000s against a backdrop of stock market crashes in 2000–2002 (dot.com crash), 2007–2009 (financial crisis crash), recessions, and geopolitical tensions (9/11, U.S. invasions of Afghanistan and Iraq). Today we have high interest rates (relatively speaking), threats of stagflation, and a potential steep recession against the backdrop of both domestic and geopolitical tensions.
Performance by President for S&P 500 (SPX), Gold, US$, Debt, and Real GDP Growth (1971–2024)
| President | Term | S&P 500 % | Gold % | U.S. Dollar Index % | Real GDP Growth % | Debt $trillions %Gain |
| Richard Nixon (R)1 | Aug 1971–Aug 1974 | (25)%2 | 268%3 | (13)% | 9.7% | $0.12, +34.3% |
| Gerald Ford (R) | Aug 1974–Jan 1977 | 41% | (17)% | 3% | 6.6% | $0.08, +16.4% |
| Jimmy Carter (D) | Jan 1977–Jan 1981 | 27% | 287%4 | (7)% | 13.4% | $0.21, +29.9% |
| Ronald Reagan (R) | Jan 1981–Jan 1989 | 130%5 | (23)% | (4)% | 32.2% | $1.60, 160.8% |
| George H.W. Bush (R) | Jan 1989–Jan 1993 | 48% | (16)% | (4)% | 9.1% | $1.21, +42.3% |
| Bill Clinton (D) | Jan 1993–Jan 2001 | 211%6 | (19)% | 18% | 34.8% | $1.26, +28.6% |
| George W. Bush (R) | Jan 2001–Jan 2009 | (40)%7 | 246%8 | (22)% | 15.8% | $4.22, +72.6% |
| Barrack Obama (D) | Jan 2009–Jan 2017 | 176%9 | 30% | 16% | 17.1% | $7.77, +64.7% |
| Donald Trump (R) | Jan 2017–Jan 2021 | 63% | 53% | (9)% | 7.4% | $6.70, +33.1% |
| Joe Biden (D) | Jan 2021–present | 50% | 33% | 15% | 9.8%10 | $2.50, +8.8% |
Source: www.stockcharts.com, www.investopedia.com, www.wikipedia.com
Chart of the Week – Gold/HUI Ratio 2021–2024
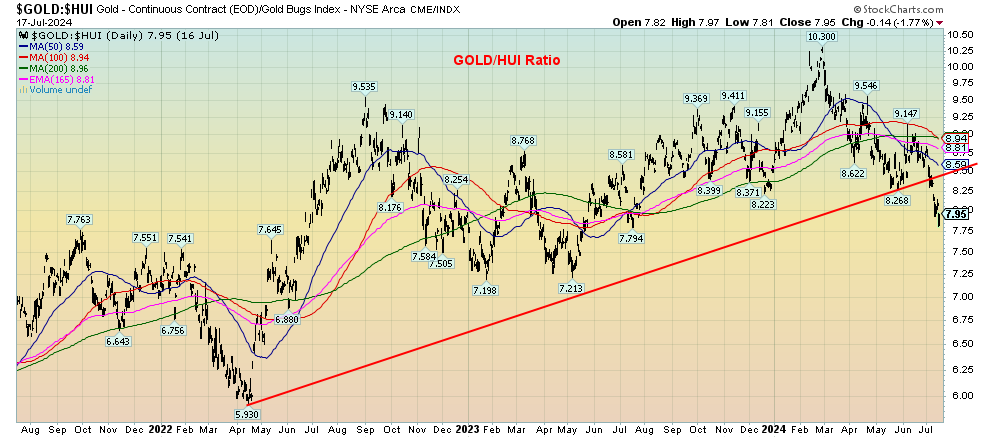
Source: www.stockcharts.com
The Gold/Hui ratio expresses the relationship between gold and the ARCA Gold Bugs Index (HUI). It is used mostly by professional investors to determine whether to own gold or own gold stocks. However, it is a useful yardstick for all. All this particular chart shows is that the ratio has broken an uptrend line dating from 2022. Following that low, gold outperformed the gold stocks for the next five months. After that we went sideways, with finally a spike up in favour of gold in early 2024. Since that February 2024 top, it has mostly favoured gold stocks over gold. And now it has broken the uptrend as the gold stocks start to outperform.
Or have they? When we look back over a longer period time we have a different story. While we may have broken that trendline signaling that going forward gold stocks should be favoured over gold, we note that the gold stocks remain exceptionally cheap compared to gold. We have to go all the way back to 2002–2008 to find gold stocks expensive and gold cheap. Yes, there was a brief period from 2008 to 2011 where the gold stocks did perk up relative to gold, but they never got as cheap relative to gold as they were during the 2002–2008 period. After the big collapse in gold prices in 2013, the gold stocks were hit even harder and sent the ratio soaring in favour of gold. The ratio then peaked in 2015 when gold bottomed at $1,045. But the HUI had fallen from a peak of 639 in 2011 to 101, a drop of 84%, while gold itself fell only about 46%.
Today, the HUI is still down almost 52% from the 2011 high while gold has been making all-time highs. The trendline break by the gold/HUI ratio this past week is encouraging, suggesting that we could be entering a period when the gold stocks outperform gold. This is long overdue. Clearly, we have work to do just to get to 6.5 support. Below 5.5 we finally get into a more neutral territory. But for the gold stocks to get really expensive, we have to get the ratio under 2.5. Hope springs eternal, but the reality it is still a long way off.
Nonetheless, the recent break is encouraging for the gold stocks. Given gold is making fresh all-time highs, we look for the day that the HUI gets back to 639. Discouraging as it is given 13 years have passed, we are reminded that it took the Dow Jones Industrials (DJI) 25 years to regain its 1929 high and 34 years for the Tokyo Nikkei Dow (TKN) to regain its 1990 high. And that’s just on a nominal basis. It took (or will take, in the case of the TKN) longer to reach its inflation-adjusted high. Gold stocks are now favoured over gold itself. But a reminder that gold stocks have liability, while gold doesn’t. And a reminder that gold stock liability can kick in anytime. Ask Victoria Gold whose heap leach pad broke, causing an environmental disaster. Victoria Gold is now down 97% from its 2021 all-time high. Now that’s liability.
Gold/HUI Ratio 1996–2024
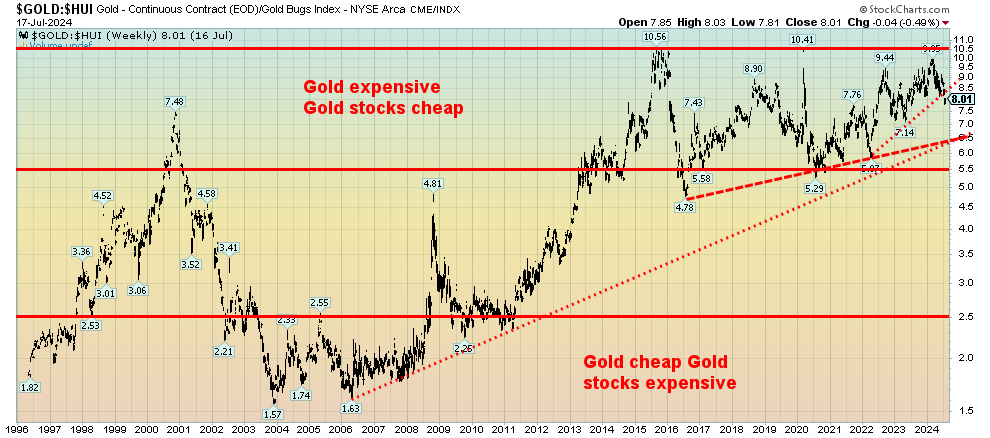
Source: www.stockcharts.com
A safer way is to purchase instead the Van Eck Gold Miners ETF (GDX) or the Van Eck Junior Gold Miners (GDXJ). The pattern for the gold/GDX ratio or the gold/GDXJ ratio is similar to the gold/HUI ratio. And it spreads the risk around rather than concentrating it in one stock like Victoria Gold.
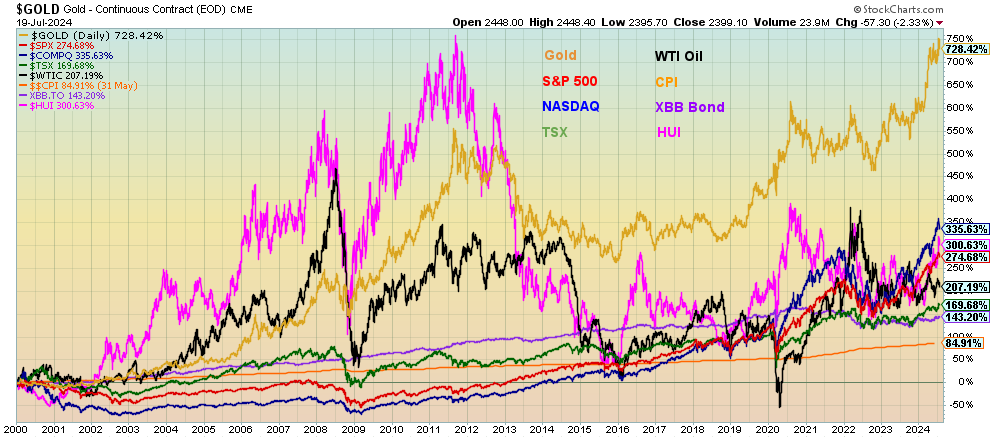
Since 2000 gold has been the best performing asset. However, it has had periods of an explosive rise followed by periods of severe corrections. Since 2000 gold is up 726%. The next best has been the NASDAQ up 336%. Surprisingly gold stocks represented by the Gold Bugs Index (HUI) has been the next best performer up 301%.
However, like gold it has periods of sharp rises followed by periods of sharp collapses. We compared them as well with the S&P 500, up 275%, the TSX up 170%, WTI Oil up 207%, bonds represented by the iShares Canadian Bond Index ETF (XBB/TSX) up 143% before coupon, and the CPI up 85%. Surprisingly, or maybe not so, gold and gold stocks remain under owned in most portfolios when compared to others. Most pundits readily talk about the Magnificent 7 but rarely about gold and gold stocks. Yet their performance since 2000 is amongst the best as it once again is showing signs of rising against the current backdrop.
Source: www.stockcharts.com
Markets & Trends
| % Gains (Losses) Trends | ||||||||
| CloseDec 31/23 | CloseJul 19, 2024 | Week | YTD | Daily (Short Term) | Weekly (Intermediate) | Monthly (Long Term) | ||
| Stock Market Indices | ||||||||
| S&P 500 | 4,769.83 | 5,505.00 (new highs)* | (2.0)% | 15.4% | up | up | up | |
| Dow Jones Industrials | 37,689.54 | 40,287.53 (new highs)* | 0.7% | 6.9% | up | up | up | |
| Dow Jones Transport | 15,898.85 | 15,783.45 | 1.7% | (0.7)% | up | up | up | |
| NASDAQ | 15,011.35 | 17,726.94 | (3.7)% | 18.1% | up | up | up | |
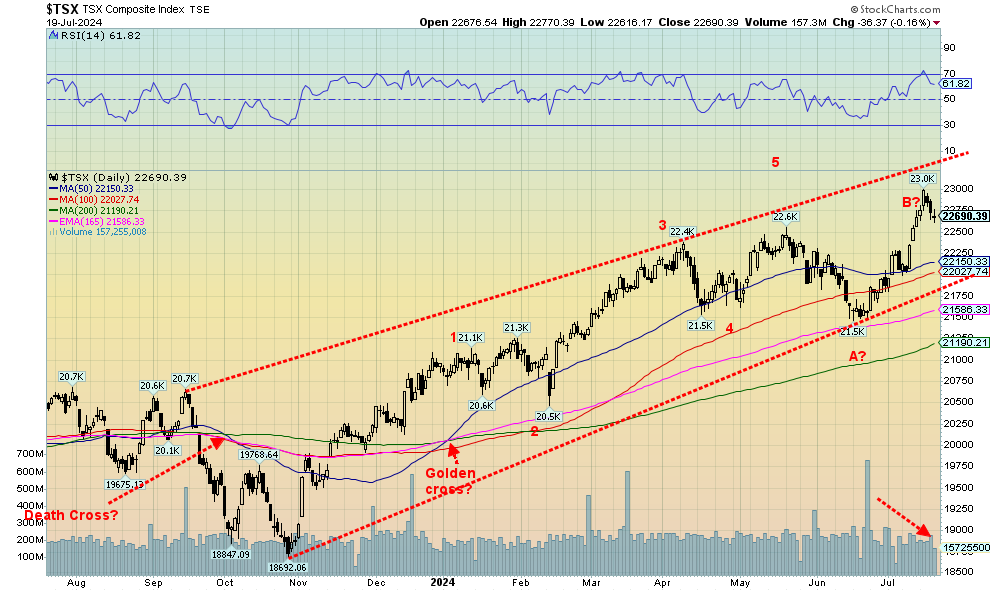
| S&P/TSX Composite | 20,958.54 | 22,690.39(new highs)* | 0.1% | 8.3% | up | up | up | |
| S&P/TSX Venture (CDNX) | 552.90 | 580.09 | (0.6)% | 6.7% | up (weak) | up | up (weak) | |
| S&P 600 (small) | 1,318.26 | 1,380.44 (new highs)* | 2.2% | 4.7% | up | up | up | |
| MSCI World | 2,260.96 | 2,399.28 | (0.7)% | 6.1% | up | up | up | |
| Bitcoin | 41,987.29 | 66,994.97 | 16.4% | 59.6% | up | neutral | up | |
| Gold Mining Stock Indices | ||||||||
| (1.5)% | 243.31 | 296.55 (new highs) | (1.5)% | 21.9% | up | up | up | |
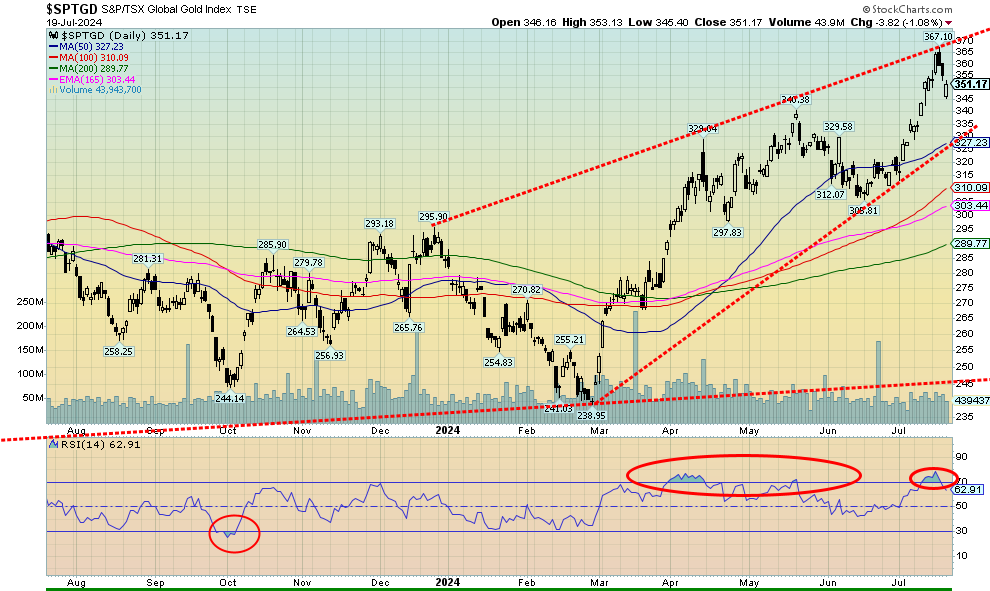
| TSX Gold Index (TGD) | 284.56 | 351.17 (new highs) | (0.8)% | 23.4% | up | up | up | |
| % | ||||||||
| U.S. 10-Year Treasury Bond yield | 3.87% | 4.25% | 1.4% | 9.8% | ||||
| Cdn. 10-Year Bond CGB yield | 3.11% | 3.42% | (0.6)% | 10.0% | ||||
| Recession Watch Spreads | ||||||||
| U.S. 2-year 10-year Treasury spread | (0.38)% | (0.27)% | 15.6% | 29.0% | ||||
| Cdn 2-year 10-year CGB spread | (0.78)% | (0.34)% | 22.7% | 56.4% | ||||
| Currencies | ||||||||
| US$ Index | 101.03 | 104.37 | 0.3% | 3.3% | down | neutral | up (weak) | |
| Canadian $ | 75.60 | 72.94 | (0.8)% | (3.5)% | down | down | down | |
| Euro | 110.36 | 108.83 | (0.2)% | (1.4)% | up | up | neutral | |
| Swiss Franc | 118.84 | 112.51 | 0.8% | (5.3)% | up | neutral | up | |
| British Pound | 127.31 | 129.10 | (0.6)% | 1.4% | up | up | neutral | |
| Japanese Yen | 70.91 | 63.50 | 0.2% | (10.5)% | up (weak) | down | down | |
| Precious Metals | ||||||||
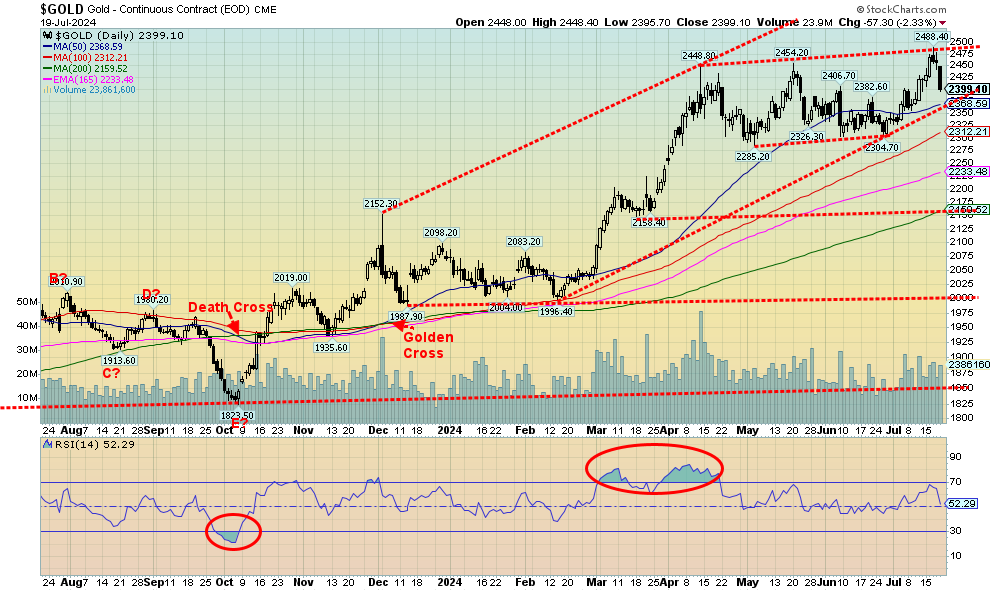
| Gold | 2,071.80 | 2,399.10 (new highs)* | (0.9)% | 15.8% | up | up | up | |
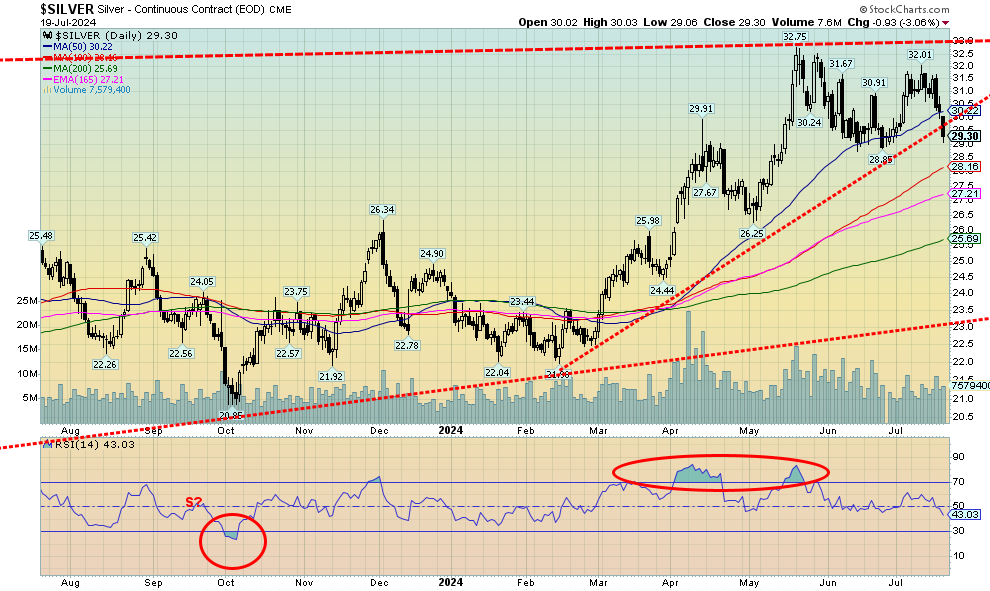
| Silver | 24.09 | 29.30 | (6.0)% | 21.6% | down | up | up | |
| Platinum | 1,023.20 | 973.90 | (3.9)% | (4.8)% | down | up | up (weak) | |
| Base Metals | ||||||||
| Palladium | 1,140.20 | 902.30 | (7.2)% | (20.9)% | down | down | down | |
| Copper | 3.89 | 4.24 | (7.6)% | 9.0% | down | up (weak) | up | |
| Energy | ||||||||
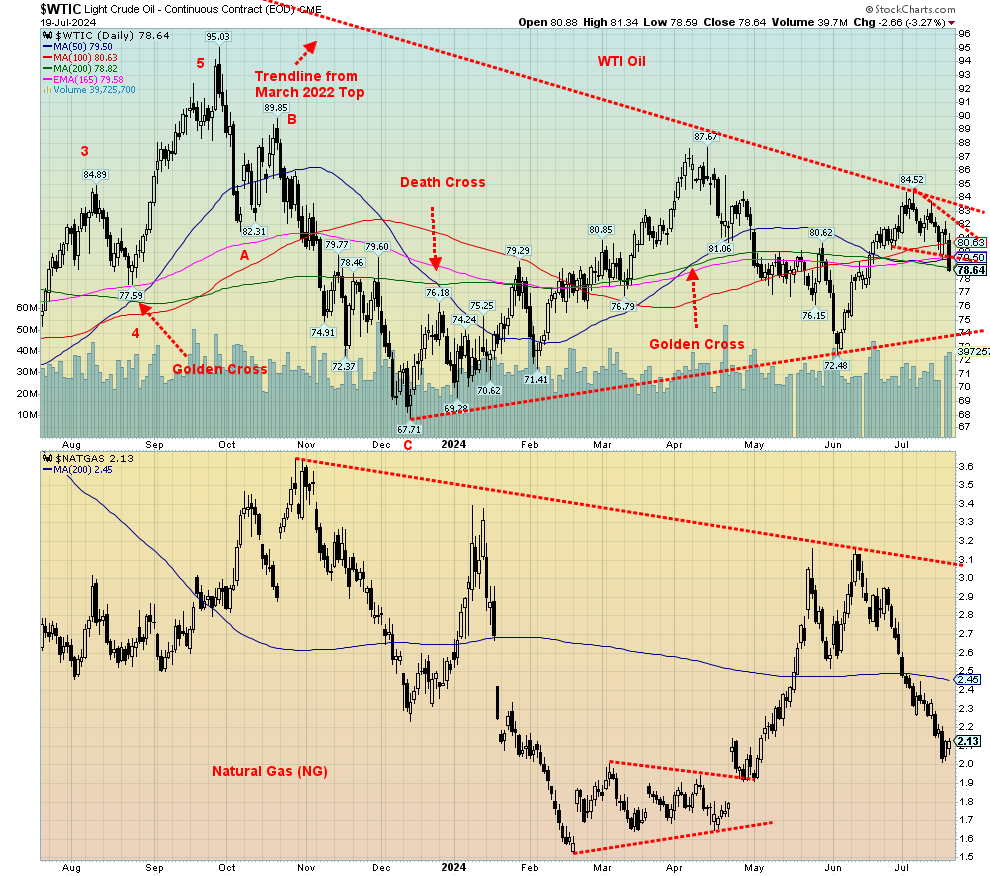
| WTI Oil | 71.70 | 78.64 | (4.3)% | 9.6% | neutral | up (weak) | neutral | |
| Nat Gas | 2.56 | 2.13 | (8.6)% | (16.8)% | down | down (weak) | down | |
Source: www.stockcharts.com
New highs/lows refer to new 52-week highs/lows and, in some cases, all-time highs.
- * New All-Time Highs
Source: www.stockcharts.com
Is the party really over this time? It was an odd week as the S&P 500 (SPX) and the Dow Jones Industrials (DJI) once again hit all-time highs, then reversed. The SPX closed lower on the week while the DJI held a gain. The NASDAQ failed to join the party this time and fell sharply, thanks to the bloom coming off the Mag 7. As we note next, they were all down on the week.
On the week, the SPX fell about 2.0%, but the DJI gained 0.7%. The Dow Jones Transportations (DJT) also rose, up 1.7%, but remains short of its all-time high, an ongoing divergence with the DJI. The NASDAQ fell 3.7%. The NASDAQ was led down by the Mag 7 and the FAANGs as the NY FANG Index fell 4.6%. But is the market broadening? The S&P 400 (Mid) fell 0.2% but the S&P 600 (Small) rose 2.2%. We cover the S&P 600 below. The S&P 500 Equal Weight Index fell 0.1% as it too made new all-time highs.
In Canada, the TSX Composite rose a small 0.1% while the TSX Venture Exchange (CDNX) fell 0.6%. In the EU, the London FTSE fell 1.2%, the EuroNext 100 was off 3.3%, and the Paris CAC 40 fell 2.6%, while the German DAX fell 3.1%. In Asia, China’s Shanghai Index (SSEC) was up a small 0.4, the Tokyo Nikkei Dow (TKN) fell 2.7%, and Hong Kong’s Hang Seng (HSI) fell 4.4%. The MSCI World Index made new all-time highs and finished down 0.7%. Bitcoin rose on expectations that a Trump presidency will be good for crypto. Bitcoin was up 16.4% but remains short of its all-time highs.
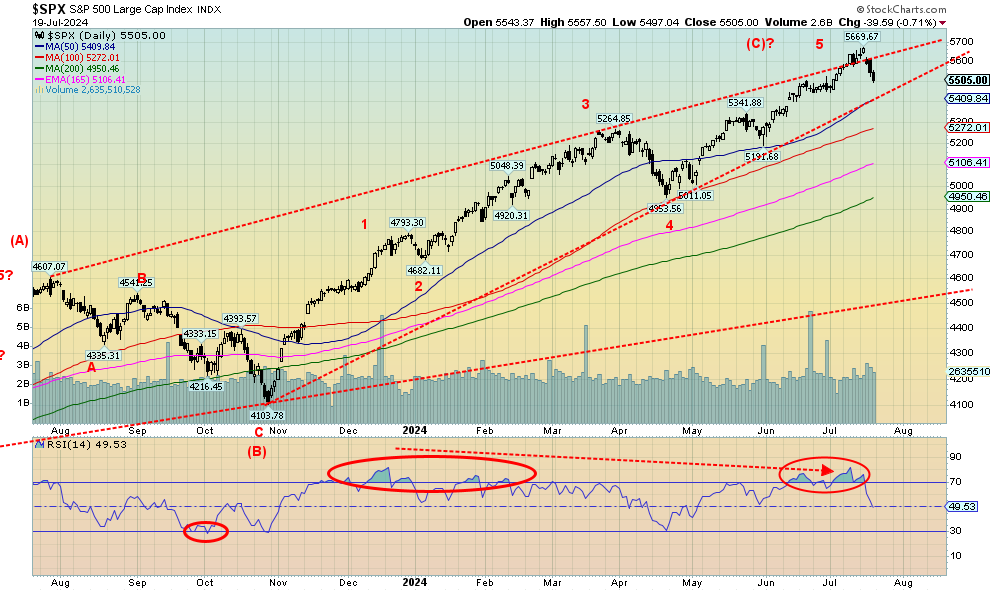
None of the indices gave us a clear sell signal. The dailies are rolling over and, for the SPX, a break below 5,400 would confirm that at least a temporary top is in. A break under 5,400 could also puncture what appears to be an ascending wedge triangle (bearish). If that is correct, then the SPX could eventually fall all the way back to the October 2023 low near 4,100. Support along the way is seen at 5,250, 5,100, and 4,950 and the 200-day MA. But below 4,900 we believe we’d get our best sell signal and a bear market could follow. Of course, new highs would change this scenario.
We continued to show the SPX on what appears as an overthrow. And now we have fallen right back into the channel, usually a negative sign. We are also coming down from steep overbought levels and the RSI is now a more reasonable 50; i.e. neutral. All the recent signs have been negative and we suspect we have seen our high for 2024. We are now headed into the heart of the election season with an extremely contentious election. We are also headed seasonally the weakest period for the stock market. We are seeing signs of more and more companies and individuals in financial trouble with banks rapidly increasing their reserves for loan losses. That in turn could lead to a credit crunch and one more step towards a potential recession. If one hasn’t already done so, they should batten down the hatches. Things are about to get stormy.
Source: www.stockcharts.com
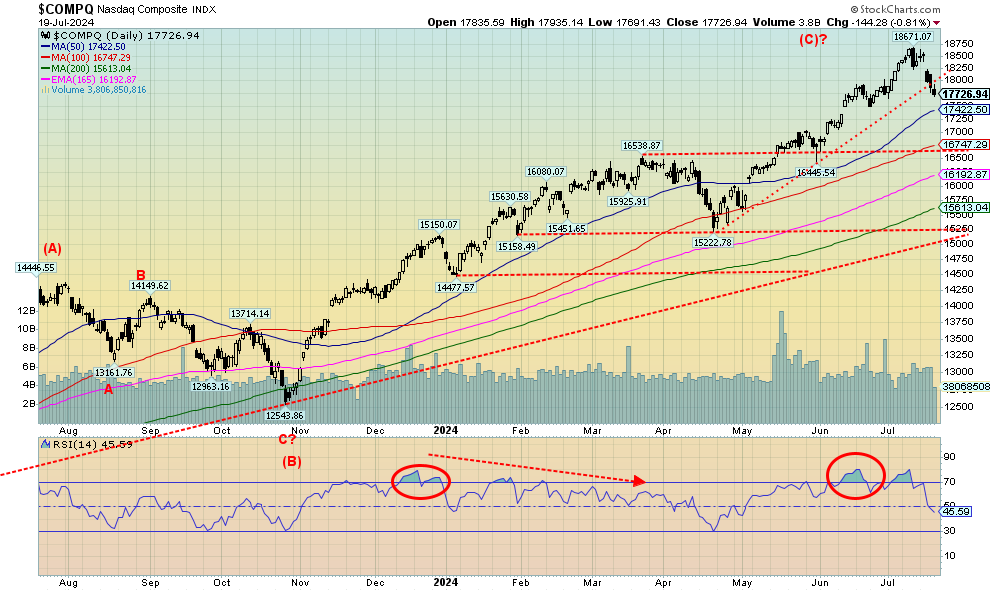
The Magnificent Seven stumbled, with the result being a poor week for the NASDAQ. The NASDAQ fell 3.7% this past week. The NY FANG Index was down 4.6%. The Mag 7 stumbled. Meta was down 4.4%, Apple down 2.7%, Amazon off 5.8%, Netflix down 2.2%, Google off 4.0%, Microsoft down 3.6%, and Tesla down 3.6%. The really big loser on the week was Advanced Micro (AMD), down 16.5%. Is the party really over? The NASDAQ did break that steep uptrend from the April low. Next support is down at the 50-day MA near 17,420. Next support would be 16,740. A break of 16,450 would tell us we have a confirmed top. The RSI has gone from quite overbought to 46. We suspect more losses could be coming as early as this week. New highs above 18,670 would be quite positive. We look overextended and the correction is well overdue. But does it turn into a route?
Source: www.stockcharts.com
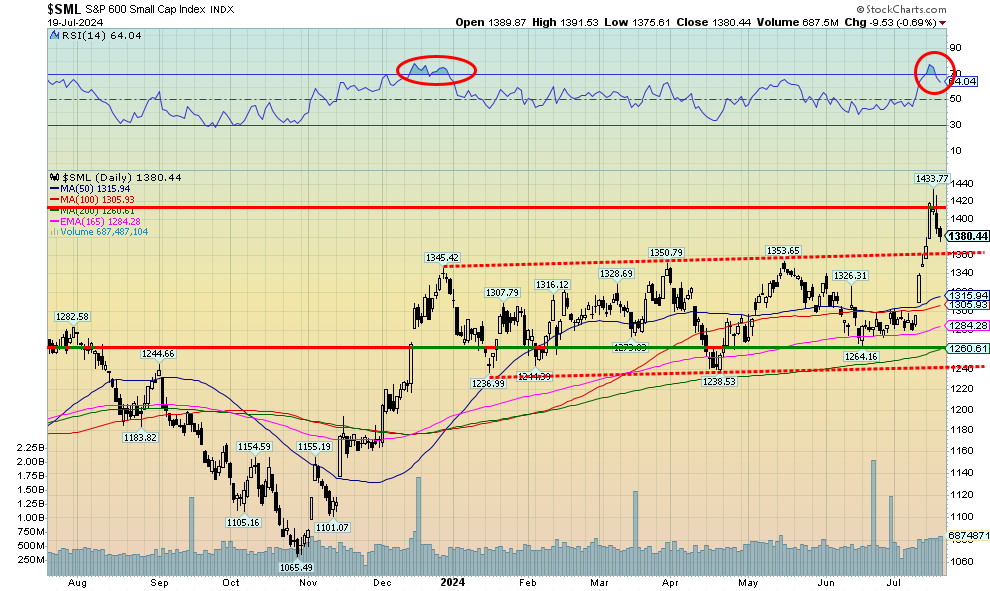
The S&P 600 (Small) broke out to new 52-week highs this past week. No, not new all-time highs. That was set back in 2021. The line that this week’s action was poking its ahead above was the resistance line from the highs of 2020–2021. On the other hand, the S&P 600 broke out of what appears to be a sideways pattern that should project up to around 1,475. The high this week was about 1,434. Is that close enough? We did reverse and close up 2.2% on the week, outperforming the S&P 500 (Large) and S&P 400 (Mid). The Russell 2000 Small Cap Index also showed a similar pattern, breaking out of the sideways pattern and making 52-week highs. But the Russell 2000 also fell short of its 2021 high. The performance of the small caps has market pundits chirping that the small caps are breaking out and if they lead the way then the market is going higher as breadth widens. Naturally, given what is going on elsewhere it could be a false move. A breakdown back under 1,350 would be some sign of trouble. Under 1,300 suggests we are going lower to test support near 1,260. A final breakdown comes under 1,240.
Source: www.stockcharts.com
Once again, the TSX Composite made new all-time highs before reversing and closing up only 0.1% on the week. That’s better than how the TSX Venture Exchange (CDNX) fared as it fell 0.6%. A number of sub-indices also made new all-time highs. On the week, there were seven up and seven down. Leading the way up was Telecommunications (TTS), gaining 2.7%. Next best was Real Estate (TRE) +2.5%. TCS also made new all-time highs. Joining the new all-time highs parade besides TCS was Consumer Discretionary (TCD) -0.4%, Financials (TFS) +0.6%. Golds (TGD) made 52-week highs, falling 0.8%. The biggest loser was Metals & Mining (TGM), down 4.7%. Materials (TMT) made 52-week highs but fell 2.0%. The TSX’s new all-time high followed by a reversal was not overly positive. What’s key now is that if we pull back, we hold above 22,150 support. A break under 22,000 would be negative and we could expect further declines. The high this past week was near that upper channel so it is acting as resistance.
U.S. 10-year Treasury Note, Canada 10-year bond CGB
Source: www.tradingeconomics.com, www.home.treasury.gov, www.bankofcanada.ca
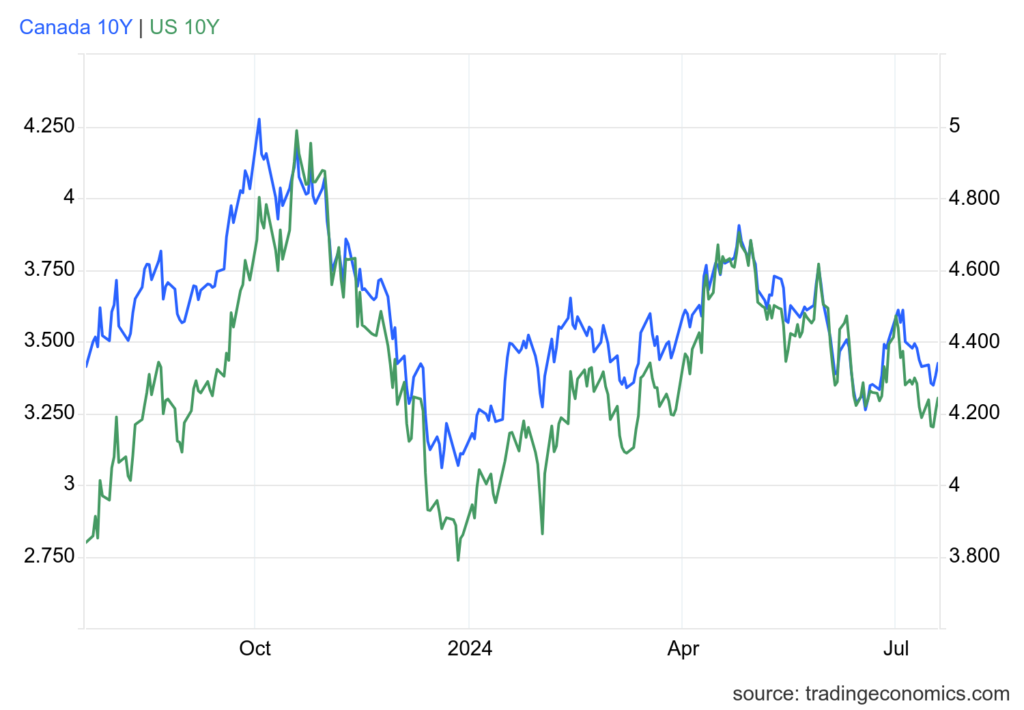
Bond yields ticked marginally higher this past week. The U.S. 10-year treasury note rose to 4.25% from 4.19%. In Canada, they were marginally lower as the 10-year Government of Canada bond (CGB) fell to 3.42% from 3.44%. The 2–10 spreads narrowed further with the U.S. down to negative 27bp, unchanged on the week, and the Canadian 2–10 fell to negative 34bp from negative 44bp. The narrowing of the yield curve suggests we are getting closer to a recession. In both countries and particularly Canada the housing market is unravelling as delinquencies grow, defaults grow, and more product comes on the market. Worse, the product is just sitting there as sellers are reluctant to lower their prices, where they could incur substantial loss. This occurs particularly if one bought during 2020–2022 when the housing market was in a frenzy. Commercial real estate is also falling, as many new condos are defaulting or not finishing as sales have lagged badly. Banks continue to increase their loan loss reserves, which in turn could spark banks to restrict credit, leading to a credit crunch. That would add to the woes of the market. Add in the uncertainty of a Trump presidency and you have a perfect storm in the making, with defaults rising, bankruptcies rising, and political uncertainty. Meanwhile, longer interest rates could remain high as inflation is sticky and the debt keeps on growing. Stagflation?
There weren’t a lot of numbers to drive the market this past week. U.S. retail sales were up 2.3% year over year (y-o-y), above expectations of a gain of 2.1% but Canadian retail sales were up only 1%, below the expected 1.9%. Nonetheless, retail sales are slowing in both countries. We noted initial jobless claims jumped to 243,000 above the expected 225,000 and last week’s 223,000. This coming week we get existing home sales, PCE prices, Q2 advance GDP, and the final Michigan Consumer Sentiment for July. In Canada, we have the BofC interest rate decision on Wednesday. Expectations are the BofC will cut to 4.5%.
Source: www.tradingeconomics.com, www.statcan.gc.ca
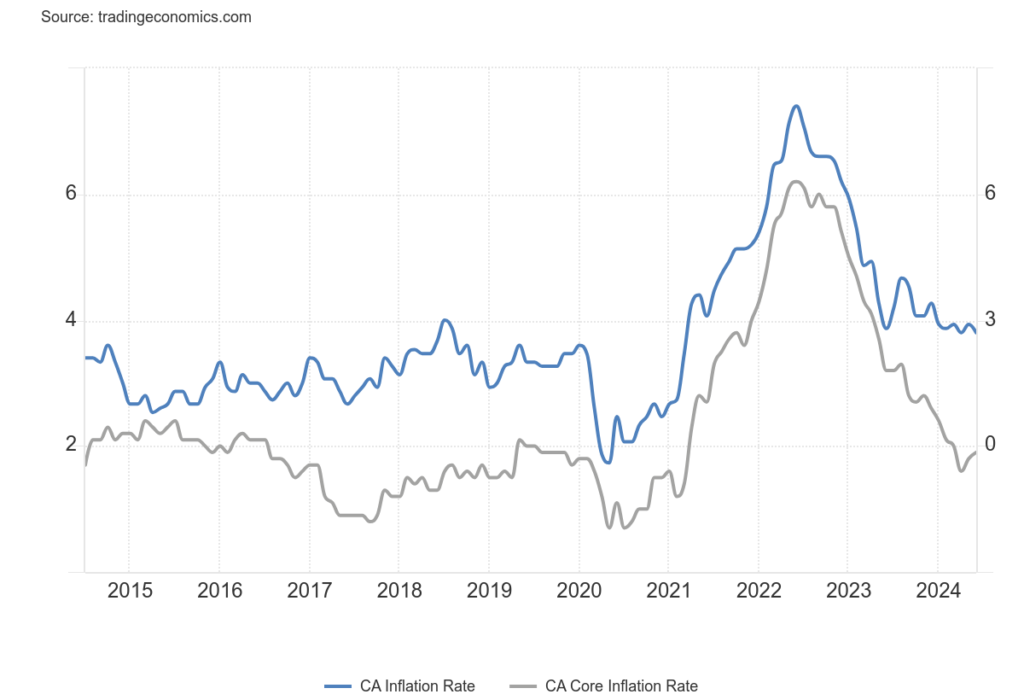
Canadian inflation is subsiding. In June, the y-o-y inflation was 2.7% when the market was expecting 2.9%. What was even more positive, it fits with the BofC’s description that Canadian inflation should hover near 3% but remain below. The lower inflation numbers strengthened expectations that the BofC might cut rates again at their upcoming meeting on July 24. Another cut would be more impactful than the first cut. Inflation fell for energy and gasoline but rose for food. Food is impacted by its supply chains and the weather where droughts are common or fierce storms destroy crops. The core inflation rate rose to 1.9% up from 1.8% in May. It was the third consecutive monthly rise. It seemed to belie the improvement in the inflation rate and expectations of a BofC rate cut this coming week.
Source: www.stockcharts.com
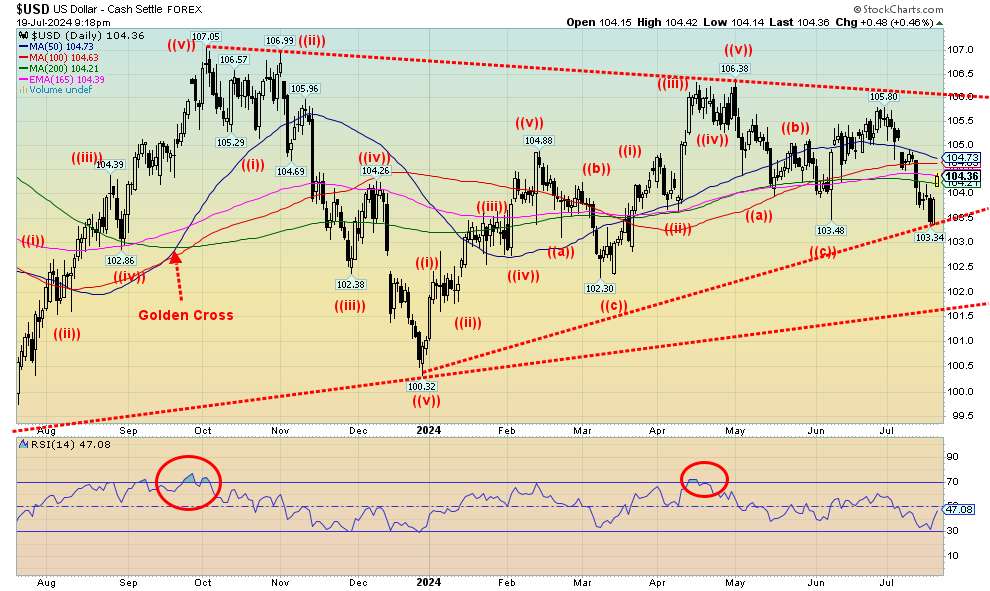
The US$ Index threatened to break down, then suddenly reversed and shot back up on Friday. The US$ Index fell to around 103.35 and then rebounded, closing the week at 104.36, up a solid point from the low of the week. We suspect all it’s doing is signaling another temporary bottom and a correction upward. Resistance is seen at 104.75, 105, and up to 106. Above 106 we do break out; however, the odds of that happening are low to nil. With threats of another Trump presidency, that favours a weaker dollar, not a stronger one. The US$ Index performed poorly under Trump but gold performed well.
On the week, the US$ Index managed to gain 0.3%. The euro fell 0.2%, the Swiss franc was up 0.8% (still a safe haven), and the pound sterling fell 0.6%, while the Japanese yen gained a small 0.2%. The Cdn$ took it on the chin, falling almost 0.8%. The good news for the Cdn$ is that it is trading down around levels we’ve seen on three other occasions over the past year. Things don’t look good for the Cdn$, but we appear to be making a large bottom pattern. A break back over 74.00 would be positive, suggesting a low. But a break over 76.00 would be a major breakout from the bottom pattern and projects up to near 81. That makes us positive on the Cdn$. The caveat is a breakdown under 72. As for the US$ Index, once we break 103, a more major bear market could follow.
Source: www.stockcharts.com
It was not a very good week for gold. However, the other precious metals fared even worse. Gold fell 0.9% after once again making new all-time highs to $2,488. But that was the good news. Silver fell 6.0% and platinum was down 3.9%, while the near precious metals saw palladium drop 7.2% and copper get killed, down 7.6%. But, surprisingly, the gold stocks held in (a positive sign) as the ARCA Gold Bugs Index (HUI) fell 1.5% while the TSX Gold Index (TGD) dropped 0.8%. The drop for the precious metals was not friendly, but the fact the gold stocks generally held in is encouraging, suggesting that this may be nothing more than a needed correction to end overbought levels. Gold never really was overbought as the RSI hovered near 70. Now it is a neutral 52.
The news was not all bad. We learned hedge funds are making larger wagers that gold prices could rise. Given what they see as political and economic uncertainty, they have their highest holdings in gold in four years. Many are expecting a September Fed cut. The Hedgies cited both domestic and geopolitical risk as a reason to hold gold. On the geopolitical side, they cited sanctions and the conflicts with both China and Russia, two very large gold producers. China is the world’s largest producer but Australia has the largest reserves. However, both China’s central bank and Russia’s central bank have been steady buyers of gold to shore up their currency while dumping U.S. treasury securities. Russia has none now and China’s keeps falling. They, along with the BRICS, are challenging the U.S. dollar as the world’s reserve currency and U.S. dollar global hegemony.
What’s concerning is that gold made new all-time highs, then reversed and closed lower on the week. But it appears to us as a normal reversal week and not a key one. For that we’d have to have taken out the previous week’s low and close under that level. We have decent support down to $2,350, then to $2,300 levels which we can’t rule out. We wouldn’t want to see a breakdown under $2,300 as that could imply even lower prices with potential targets down to $2,150. The 200-day MA is currently around $2,160. We doubt that would happen, but it’s something to keep in mind. New highs would set us on the upward track once again and potential targets are now up to $2,600. After making that high in April at $2,488, gold has been correcting. It’s possible it is a five-wave structure as in ABCDE. If so, then this should be the E wave. Since the D wave made new highs again, it suggests the E wave could be short and we hold $2,300. Hence, that’s why we don’t want to see a breakdown under $2,300.
The commercial COT is an uninspiring 22%, but when we add options traders, it jumps to 29%. It seems the options traders are more positive than futures dealers. We remain long-term bullish on gold but await completion of the current correction.
Source: www.stockcharts.com
Silver had a bad week. It plunged, down almost 6% and dropping below $30 once again. That’s the bad news. The good news is it held for the moment above $29. We had noted that while gold was going up, making new all-time highs, silver wasn’t even making new 52-week highs. Yes, gold sold off this past week but silver sold off more. That’s odd when there are silver shortages. Silver tends to lead in both up and down markets. Is silver signaling that we are about to have a steeper drop?
That’s hard to say when the signals are mixed. As noted next, the gold stocks held in well this past week despite the big drop in silver. A check of silver stocks showed that while down they weren’t killed. Pan American Silver (PAAS/TSX), a large silver mining company, fell 4.3%, less than what silver itself fell. We prefer to view that positively. However, we do need to heed silver’s performance this past week. It broke an uptrend. It’s near $29 and below $29 good support comes in at $28.50. But if we broke under $28, then we could fall all the way back to $26 and test under that level. Note the 200-day MA is currently at $25.69. Could it be a target. Very long-term support is down at $23, a level we are not expecting to see on this pullback. A potential swing-down target, however, could be seen. That’s based on the recent high and low, and a break under the recent low of $28.89 could suggest a fall to $25.77. And that is roughly where the 200-day MA is. New highs above $32 would reset us higher. But we now need to break over $33 to suggest we are on our way to targets up around $39/$40. The silver commercial COT remains a concern at 22%. Add in options and the commercial COT is 27%. Not high.
Source: www.stockcharts.com
A bad week for gold and silver means a bad week for the gold stocks. Okay, they were down, but they didn’t get killed. Indeed, Friday started out quite weak for the gold stock indices, given the $40+ drop in gold prices, but by the end of the day they had recouped. On the week, the TSX Gold Index (TGD) fell 0.8% while the Gold Bugs Index (HUI) dropped 1.5%. The overbought conditions that were prevalent have eased and the RSI for the TGD is down at 63 from highs over 70. To us, this pullback appears normal and the fact that the gold stocks were not hit too hard on Friday suggests to us strength. If that’s correct, we should regroup and move to higher highs. Indeed, the TGD and the HUI made 52-week highs this past week, the second week in a row. But, of course, after making new highs they reversed and closed lower. However, so far it appears as a normal reversal and did not give us any sell signals. We have good support down to 330 for the TGD, with interim support near 340. A breakdown under 330 would be of bigger concern and could suggest a fall to 290/300. We may have a pattern that appears as an ascending wedge; however, there also appears to be sufficient room to rise further into the wedge. Expect some further consolidation but heed the warning on a break under 330. We prefer to hold that level.
Source: www.stockcharts.com
It seems that the energy sector (oil and gas) had a sudden case of very cold feet. Yes, the hurricane did little or no damage to wells in the Gulf of Mexico. Yes, there is sudden concern about slowing in the Chinese economy that could lower demand. And yes, there is even concern in the U.S. that a recession could sap demand. Then we found out there was a 5-million-barrel drop in U.S. crude stocks as if it had suddenly flooded the market (but will need to be built back up later). The futures curve has even gone into backwardation, meaning the
front month future is higher than futures prices further out. The expectation appears to be that prices will be lower going forward.
On the week, WTI oil fell 4.3%, unexpectedly falling under $80 support and closing at $78.64. Brent crude was down as well 2.8%. Natural gas (NG) wasn’t spared as NG at the Henry Hub fell 8.6% but EU NG at the Dutch Hub rose a small 0.4%. While the EU has ample in storage, they are worried about going forward as they are competing with Asia for supplies. And. of course, they are not taking Russian NG, the world’s second largest producer of NG and holder of the world’s largest reserves. Yes, the EU storage may be 74% full, the highest it’s ever been, but they remain concerned about going forward. The U.S. has increased demand because of the extremely hot weather, but that meant they ramped up production beyond what may have been needed. Prices fell.
Despite all the gyrations with oil and gas, the energy stocks were decidedly mixed and held in. The ARCA Oil & Gas Index (XOI) rose 0.8% while the TSX Energy Index (TEN) fell 0.6%. Considering what was going on with oil and gas, that’s decent performance and suggests to us that this drop could be temporary.
NG has fallen quite a bit from that high up around $3.20. It is now down 34%. NG needs to regain above $2.50 to suggest the upward trend has returned. WTI oil fell under $80 but has hit support near $78.50. A breakdown under $78 and especially under $77 would be of bigger concern, as that could suggest a retest of lows near $72. Above that, WTI needs to regain first $80 and a firm breakout does not occur until over $84. Despite everything else, geopolitical risk remains.
__
(Featured image by Gage Skidmore (CC BY-SA 2.0) via Wikimedia Commons)
DISCLAIMER: This article was written by a third party contributor and does not reflect the opinion of Born2Invest, its management, staff or its associates. Please review our disclaimer for more information.
__
David Chapman is not a registered advisory service and is not an exempt market dealer (EMD) nor a licensed financial advisor. He does not and cannot give individualised market advice. David Chapman has worked in the financial industry for over 40 years including large financial corporations, banks, and investment dealers. The information in this newsletter is intended only for informational and educational purposes. It should not be construed as an offer, a solicitation of an offer or sale of any security. Every effort is made to provide accurate and complete information. However, we cannot guarantee that there will be no errors. We make no claims, promises or guarantees about the accuracy, completeness, or adequacy of the contents of this commentary and expressly disclaim liability for errors and omissions in the contents of this commentary. David Chapman will always use his best efforts to ensure the accuracy and timeliness of all information. The reader assumes all risk when trading in securities and David Chapman advises consulting a licensed professional financial advisor or portfolio manager such as Enriched Investing Incorporated before proceeding with any trade or idea presented in this newsletter. David Chapman may own shares in companies mentioned in this newsletter. Before making an investment, prospective investors should review each security’s offering documents which summarize the objectives, fees, expenses and associated risks. David Chapman shares his ideas and opinions for informational and educational purposes only and expects the reader to perform due diligence before considering a position in any security. That includes consulting with your own licensed professional financial advisor such as Enriched Investing Incorporated. Performance is not guaranteed, values change frequently, and past performance may not be repeated.
__
This article may include forward-looking statements. These forward-looking statements generally are identified by the words “believe,” “project,” “estimate,” “become,” “plan,” “will,” and similar expressions, including with regards to potential earnings in the Empire Flippers affiliate program. These forward-looking statements involve known and unknown risks as well as uncertainties, including those discussed in the following cautionary statements and elsewhere in this article and on this site. Although the Company may believe that its expectations are based on reasonable assumptions, the actual results that the Company may achieve may differ materially from any forward-looking statements, which reflect the opinions of the management of the Company only as of the date hereof. Additionally, please make sure to read these important disclosures.


The TopRanked.io Weekly Digest: What’s Hot in Affiliate Marketing [NiftyPM Affiliate Program Review]
As any marketer (affiliate or not) can tell you, the old "it's AI-powered" line has been a real champ when...


Fes-Meknes Drives Investment Growth with Diversified Sectors and Industrial Expansion
In 2025, Morocco’s Fes-Meknes region approved 444 projects worth 17.85 billion dirhams, creating over 18,500 jobs. Investment focused on energy,...


Peru’s Crowdfunding Sector Shrinks Amid License Revocation
Peru’s securities regulator revoked Inversiones Neurona SAC’s crowdfunding license at the company’s request, following compliance checks. Previously suspended for failing...


EU Biotechnology Law Aims to Boost Innovation and Cut Trial Delays
EU Commissioner Olivér Várhelyi proposed a Biotechnology Law to boost competitiveness, cut clinical trial times, and reduce fragmentation. Measures include...


BlackRock’s $94M Crypto Move Signals Rising Institutional Momentum
BlackRock transferred nearly $94 million in Bitcoin and Ethereum to Coinbase, signaling possible trades and rising institutional interest. Ethereum surged...
 |
|
 |  |
 |
|
-

 Markets7 days ago
Oil Surge Sparks Market Turmoil and Shadow Banking Fears
-

 Business2 weeks ago
Echoes of 1929: Inflated Valuations and Warning Signs in Today’s Dow
-

 Fintech4 days ago
PayPay Targets Global Expansion After Landmark IPO
-

 Cannabis2 weeks ago
New Global Survey Shows Growing Cannabis Acceptance in Poland