Markets
Trump Tariffs, Jobs Data: Tumbling Markets, and a Crisis of Confidence
Markets have cracked under the weight of weak jobs data and aggressive new tariffs. This has triggered a sharp global reversal, signaling a potential top as rising stagflation risks and faltering economic momentum lurk beneath flashy headline GDP growth. Meanwhile, Trump’s escalating trade war and politicization of institutions have provoked further uncertainty and global instability.

What a week! The week was not without its drama and may turn out to be pivotal. U.S. stock markets saw all-time highs (SPX, NASDAQ), then outside week reversals with a negative close signalling a potential important top. The prime reasons were the tariffs and the weak job numbers. However, there were other events that may or may not be of significance to the stock market but are definitely worth noting:
The dirty baker’s dozen, plus one:
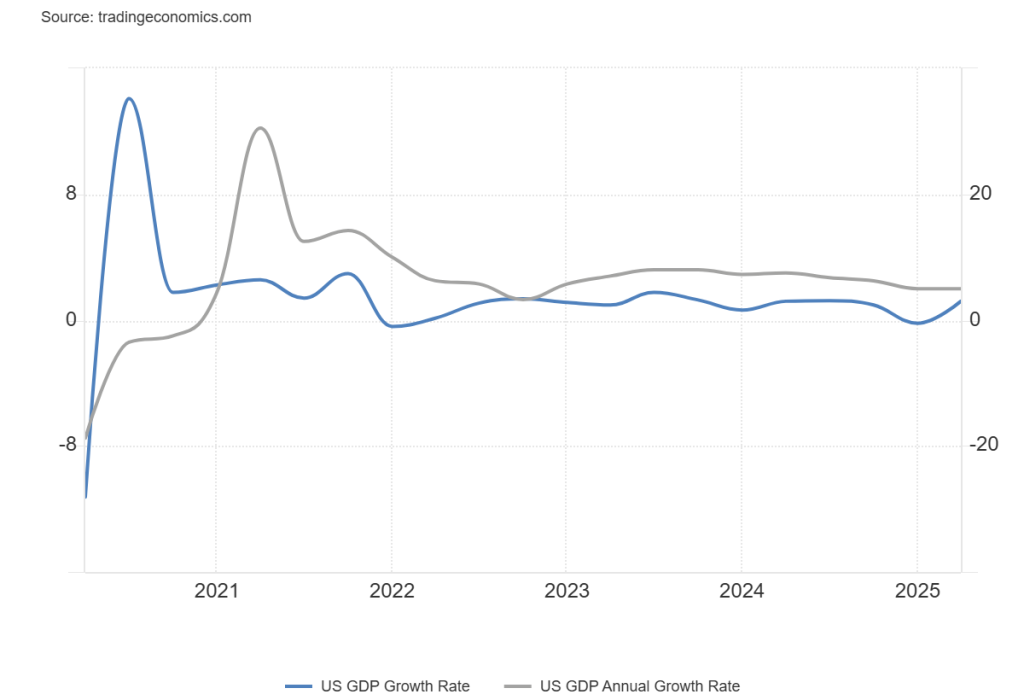
- Q2 advanced GDP was +3.0%. But Q1 saw a huge inventory buildup of imports while awaiting tariffs, then imports plunged in Q2. As a result, Q1 saw negative growth of 0.5%. Add the two quarters together and the average was 1.25% for the six months, below normal.
- The jobs report was the worst report since 2024 but, notably, it was made worse with the steep revisions of May and June.
- Tariffs, tariffs, tariffs. Announcement of some deals where it appears the other country goods are subject to tariffs but not U.S. goods. There were a number of countries that didn’t sign a deal, including, notably, Canada where the USMCA deal ensures 90% of Canadian goods still go into the U.S. tariff-free. Some were hit by 50% tariffs. Retaliatory tariffs remain a possibility.
- In response to the poor job numbers Trump had the head of the BLS fired.
- A Fed governor resigned, giving Trump the ability to appoint a new one. Trump admonished Fed Chair Jerome Powell again for not cutting interest rates, once again threatening to replace him.
- Both the BofC and the Fed stood pat on interest rates this past week as was widely expected.
- The U.S. moved nuclear subs into regions near Russia in response to the U.S./Russia war of words over Russia to end the Russia/Ukraine war now. Cuban missile crisis in the making? Threat of 100% tariffs and sanctions against countries buying Russian oil; i.e. China and India?
- NPR and PBS are shutting down as a result of lost funding from the U.S. government. It puts a chill on the media.
- Disappointing earnings from some major companies.
- Ongoing bubble conditions, especially for AI stocks, that saw some MAG7 stocks make new highs again.
- A volatile oil market that jumped on the Russia news, then fell on the jobs report.
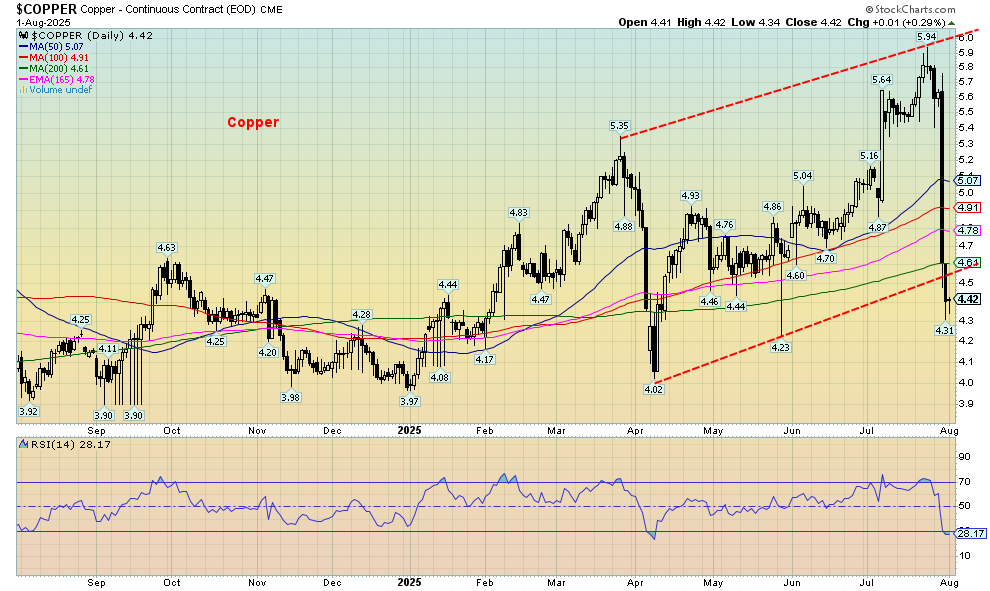
- Copper prices crashed after Trump announced only copper products would be tariffed, not the commodity.
- Slowing economic activity from both the EU and Asia as PMIs weaken.
- As a result of all of this, stock markets fell globally with the worst drop in months.
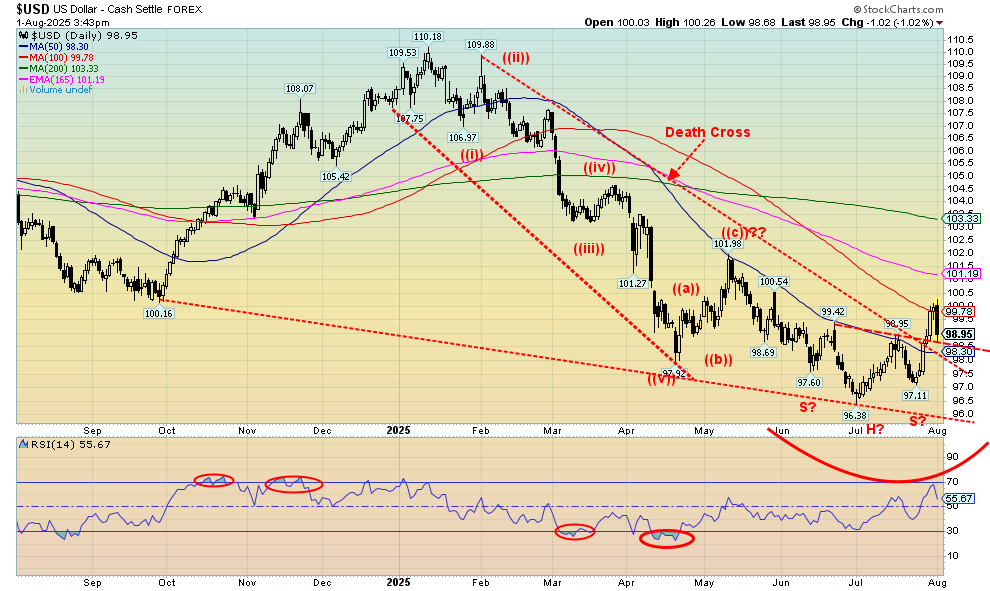
All this gave rise to the falling stock markets. Gold and gold stocks had a miserable week, then rebounded sharply on Friday following the job numbers. This may bode well for gold mining companies such as Aura Minerals Inc., that reported higher quarterly year-over-year revenue, profit, and cashflow, pays a dividend, and is held in the Enriched Capital Conservative Growth Strategy.* The US$ Index broke out but then following the weak job numbers it fell sharply. The US$ Index is our chart of the week (page 8). Will the US$ Index follow the breakout and move higher, or will the breakdown on Friday send it tumbling once again?
The modern conservative is engaged in one of man’s oldest exercises in moral philosophy; that is, the search for a superior moral justification for selfishness.
John Kenneth Galbraith, Canadian-American economist, diplomat, public official, intellectual, wrote several books, including The Affluent Society (1958), ambassador to India 1961–1963, professor of economics at Harvard University plus others, deputy director, Office of Price Administration, World War II; 1908–2006
Having a long-term strategy may seem a quaint idea in a market dominated by high frequency trading, the 24-hour news cycle, the ubiquitous and shrill blogosphere, flash crashes, and where it is repeated as though divinely given that buy and hold is dead.
William (Bill) H. Miller, American investor, fund manager, philanthropist, CIO Legg Mason Capital Management 2007–2016; b. 1950
People love me. And you know what, I have been very successful. Everybody loves me.
Donald J. Trump, 45th and 47th president of the U.S.A. 2017–2021, 2025–present, became president of his father’s real estate business in 1971, renaming it The Trump Organization, wrote The Art of the Deal (1987), host of reality TV show The Apprentice 2004–2015, controversial, convicted felon, known as the TACO man; b. 1946
Trade Wars
Or maybe not so much. Completely unexpectedly, the U.S. advanced Q2 growth rate (GDP) expanded by 3%. They had expected 2.5%. However, it should be noted this is not the final rate and revisions could lower it. This left the annualized growth at 2%. Q1 GDP came in at negative 0.5%, so the positive Q2 advanced GDP ensured there would not be two consecutive quarters of negative GDP that would signal a recession. The annual GDP was unchanged from Q1. Still, if you take the average for the two months, the growth rate was only 1.25% vs. 2.8% in 2024 and 2.9% in 2023.
The strong results for Q2 put a lie to the notion that tariffs would negatively impact the U.S. Instead, it’s the opposite, with everyone from Trump on down praising the result as if it were the second coming. Helping it along was the ADP Employment Report that showed an increase of 100,000 jobs vs. the expected 75,000. Happy days are here again! Wait, not so fast. The July nonfarm payrolls contracted, as we will note under U.S. Job Numbers. So, maybe not so happy after all.
It always pays to look under the hood. In Q1, business and consumers rushed to beat the tariffs by stocking up. As a result, imports surged 37.9%. Not so much in Q2 as imports fell 30.3%. A record trade deficit in Q1 contributed to negative GDP growth, whereas the big drop in Q2 of imports contributed to better than expected GDP. Consumer spending also rose in Q2 (1.4% vs. 0.5%) as did government expenditures (0.4% vs. -0.6%). Business spending fell 1.9% vs. 10.3% as business pulled back from the in-advance tariff spending of Q1.
All this contributed to the better than expected Q2 advanced GDP. Revisions usually lower it, but we’ll wait to see.
So, were the numbers really good? They were praised, but below the hood they are not so good.
Adding to some signs of weakness was core GDP which is real sales to private domestic purchasers; this dropped to an annualized 1.2% vs. 1.9% reported earlier. Inflation is still a problem as PCE prices year over year (y-o-y) rose 2.6% vs. 2.4% in June and the core PCE rate was 2.8%, unchanged from June.
The FOMC left rates unchanged as was widely expected. However, it still faced criticism from Trump who wants Fed Chair Powell to lower rates. After seeing these latest numbers, the odds of rates being lowered are slim. But the weak job numbers have put a rate cut back on the agenda for September.
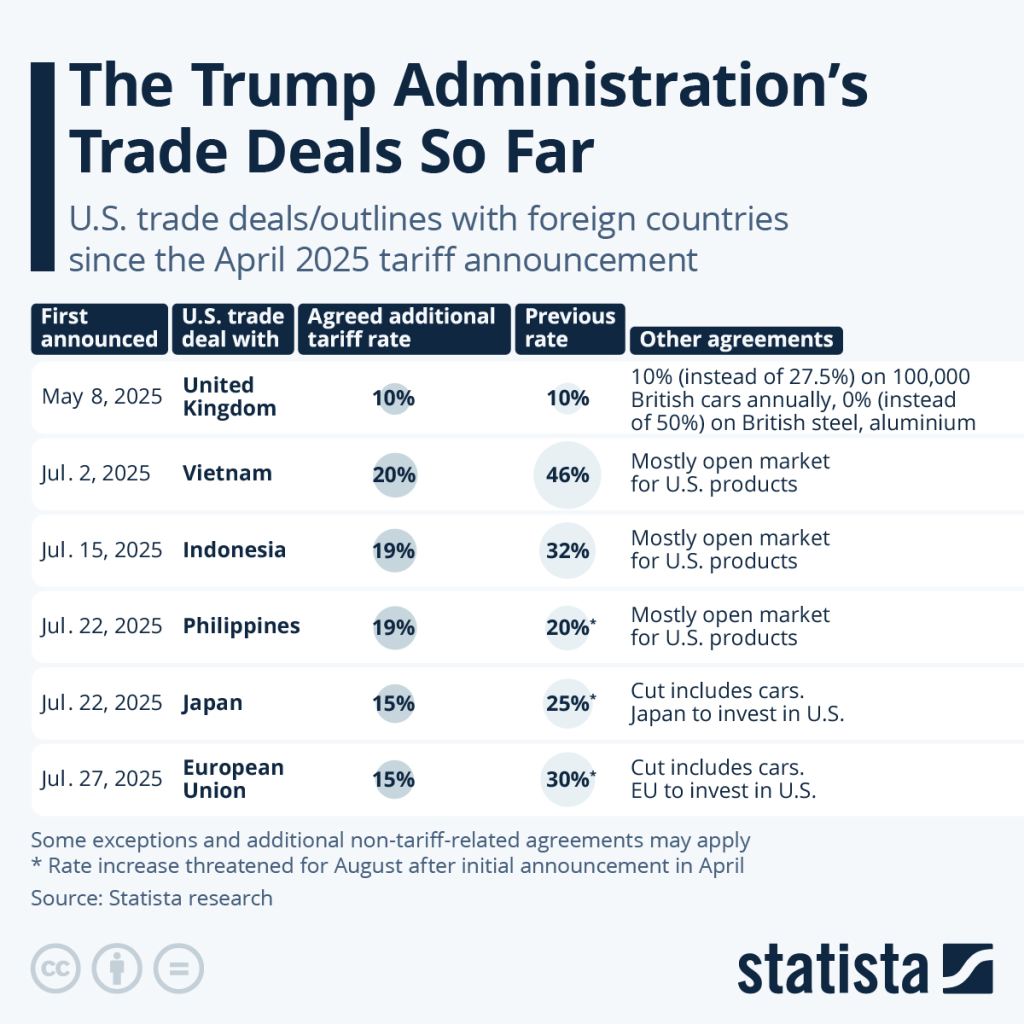
But what about all those trade deals that have been announced so far? Letters have been sent to numerous other countries including Canada, we presume. So far, the deals have left tariffs in place at anywhere from 10% to 20% with the U.K. at 10% and the EU and Japan at 15%. Those are down from a previous range of 10% to 46% with only the U.K. remaining unchanged. Still, we are reminded that all of these tariffs are higher than what was in place previously. But the supposed win-win for the U.S. was no counter tariffs from the countries and promises to open up their markets to U.S. goods and also invest billions in the U.S. for goods and infrastructure.
The screams are loud that all these countries capitulated to Trump. While the deals noted billions of dollars of investments to be made in the U.S., it remains to be seen whether they actually happen. The perceived capitulation by these countries matches the perceived capitulation of law firms, universities, tech firms, and media firms (including the shutting down of the Stephen Colbert Late Night Show by Paramount/CBS) and the defunding of the Corporation for Public Broadcasting (PBS, NPR) forcing them shut down. Mass capitulation in order to gain market access, lessen tariffs, and ensure contracts? The perception is yes. And do the goalposts move afterward? With Trump, one never knows.
Then came August 1 and, as Trump had promised, if you don’t have a deal with us, we’ll raise the tariffs. True to form, a raft of countries including Canada faced a jump in the tariff rate. Canada was hit with 35% with USMCA-compliant goods exempt. No matter how one looks at it, it’s not a good sign as the tariffs are higher than what was in place before, and, as was noted, they are higher than they were after the Smoot-Hawley Tariff Act of 1930. The trade wars are back on; however, we await the response from the impacted countries. Will they place counter tariffs on the U.S.?
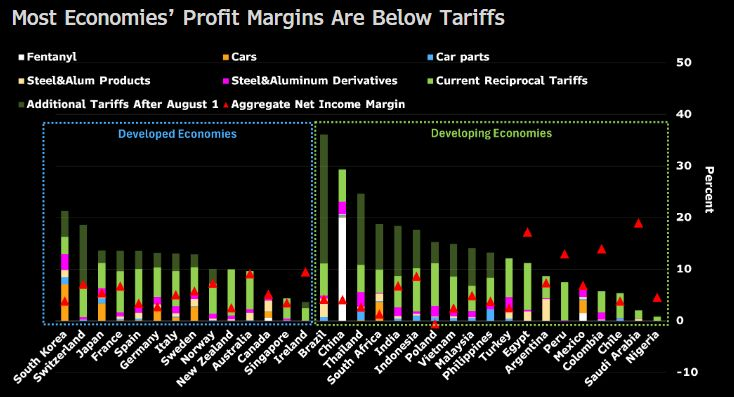
Revenues from tariffs are already up sharply—last reported at around $150 billion and predicted to rise. But the U.S. spends $7.2 trillion and taxes alone collect $5.2 trillion. So far, it’s a rounding error. With tariffs at 15%, that would put numerous corporations under water, wiping out all their profits and maybe even resulting in losses. Many will have no choice but pass the costs on to consumers.
Already some of the trade deals are receiving negative pushback, especially in the EU. Note that not everything in the EU is subject to tariffs as there are a number of key exceptions, including chemicals, aircraft and parts, plus others. Whether that changes anything remains to be seen. But knocking out the roughly $600 billion in investments or purchasing $750 billion worth of oil and gas from the U.S., which may or may not happen, could certainly lessen this deal with the EU.
Trump has issued an ultimatum to Russia for a peace deal with Ukraine in 10–12 days; otherwise, the U.S. will place sanctions of 100% tariffs on countries that import oil from Russia. Notably, that includes China and India. Brazil could still face higher tariffs as Trump is not happy that his friend Jair Bolsonaro, the former president, is under indictment for a number of charges. Trump wants Bolsonaro’s trial halted and has placed sanctions on the judge. Some, including Russia, have already voiced that placing these huge tariffs on countries would be illegal and an act of war. Sanctions have a long history of never working.
One major thing all this leaves out is the massive debt of the U.S. and others. The following chart shows the debt to GDP of the G7 countries. They are the key countries and represent 44% of global GDP. China and India represent about 20%.
| Country | Total federal debt (U.S.$ trillions) | Debt to GDP % |
| U.S.A. | $37.2 | 123.2% |
| Germany | $3.6 | 73.9% |
| Japan | $12.3 | 292.3% |
| U.K. | $4.2 | 114.2% |
| France | $4.1 | 124.3% |
| Italy | $4.0 | 161.3% |
| Canada ** | $2.7 ** | 118.7% ** |
| China | $16.3 | 86.2% |
| India | $3.7 | 93.0% |
www.statcan.gc.ca
The reaction to all this and recent economic numbers has in some ways not been positive. The US$ Index (USDX) has broken out, gold and the precious metals have fallen although they bounced back following the weak job numbers. The stock market still makes new highs although momentum is fading. Then came a big downside reversal on Thursday followed by further losses on Friday following the job numbers. With the tariffs and the poor job numbers, the stock market is falling. Is it over?
The breakout of the US$ Index is of concern if you are heavy in the precious metals market (gold, silver, platinum, and near PMs palladium and copper). The metals had been reversing to the downside and we could see lower prices before we bottom. The failure of gold to make new highs while the others did suggests that gold may have signalled that the others were making false outbreaks.
The following, as our chart of the week, is the US$ Index and its breakout from a possible head and shoulders bottom pattern. The pattern (if correct) projects up to 101.40. There is resistance in that zone. If we break through 102.00, then it would suggest a further move to the upside. However, the job numbers have knocked the USDX back down. The breakout would be invalidated if we break below 97.11, the possible right shoulder of the head and shoulders pattern. The head and shoulders pattern is imperfect as normally the left shoulder is lower than the right. We’ve seen false breakouts in the past.
We are also showing the copper chart where copper prices crashed 20% on July 30, 2025. The drop was nasty. But why did copper take such a hit? Trump had announced that copper would face 50% tariffs. The tariffs were to be on all forms of copper from commodities to products. Given the anticipated tariffs, it led to a massive
stockpiling of refined copper in the U.S. to beat the tariffs. It helped push up copper prices. Then along came the TACO man, announcing it would be applied to copper products only and that copper commodities would be exempt. As a result, warehouses were now stuck with copper and excess inventories. They had to either export the copper or liquidate stocks. Prices collapsed.
However, we can’t help but notice that we have become quickly oversold. We did break below the bottom of a channel, but now could be rebounding back. We have broken below a support point of $4.40. This suggests that copper could remain weak for some time before it forms a bottom. It’s no surprise that Freeport McMoran (FCX), the world’s leading copper company, fell 9.5% in response.
Copper
We’ll close with the Fed standing pat at this week’s FOMC. The key message is the economy is doing just fine, according to Fed Chair Jerome Powell. But do the weak July job numbers change everything? Trump is calling for the Fed board of governors to overthrow Powell. That’s not likely to happen.
The world is drastically changed as a result of these tariffs. Add in the threats to Russia and others. Notably, other countries do not take orders from Trump and the U.S. But we can’t help but hark back to the 1930s and
the trade wars that culminated in the Great Depression and World War II. So far, there are few signs that we are headed in that direction, but it is a warning.
U.S. Job Numbers
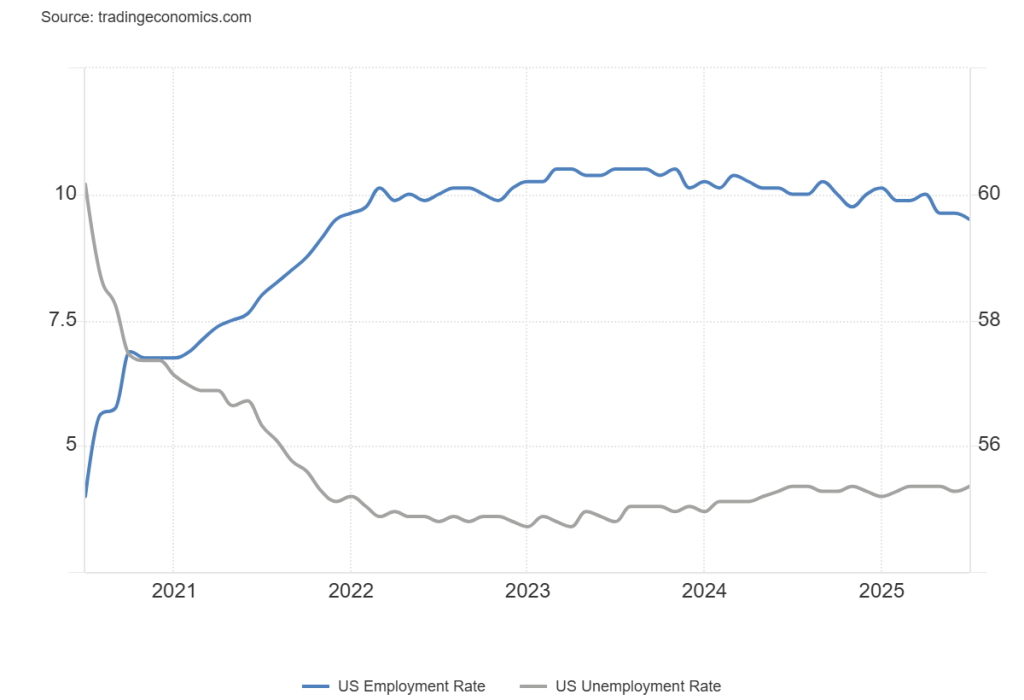
Is the U.S. labour market on the verge of imploding? The July nonfarm payrolls came in as a gain of 73,000 when the expectation was a gain of 104,000. All the jobs (79,000) were in the health/social assistance category with everything else losing. As if that weren’t bad enough, the previous two months (May and June) were revised downward by a whopping 258,000. As a result, this left the average employment gain for the past three months at 35,000 vs. a 12-month average of 128,000. Is the U.S. finally starting to see the negative impact of tariffs, DOGE, the expulsion of immigrants, etc.?
The unemployment rate U3 rose to 4.2% vs. 4.1% while the highest reported unemployment rate U6 (total unemployed, plus all persons marginally attached to the labour force, plus total employed part-time for economic reasons, as a percent of the civilian labour force, plus all persons marginally attached to the labour
force) rose to 7.9% from 7.7%, the highest level since 2021 as the impact of the COVID pandemic recession was beginning to wear off.
But it could be worse. The civilian labour force contracted by a whopping 793,000 (all figures from the Federal Reserve Bank of St. Louis, www.stlouisfed.org), the employment level fell 260,000, while the unemployment level rose 221,000. All this against the backdrop of the population level rising 200,000. As well, the not in the labour force category rose 239,000, but it does contain retirees, stay-at-home persons, students, etc. And—no surprise—the category of not in the labour force but want a job now also rose.
Fewer are working as the labour force participation rate fell to 62.2% vs. 62.3% and the employment population ratio fell to 59.6% vs. 59.7%. The length of time unemployed is also increasing as the average number of weeks unemployed rose to 24.1 weeks vs. 23 weeks and the median weeks unemployed rose to 9.3 weeks vs. 7.9 weeks. The number unemployed 27 weeks or longer rose 273,000. The number of multiple job holders, however, fell to 5.1% from 5.4%. We suppose if there was any good news, it was average hourly earnings rising 3.9% y-o-y vs. the previous 3.8%.
Manufacturing indices remain in recession territory as the Chicago PMI was at 47.1, the S&P Global Manufacturing PMI was at 46.1, and the ISM Manufacturing Index was 48. Any readings below 50 are considered recessionary.
Placing this against the backdrop of inflation slowly moving higher, this puts the Fed in a big bind as what to do. Stagflation is not something that can be taken lightly: a slowing economy, rising unemployment, and rising inflation. Still, the expectations are that the Fed will cut rates in September, although probably not as much as Trump is demanding.
Interestingly, consumer sentiment has bounced back a bit as the final July Michigan Consumer Sentiment Index was 61.7 vs. 60.7 in June and the expected 61.8. Inflation expectations are also rising. It was stated that the employment report was consistent with an economy growing at 1.25% annually, which is the average of the previous two quarters.
As a result of the poor job numbers, Trump had the head of the Bureau of Labour Statistics (BLS) fired in a move seen as political, with Trump claiming the numbers were rigged. This now raises questions about the reliability of future data.
Not a great report. Canada reports its job numbers next Friday. They too are expected to see job losses after June’s big jump and also an uptick in unemployment. None of it would be a surprise, especially given the growing weakness in the U.S.
S&P 500
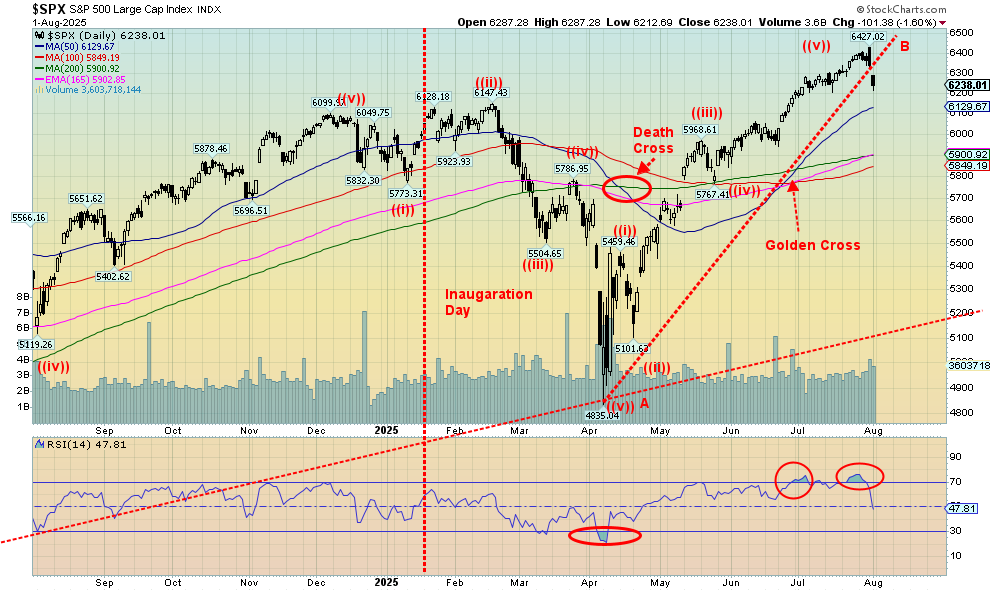
Ouch! It was a nasty week for the stock market, thanks to the poor job numbers on Friday along with the raft of tariffs announced. However, a quick look saw a number of reversals the day before, including what we’d call key reversal days. Key reversals were seen by the S&P 500 and the NASDAQ. Then on Friday they all gapped to the downside. That’s not a good sign and may signal that a significant top has been made. Given the overbought condition of the market, the registering of extreme greed, and many indicators diverging negatively, it shouldn’t have come as too much of a surprise. This overvalued market was waiting for an accident. No, it wasn’t the worst ever, but it was the worst decline going back more than a few months.
On the week, the S&P 500 fell 2.4%, the Dow Jones Industrials (DJI) was down 2.9%, the Dow Jones Transportations (DJT) was particularly hit, off 7.7%, and the NASDAQ fell 2.2%, held up by a few of the MAG7 making new all-time highs. That also helped the S&P 500 and the NASDAQ to make new all-time highs this past week; hence, why we noted the key reversals (a higher high including a new all-time high, then a lower low and close on the week). The other indices didn’t fare well either with the S&P 400 (Mid) off 3.5% and the S&P 600 (Small) down 4.0%. The S&P 500 Equal Weight Index was hit, down 3.3% more than the S&P 500; hence, the power of the MAG7. The NY FANG Index fell 1.5% and also made all-highs before reversing.
Of note were the MAG7 and the FAANG stocks on the week. Meta, Microsoft, and Nvidia all made all-time highs. They are MAG7 stocks. Meta and Microsoft held on to their gains and Nvidia also held, but barely. Big losses were seen in other FAANG stocks with Amazon down 7.2% and Snowflake off 6.6%. Notably, others also made all-time highs including Snowflake, Advanced Micro (AMD), and Broadcom. All closed down on the week. MAGS, which represents the MAG7, made all-time highs, and then closed down 1.8%. Notably, although not a FAANG stock, Trump Media (DJT) fell 11.6% on the week.
Bitcoin wasn’t spared, falling 3.7%. In Canada, the TSX Composite made all-time highs but closed down 1.7%. It was a reversal, but unlike the U.S. indices, it was not a key reversal. The TSX Venture Exchange (CDNX) didn’t fare well, down 5.0% as profit-taking hit the juniors. All the TSX sub-indices closed lower on the week led by Health Care (THC), down 4.7%. THC is not a big part of the composite. Financials (TFS) lost 2.4%. The only new all-time high was Utilities (TUT) but it closed down as well, off 0.3%.
It the EU, the London FTSE was the only one making all-time highs, then it closed down 0.6% on the week. The Paris CAC 40 lost 3.7%, the German DAX fell 3.0%, while the EuroNext was down 3.1%. In Asia, China’s Shanghai Index (SSEC) fell 0.9%, the Tokyo Nikkei Dow (TKN) dropped 1.6%, while Hong Kong’s Hang Seng (HSI) fell 3.5%. Notably, the TKN had made all-time highs the previous week. The MSCI World Index (ex-U.S.) fell 3.6%.
All in all, it was a miserable week for the stock market. The signals were universal that we may have made our high for the year, but we are not as yet confirmed. Key reversals followed by gap downs are not normally recoverable unless we rebound and close that gap, moving on to new highs. Not a lot of numbers to focus on this coming week with the ISM Manufacturing numbers being the most notable. That suggests other things could take front and center like tariffs, the looming confrontation between the U.S. and Russia, and concern over the firing of the head of the BLS. As well, we note a Federal Reserve governor is resigning, allowing Trump to potentially appoint someone more to his liking as he continues to rail against Fed Chair Jerome Powell. The fight with Powell is, as many note, unbecoming and potentially dangerous as markets do not wish to see someone in charge who is perceived to be merely a front for Trump. Politicization of the Fed is not a good idea.
The next good support for the S&P 500 is 6,100, but below that level the next one is at 5,900. Indicators have turned negative and the short-term (daily) trends have either turned neutral or down. Filling the gap and making new highs would save this market for another day. August ranks low for the indices registering as number 10 or 11. But September is the worst month. The falls usually start in August and finish in October. Historically, Septembers posts negative returns.
Given the negative signals of the past week, it may pay to batten down the hatches a bit and raise some cash. If the market should happen to take a big hit, remember even gold and gold stocks can fall along with the stock market.
A quick note on bonds. Yields fell this past week as a result of the poor job numbers. The U.S. 10-year Treasury note fell to 4.23% from 4.39% and the Canadian 10-year Government of Canada bond (CGB) dropped to 3.47%
from 3.53%. The 2–10 spreads saw the U.S. at 53 bp and Canada at 70 bp. Both continue to point to a pending recession.
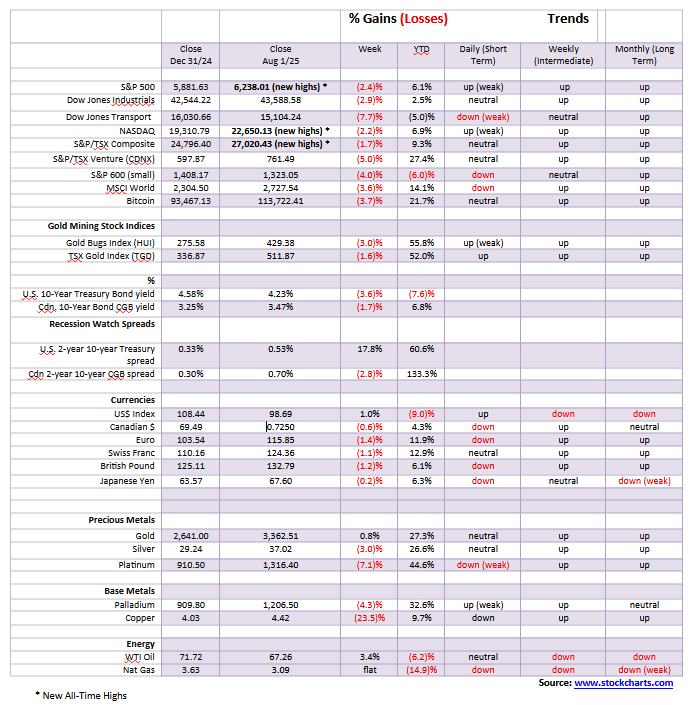
The Scorecard
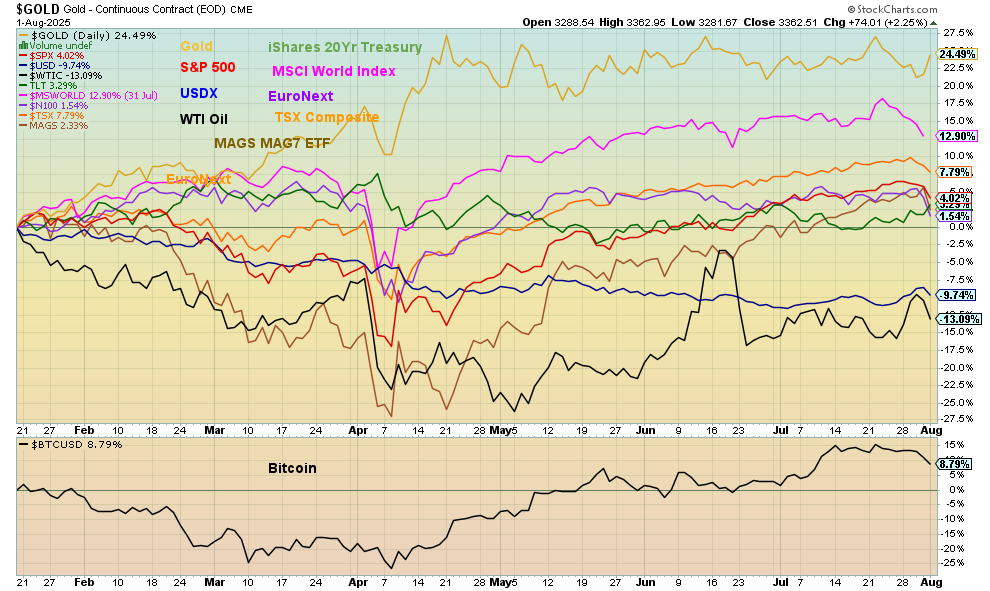
It’s six months into No. 47’s reign and gold remains the winner, up 24.5%. Meanwhile, most of the others tilted badly this past week with losses. Only the TLT and USDX survived the market sell-off. The MSCI World Index remains in second place, up 12.9%. The USDX and WTI oil are the only losers (so far), down 9.7% and 13.1% respectively.
Gold
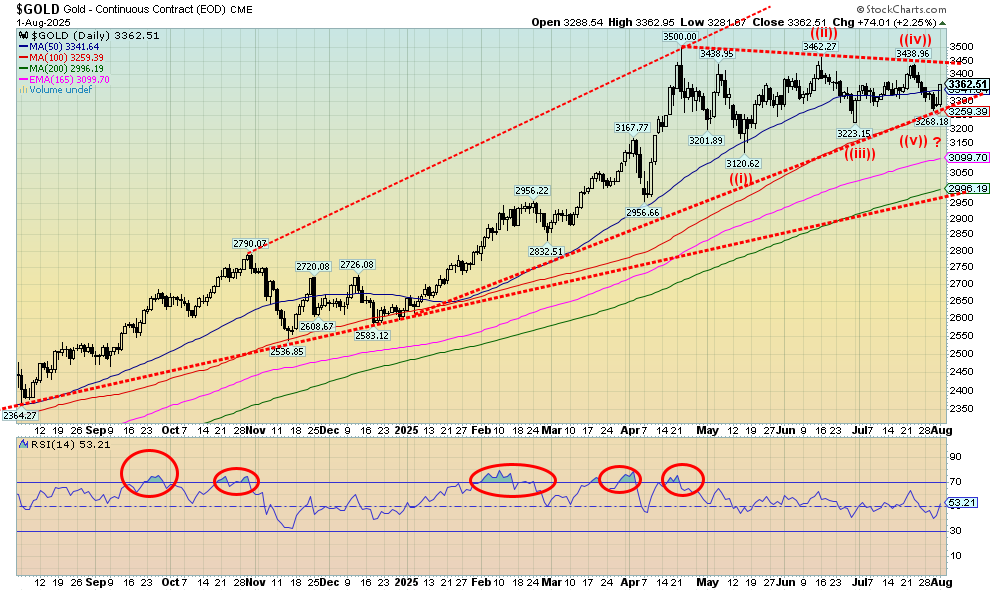
It was a frightening week for the precious metals, especially copper. But then along came the July jobs report and the metals bounced back. However, only gold managed to bring its head back from under water, closing with a gain of 0.8% on the week. The others weren’t so successful. Especially hard hit was copper that crashed, down 23.5%. We covered copper earlier so no point in repeating. As to the others, silver fell 3.0%, platinum was knocked down 7.1%, while palladium dropped 4.3%.
After earlier having made new 52-week highs, both silver and platinum came down to earth. Both broke support. Earlier we had noted our nervousness over the fact that both silver and platinum made new highs but gold did not. A divergence. Did the chickens come home to roost? Now they both broke a support line but gold held. Another divergence? We’ll just have to wait and see. Only new highs for all three could save
the day. The big concern, however, is copper, a metal we normally see rising (or falling) with gold. Copper recovered a bit on Friday but it was only a small 0.3%.
Our key support for gold remains at $3,200. Below that level, a fall to $3,000 is possible. Optimistically, we look at what appears to be an ABCDE-type corrective pattern. Have we finished the E wave? Only new highs can confirm that. Gold likes the sound of potential rate cuts and Friday’s job report could be the catalyst to rate
cuts. In one of his usual piques, Trump had the head of the Bureau of Labour Statistics (BLS) fired, accusing her (without evidence) of manipulating the figures for political purposes. Oddly, the deputy commissioner was appointed, at least temporarily, in her place. Nonetheless, the whole affair now throws into question future reports from the BLS. The agency has roughly 2,300 employees gathering data.
Gold appeared not to react to geopolitical maneuverings of the U.S. sending nuclear subs into regions closer to Russia. It’s hard to say at this time whether it means anything or is just bluster, given the current war of words between Russia and the U.S. Memories of the Cuban Missile Crisis (1962) leaped to mind. The U.S. has threatened to impose punishing tariffs on Russia and all who buy oil from Russia if Russia doesn’t comply with ending the Russia/Ukraine war in roughly 12 days. Those potentially impacted have noted it as a potential act of war that prompted strong words from Russia’s Deputy Chairman Dmitry Medvedev. If this dispute heats up any further, gold could rise more.
Analysts we follow seem mixed, with some noting the big drop earlier in the week as negative that could send gold and the metals lower. Others were more buoyed by Friday’s gains and signaled this could be the start of another rally. That’s why we await new highs. Silver has important support at $35.50/$36, but if that broke it could fall to $34.50 and, in a worst-case scenario, down to $33.00. The gold stocks weren’t hit too hard this past week so that bodes well for a rebound to get underway. The Gold Bugs Index (HUI) fell 3.0% but the TSX Gold Index (TGD) was down only 1.6%. It’s a bit worrisome if the TGD breaks 500 but more of a concern if it breaks 490. 10% or more corrections of the gold stock indices are not unusual, even in a strong up move.
The short-term (daily) trend did weaken for all the metals this past week but, outside of platinum, none have yet to turn down. And, so far, platinum’s downtrend is weak. Another down week could change all that, but an up week and positive follow-through from Friday’s action would be positive for the sector, supporting the rebound and continuance of the uptrend.
Markets & Trends
__
(Featured image by Chris Liverani via Unsplash)
DISCLAIMER: This article was written by a third party contributor and does not reflect the opinion of Born2Invest, its management, staff or its associates. Please review our disclaimer for more information.
This article may include forward-looking statements. These forward-looking statements generally are identified by the words “believe,” “project,” “estimate,” “become,” “plan,” “will,” and similar expressions, including with regards to potential earnings in the Empire Flippers affiliate program. These forward-looking statements involve known and unknown risks as well as uncertainties, including those discussed in the following cautionary statements and elsewhere in this article and on this site. Although the Company may believe that its expectations are based on reasonable assumptions, the actual results that the Company may achieve may differ materially from any forward-looking statements, which reflect the opinions of the management of the Company only as of the date hereof. Additionally, please make sure to read these important disclosures.


The TopRanked.io Weekly Digest: What’s Hot in Affiliate Marketing [LiveChat Affiliates Review]
Quick Disclosure: We’re about to tell you how LiveChat Affiliates run a top-notch affiliate program. And we really mean it....


German SMEs Face Tighter Bank Lending, Turn to Alternatives
Access to bank loans for German SMEs is tightening despite strong financing needs. About 37.8 percent face restrictive lending, driven...


Bitcoin Stalls as Geopolitical Risks and Crypto Industry Tensions Persist
Bitcoin is moving sideways near $72,000 amid ongoing Iran tensions, while ETF inflows remain strong. Quantum security debates continue. Ethereum...


Geopolitical Tensions and Trade Disruptions Reshape Global Commodities Markets
Geopolitical tensions and disrupted trade routes, especially around the Strait of Hormuz, are reshaping global commodities markets. Agriculture faces supply...


Germany Sees 413 Cannabis Cultivation Clubs Two Years After Partial Legalization
Two years after partial cannabis legalization in Germany, 413 cultivation clubs have been established nationwide. Lower Saxony leads in clubs...
 |
|
 |  |
 |
|
-

 Crypto2 weeks ago
Bitcoin Slides, Ethereum EEZ Emerges, Worldcoin Hits Low
-
 Crypto2 days ago
Bitcoin Stalls as Geopolitical Risks and Crypto Industry Tensions Persist
-

 Africa1 week ago
Casablanca Stock Exchange Profits Surge in 2025 as Growth Momentum Strengthens
-
 Africa4 days ago
Foreign Exchange Markets Walk a Tightrope Amid Geopolitical Tensions and Policy Uncertainty