Featured
The turmoil in the stock markets continues
Gold paused this week as did the gold miners but silver was up. Our chart of the week looks at the gold/silver ratio and we note that it has a tendency to peak during recessions. Record highs were seen during the Great Depression and just prior to WW2. We were recently once again making record highs. Oil prices have had quite a run but they too appear to be running out of steam.

The great re-opening continues. We have good news and bad news. The good news is the number of cases in both Canada and the U.S. continues to decline, giving some steam to those wanting to open up the economy. The good news for Canada and the U.S. is tempered somewhat by sharp rises elsewhere, particularly in Russia and Brazil who have vaulted into second and third place behind the U.S. The U.S. remains number one in cases and deaths. Overall, the number of cases globally is rising irregularly, not falling.
The bad news is the hits to the economy keep on coming. Housing starts for April in the U.S. plunged 30.2% while building permits were down 20.8%. Existing home sales fell 17.8%. Initial jobless claims came in at 2.4 million, slightly above expectations although down from the previous week. The 9-week tally now stands at 38.6 million, a good third of the U.S. labour force. For the May nonfarm payrolls to be released on June 5, 2020, a decline of at least 7 million and an unemployment rate of 20% are expected.
The Philadelphia Fed Manufacturing Index actually improved slightly to negative 43.1 in May from negative 56.6 in April. The April reading was the lowest since July 1980. The Markit Manufacturing PMI came in with a reading of 39.8, slightly better than expected and up from the 36.1 reading in April. The Services PMI was also slightly better at 36.9 vs. 26.7. Still, both are well below the 50 level that defines a recession. The improvement for both may reflect attempts to open the economy. There were not a lot of economic numbers out for Canada this past week. The year-over-year inflation rate for Canada to April 2020 was down 0.2%, although the core inflation rate ex food and energy was up 1.2%. It was the first-time inflation fell in Canada since 2009.
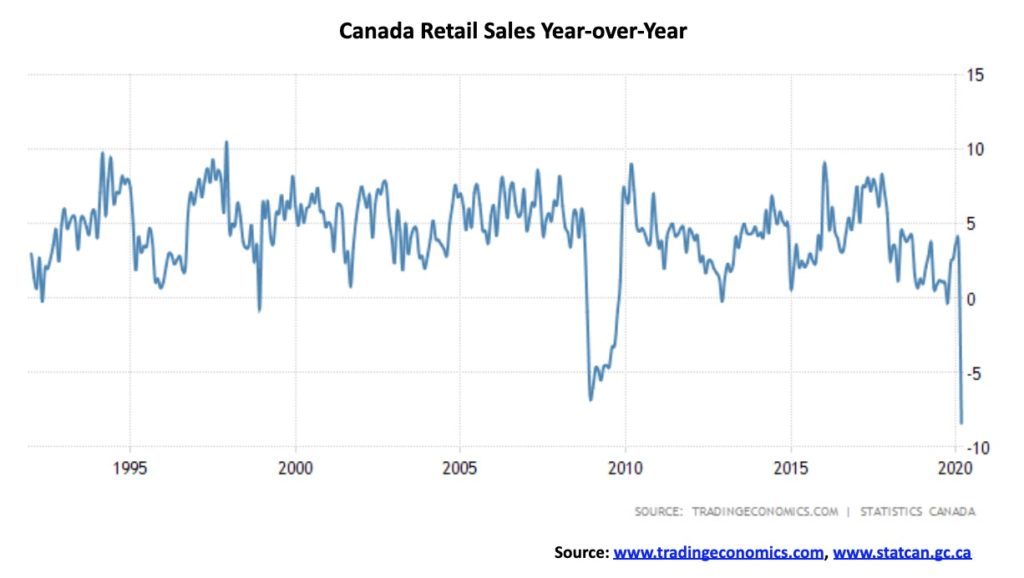
Canadian retail sales plunged 10% in March from February. It was the largest monthly drop ever recorded. On a year-over-year basis, retail sales fell 8.4% in March. That was a steeper drop than any recorded during the 2008 financial crisis. The biggest declines in March were in sales of automobiles and auto parts, followed by clothing and clothing accessories. Gasoline sales also fell sharply. Food and beverage and general merchandise rose. Advanced estimates for April see retail sales falling 15.6%.
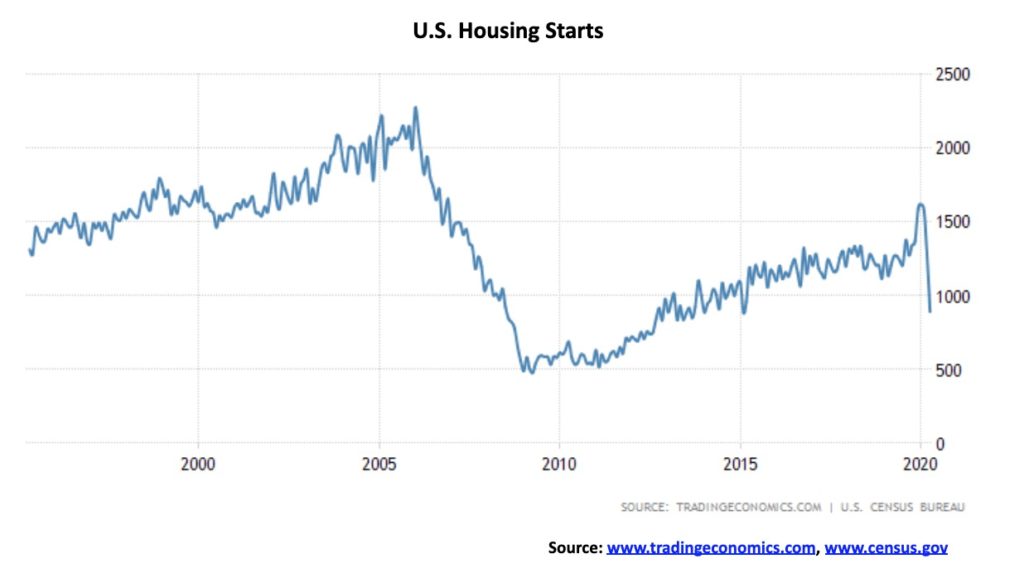
The U.S. housing starts plunged back to levels last seen in February 2015, effectively wiping out 5 years of gains. Year-on-year housing starts collapsed 29.7%. Here in Canada, Canada’s national housing agency released a report suggesting home prices could plummet 9%–18% as mortgage arrears rise to 20%. Some real estate and bank experts consider that a bit dire. An 18% drop would exceed anything seen during the 1981–1982 and 1994–1995 declines. But mortgage deferrals are currently rising at around 12% and could rise to 20%. The bank deferrals are for six months only, to September 2020. And then what? The 18% figure is considered a worst-case scenario.
As of mid-May, banks had provided deferrals to over 740,000 homeowners which is 15% of mortgages in bank portfolios. There are estimates that upwards of 20% could become defaults unless the economy is turning the corner by then. That in turn would result in a raft of foreclosures with thousands of houses to come on to the market. Already national home sales fell 57% from March to April and prices fell upwards of 10% in some instances, particularly at the high end. Household debt to GDP in Canada stands at 101.67%, down only slightly from the previous month. It is the highest of the G7 nations. Canada’s household debt to disposable income is an astronomical 176% and could rise to 200% as the economy contracts. Against this backdrop, it is no surprise that banks are tightening credit and preparing for what could be record loan loss provisions.
Mortgages are not the only thing in trouble as there are signs that rents are coming down as well. With tourism in collapse, and immigration down, there are a lot more rental vacancies coming on to the market, particularly with the collapse of Airbnb short-term rentals as they attempt to convert to long-term rentals. Housing is an area that has become an accident waiting to happen.
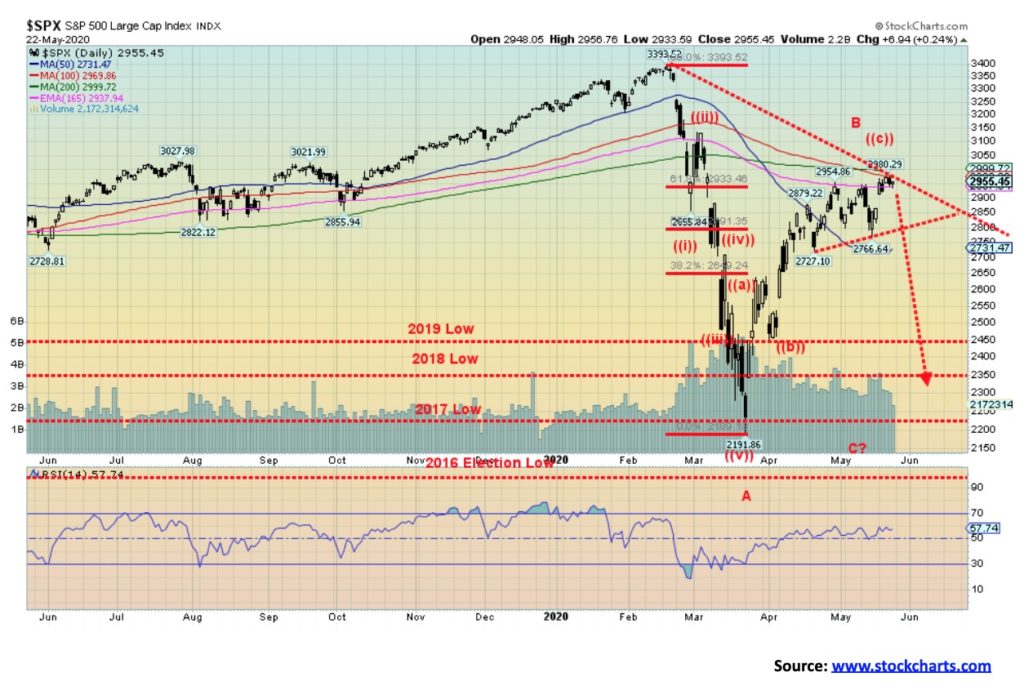
But bad news on the economic front is not all we have to deal with. The disconnect between Main Street and Wall Street continues. The S&P 500 has rallied 34% since the low in March 2020. It is bumping up against the 200-day MA, a key MA that can sometimes be used to define bear and bull markets. It is not unusual in either a bull or a bear market to test the 200-day MA and even go under/over it for a short period. But if the market is truly in a bull or bear market it will eventually fail the 200-day MA. In a bull market it rebounds and climbs higher; in a bear market it returns to the downside. We are now at that point.
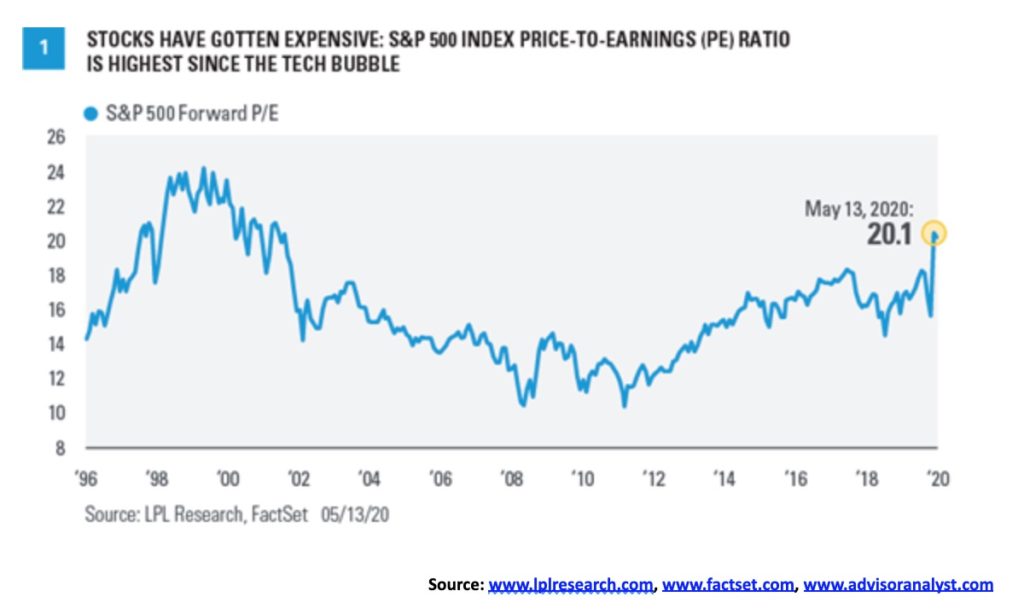
We note that, on the fundamental side, the forward (next 12 months) price-to-earnings (PE) multiple for the S&P 500 Index has jumped to 20.1, the highest level seen since the late 1990s during the high-tech/dot.com boom. However, it should be noted that a high valuation in and of itself is not a guarantee that the market will fall. But it is a signal that the market is overvalued and could be vulnerable to a fall.
The entire stock market is riding on a wave of hubris according to economist David Rosenberg. In a recent speech he noted that the stock market had some of its biggest up days on the release of the weekly initial claims. As if millions of people losing their jobs was a reason to celebrate in the stock market. The great disconnect between “Main Street” and “Wall Street”. The April nonfarm payrolls reported that 20.5 million lost their jobs and the unemployment rate was 14.7%. But as Rosenberg correctly pointed out the labour force participation rate fell to 60.2% from 62.7%. If the participation rate had held steady the job loss would have been closer to 27 million and unemployment rate of 20%. Those classified as not in the labour force because they dropped out from looking for non-existent jobs leaped by 3.5 million and now stands at 117.1 million. It wasn’t that long ago it was around 93 million.
Permanent job losses could be upwards of 10 million and that cost is roughly $1 trillion in an economy where consumers make up 70%. Sure, there has been considerable largesse paid out but all it does is allow things to stand still (hopefully). And what happens when it ends? Over 50% of the population has no savings. People aren’t going to be rushing to restaurants, getting on planes or going to the mall the same way they did before. Only a vaccine might get them back. And a vaccine is still months away despite all the current efforts.
Probably one of the biggest contributors to the stock market rally has been the adage that the “Fed has your back.” The Fed balance sheet has exploded from $3.8 trillion at the end of August 2019 to over $7 trillion today. Money supply (M2) has also exploded up over $3 trillion since the end of February 2020. All this money is going somewhere and it is not been spent on Main Street as the velocity of money continues to plunge downward. Powell’s musings that “there’s really no limit to what we can do in lending programs” has true meaning. Thoughts that the Fed might move to negative rates are just that—thoughts. Given the disaster and trap that negative rates have become in the EU and Japan, it would be quite a surprise to see the Fed do the same. But holding at or near zero percent as the Fed did from 2008 to 2016 appears to be set for several years to come.
The U.S./China spat may be a vote-getter for Trump in the November election, but the recent uptick in the rhetoric could have dire consequences. Besides the ongoing military dance in the South China Sea and elsewhere, the real danger now is that Trump tears up the Phase 1 agreement. Add to that the continual drumbeat against China, blaming them for the COVID-19, accusations that they are under-reporting, and the potential for another clash over Hong Kong—and we could have another shakedown comparable to what happened in January/March 2018 and again in October/December 2018.
A 20% decline from current levels for the S&P 500 would not be a surprise if the rhetoric intensifies. That would result in a test of the March lows but no new lows. As well, we note that Trump is pushing for U.S. companies to sever Chinese supply chains and bring U.S. manufacturing back to the U.S. That would upset what became known as the platform economy, a term we believe was coined by GaveKal Research (www.gavekal.com). The platform economy saw the high-end design, finance, marketing, and investment banking stay in North America while the production was outsourced. In this case China but also Mexico, Bangladesh, India, Vietnam, and other low-cost countries.
As we have often noted, no one wins in a trade war and it could degenerate into the “Beggar thy Neighbour” policies of the 1930s that deepened the Great Depression. To highlight the difficulty, we note that Canada is dependent on China for some 367 categories of goods such as pharmaceuticals and food additives, rare earths, and more that are not manufactured here in Canada. It is noted that some 87% of laptops and 78% of cell phones are produced in China. As a whole, of what is known as the “Five-Eyes”—U.S., U.K., Canada, Australia, and New Zealand—they are dependent on 831 categories of goods from China including 260 that are critical to national infrastructure from communications to manufacturing of computers. U.S. corporations can’t pack up and leave just like that. And at what cost? (The Globe and Mail – “Five Eyes allies urged to lessen dependence on China,” May 21, 2020).
Other tensions are building as well. The U.S. has given notice of pulling out of the “Open Skies” treaty, a 35-nation agreement allowing unarmed surveillance flights over member countries. The real target is Russia. The U.S. is also hinting at ending the START accord which imposes limits on Russian and U.S. nuclear arms when it expires in 2021. It would be the last of the treaties with Russia. The U.S. already has substantial sanctions on numerous Russian companies and individuals over Russia’s foray into the Donbass and Crimea (Ukraine). This just adds to the tensions between the U.S. and Russia.
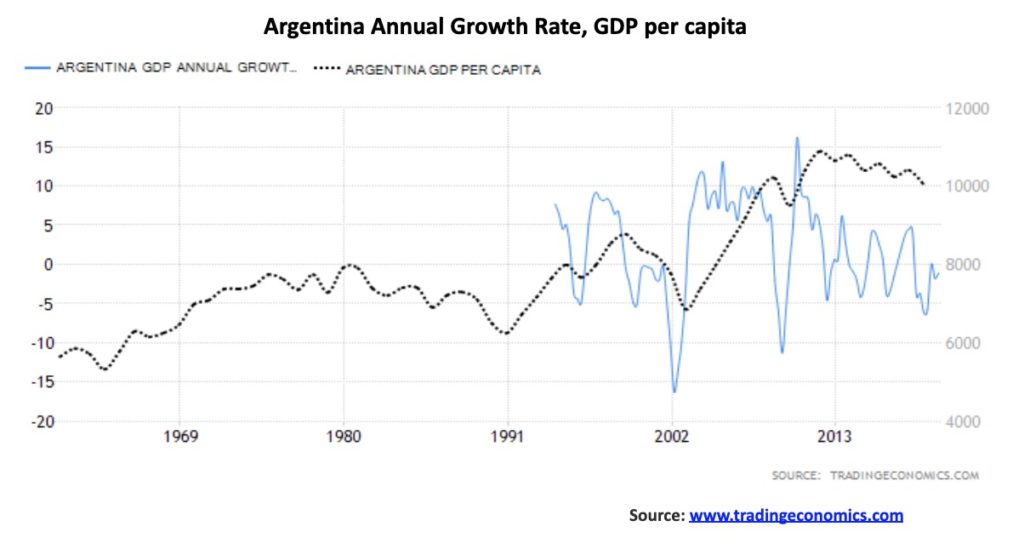
In closing, we note that by the time you read this Argentina may have entered its ninth default since its independence from Spain in 1816. It would also be the second default this century. Could this be the trigger for even more sovereign defaults? Argentina GDP and GDP per capita have been falling steadily for years. Note the rise in GDP per capita coming out of the steep 2000–2002 default and recession (depression?). Argentina GDP is expected to contract at least 7% in 2020. It is no surprise to learn that there has been a scramble for U.S dollars in the country as a hedge against further peso collapse. The official rate is roughly 67 pesos to US$1. But the unofficial black-market rate can easily range from 120 pesos to the dollar to up to 150 pesos to the dollar.
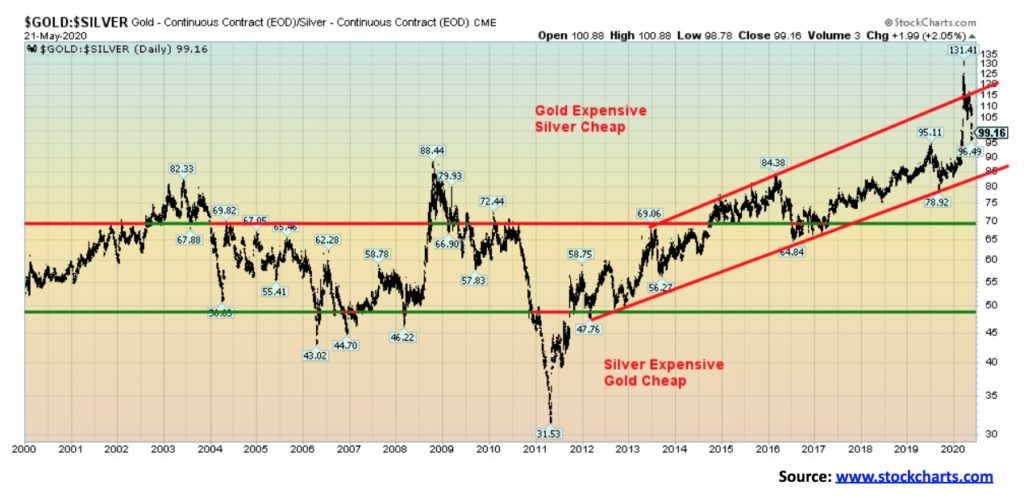
The recent jump in silver prices has brought the gold/silver ratio down from record levels. Yes, record levels. Never in the history of the gold/silver ratio had it reached as high as it did on March 18, 2020 with a price of 131.41. The ratio first peaked out in 1939 at 98:1 after gold was reset to $35/ounce in 1934 under President Franklin Roosevelt. The ratio has a long history. While we have in the past recounted its history it is always worth repeating.
The ratio of silver to gold in the earth’s crust is estimated at 17.5:1. Silver and gold have both been used as coinage dating back to at least 600 BCE. For hundreds of years the ratio was fairly steady at 12:1 to 15:1. The Romans set the ratio at 12:1. When the U.S. was founded, the U.S. government fixed the ratio at 15:1 under the 1792 Mint Act. The discovery of huge amounts of silver in the Americas allowed governments to manipulate prices, resulting in greater volatility into the 20th century. That led to the peak of 98:1. Following the Bretton Woods Agreement of 1944 the gold/silver ratio slowly fell, eventually nearing the historical 15:1 ratio into the 1960s and 1970s. After that it started to rise once again. For the 20th century the ratio averaged 47:1. During the 21st century the ratio has ranged from a low of 31.53 seen during the runup into the peak of 2011 to the recent high of 131.41 in March 2020.
Since the low seen in 2011 the ratio has averaged roughly 65:1. At that level silver would today be trading near $27 not $17.50. Since the peak in March the ratio has fallen quickly to 99.16. The past couple of weeks has seen the ratio gap down, signaling that the March high could be the high for some time. When silver is leading, meaning the gold/silver ratio is falling, the precious metals (gold and silver) tend to do well. Silver remains severely undervalued to gold. Our expectations are that the ratio should eventually return to the average seen over the past dozen years. That would imply higher prices for both gold and silver with silver outperforming. Silver also tends to outperform during a recession and coming out of a recession. The current conditions are ideal for silver to outperform.
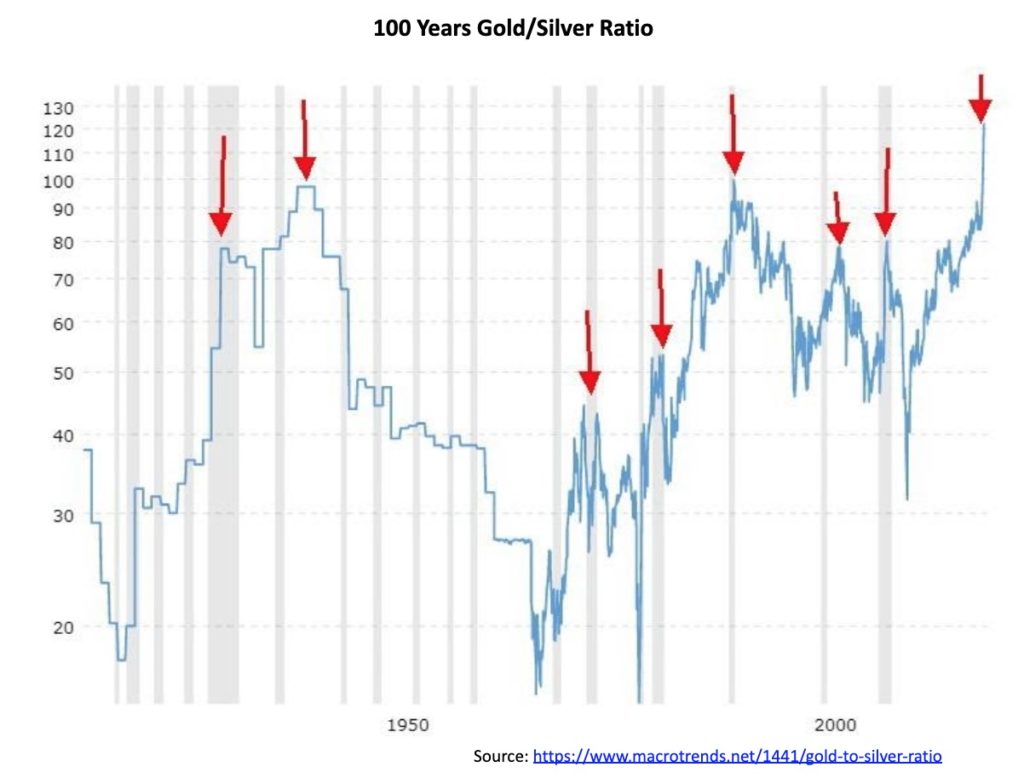
The 100-year chart of the gold/silver ratio is interesting because of when the peaks occurred. Peaks were seen during these periods:
- The Great Depression – 1931
- WW2 – 1940
- Recession 1973–1975 – 1973 and 1974
- Recession 1980–1982 – 1981
- Recession 1990–1992 – 1991
- High-tech/dot.com recession – 2003 (a little later)
- Great Recession – 2008
- Pandemic – 2020
Almost consistently, peaks were seen for the gold/silver ratio at or near the beginning of the recession but usually no later than the end of the recession. Bottoms were usually seen following years of positive growth, mild recessions, or at the beginning of what turned out to be a strong growth period. Bottoms were seen in 1967 (years of post-war growth), 1979 (inflationary 1970s), 1997 (high-tech boom bubble), and 2011 (beginning of a relatively strong growth period 2011–2019).
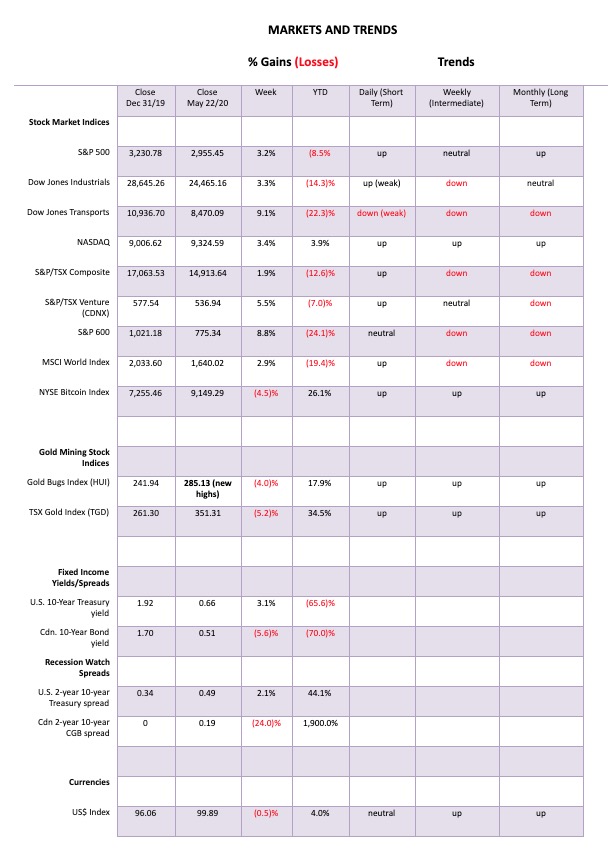
It was a quiet week before the Memorial Day weekend. Still, the markets were up as the rally continues but momentum is beginning to fade. The S&P 500 gained 3.2% on the week but remains down 8.5% in 2020. The Dow Jones Industrials (DJI) gained 3.3%, the Dow Jones Transportations (DJT) was up 9.1%, while the NASDAQ gained 3.4%. The S&P 600 small cap index was up 8.8% as small caps continued to lead. Elsewhere, the TSX Composite in Canada gained 1.9% while the TSX Venture Exchange (CDNX) continues its strong rebound, gaining 5.5%. Oversea,s the MSCI World Index was up 2.9%, the London FTSE gained 3.7%, the Paris CAC 40 was up 3.9%, the German DAX jumped 5.9%, the Tokyo Nikkei Dow (TKN) was up 2.6%, but China’s Shanghai Index (SSEC) was down 1.9%. Bitcoin fell 4.5%. The DJI has often followed Bitcoin, or is it vice versa. It was interesting that Bitcoin began its rise before the stock indices started theirs, possibly presaging the rise in the stock indices.
The impetus for the rise was the re-opening of the economy. The question on everyone’s mind, however, is will it work? What if it doesn’t and the cases and death count begin to rise again? Thoughts that they might shut things down again would likely not go over well. But what if the number of cases and deaths overwhelms the medical system? What then?
Given the background of record unemployment with millions out of work, businesses shut down and bankruptcies rising (Hertz is the latest), the energy industry in a depression, plus a myriad of other negatives, it was always surprising that the stock markets took off like they did. But, given the amount of liquidity being pumped into the financial system through the Fed and the sharp rise seen in money supply (M2), all that money goes somewhere and it certainly wasn’t going to Main Street. It was going to Wall Street. The big expectation is once the economy opens up it will be a V recovery. Okay, maybe a U recovery. How about we hope for a W recovery or a Nike Swoosh recovery? The last thing the stock market wants to hear is that it would be an L recovery which is no recovery at all. An L recovery is the stock market’s nightmare. The question is, just how much largesse can the Fed supply to the market? According to Fed Chair Jerome Powell “There’s really no limit to what we can do in lending programs.”
We guess that is all we really need to know. The Fed is a bottomless pit of money. The massive debt be damned. But the polarized fights between Republicans and Democrats are heating up, given we are less than six months from the election. Trump is panicking that he won’t get re-elected. Polls are showing that Biden could “wallop” him. But polls are just polls and the only one that counts is November 3. And Trump will be firing up his base and his rhetoric as we approach November. But, as we have noted before, it is not the popular vote that counts—it is the electoral college. Ms. Clinton may have won in 2016 by some 2.8 million votes but she lost the electoral college.
What’s important will be the so-called key battleground states in Michigan, Pennsylvania, Wisconsin, and Florida. Flip them back to the Democrats and Biden wins in 2020. All saw very close races in 2016 and it wouldn’t take much to shift them. Gaining 10 million more votes in states that are already held by the Democrats does nothing as the electoral college is all or nothing (mostly). Win the vote in the state even by 50.1% to 49.9% and you win 100% of the electoral college votes. However, in theory, the electoral college could split. Irrespective of this, the election promises to be the most controversial one ever and there are rising expectations that there will be violence. Rising violence going into the election could be negative for the stock markets because of the uncertainty it could create.
The S&P 500 has failed thus far to break out over the 200-day MA. The 200-day MA is currently at 3,000. Bear market rallies typically test the 200-day MA and even exceed it. But if we are in a secular bear, as we suspect, it doesn’t hold and the market typically falls back once again. During the 2007–2009 bear the S&P 500 broke the 200-day MA in November 2007. It tested the 200-day MA two more times in December 2007 and May 2008 before collapsing for good into first the October 2008 low and then again into the March 2009 low. The S&P 500 took out the 200-day MA in June 2009 and after that rarely looked back until now.
It did break the 200-day MA in October 2018 and tested it a couple of times after that in both November and December 2018 before plunging into the lows of December 2018. The subsequent rebound took out the 200-day MA February 2019 and didn’t break it again until March 2020. Failure to break firmly over the 200-day MA tells us that this is a bear market rally only and we could start to resume the downtrend at any time. Unless of course we firmly take out 3,000 on the upside and build value over that level we cannot say we are still in a bull market. Our breakdown point is at 2,800 although under 2,870 would be the first sign of trouble. The S&P 500 is terminal under 2,450 and below that new lows are possible. Firmly taking out 3,000 and remaining above that level for at least a few weeks would be a powerful signal the bear is over and the bull has resumed.
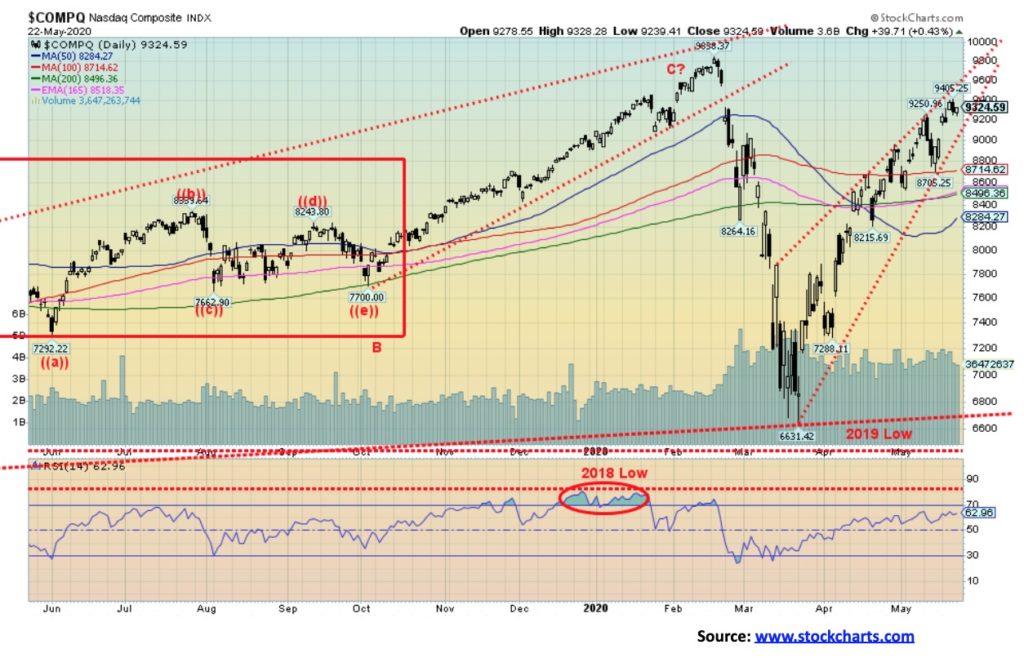
The tech-laden, biotech-laden NASDAQ continues to be the leader for the indices up 3.9% thus far in 2020, the only major index to be in the black. No wonder given that the NASDAQ is led by the technology and biotech stocks that have been the strong performers thus far in 2020. But the NASDAQ appears to be forming a potential ascending wedge triangle. That is bearish if it turns out to be the case. Currently the NASDAQ is trading near the top of the channel. But the channel is narrowing and the NASDAQ will soon be running out of room. So it either falls or it busts the ascending triangle and moves sharply higher. The breakdown is at 9,050. Confirmation of a breakdown would be seen under 8,075. Under 8,300 the NASDAQ could begin to fall to test the lows. The ascending wedge triangle suggests that the NASDAQ could return from where it started. That’s the March lows at 6,631. A firm breakout over 9,500 would most likely invalidate the ascending wedge triangle.
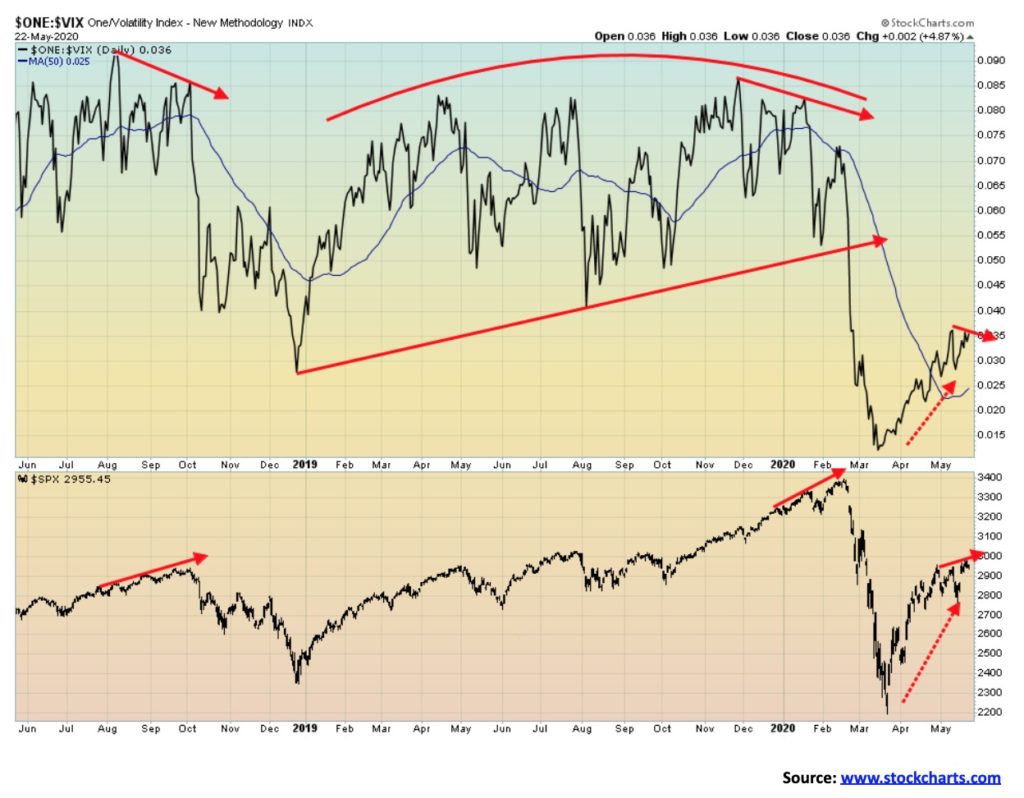
A little divergence? The VIX Volatility Index is currently making a lower high even as the S&P 500 is making new highs. This divergence has been seen at previous tops in August/September 2018 and again in January/February 2020. No, the divergence is not confirmed and a further rise for the S&P 500 could eliminate the divergence. But it is worth noting given that the NYSE advance decline is also showing a similar divergence (discussed below).
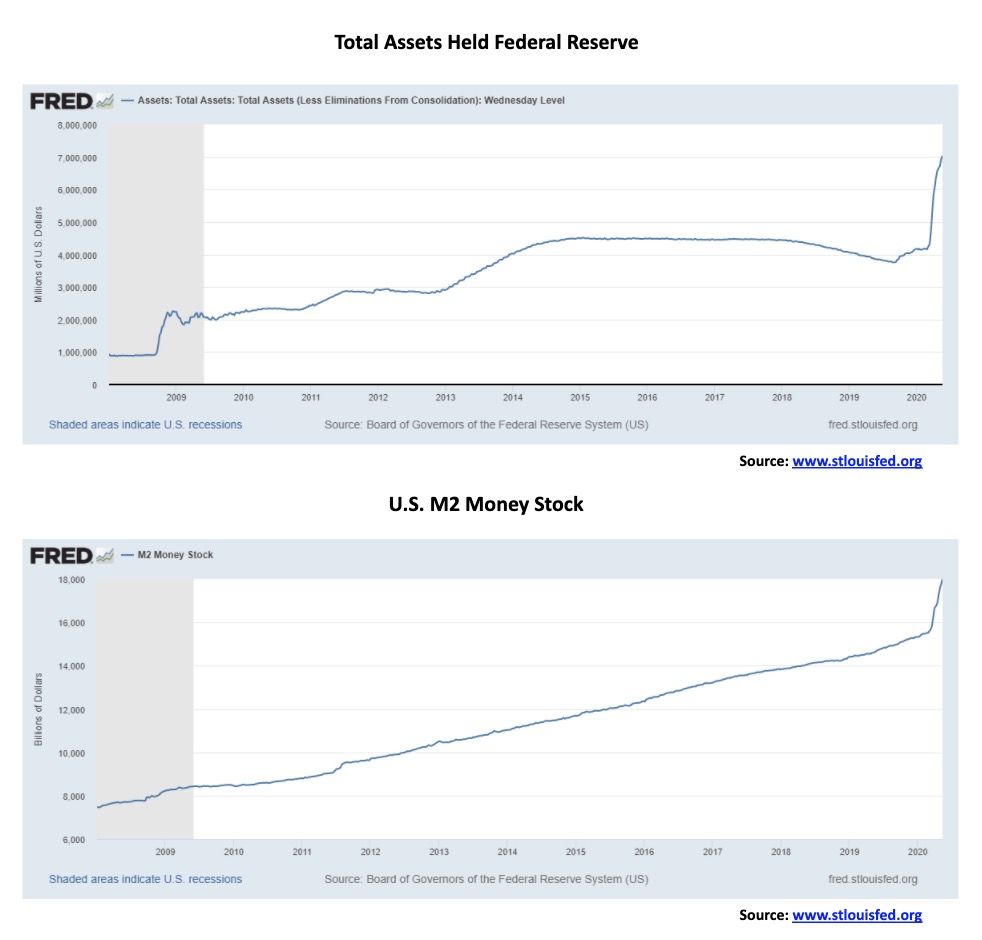
This says it all as to why the stock market has soared from the March 23 lows: a veritable explosion in Fed assets and M2 Money Stock.
Since March 2, 2020:
- Fed Assets – up $2,796 billion or 66%
- M2 Money Stock – up $2,393 billion or 15%
- S&P 500 – up 718 points since March 23, 2020 or 32%. But if we count from March 2, 2020 the S&P is actually down 135 points or over 4%. No wonder the 3,000/3,100 level is resistance for the S&P 500.
Maybe they are going to have to throw a lot more money at the market.
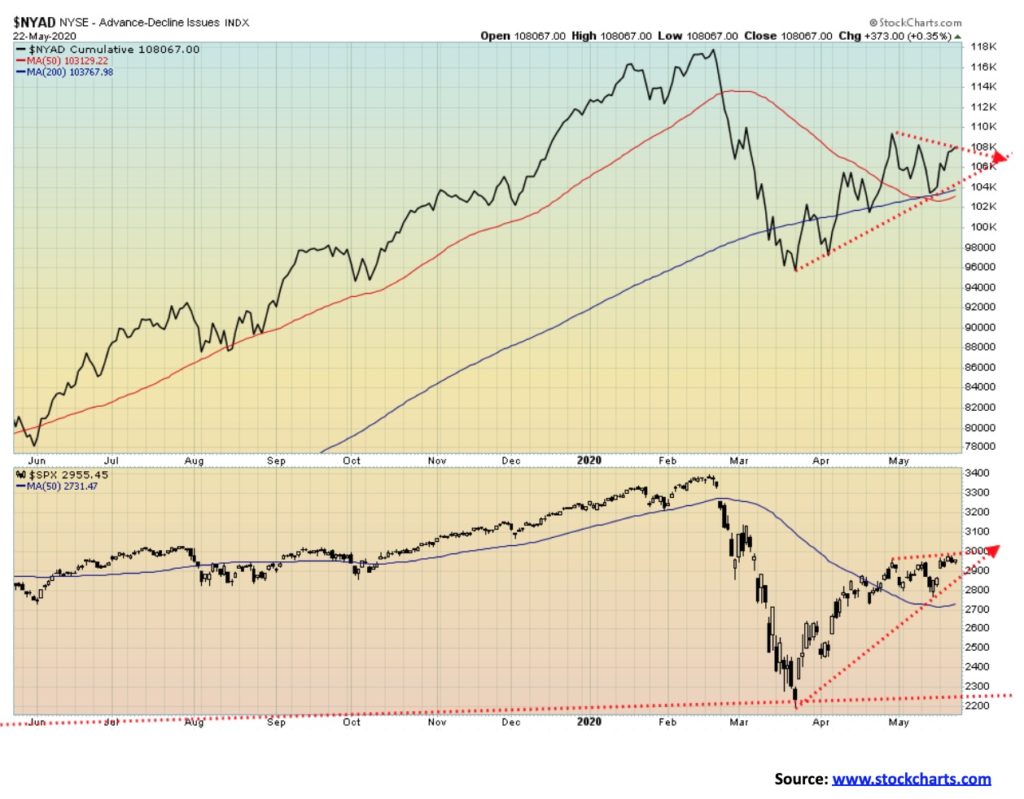
It is the bulls’ great hope but is it starting to diverge. The NYSE advance decline line did not make new highs this past week along with the S&P 500. It is not conclusive as the market has not yet fallen, but usually when we see these divergences they signal a potential trend change. At the moment all we can do is note the divergence, but it is not yet conclusive that the market is due for a fall.
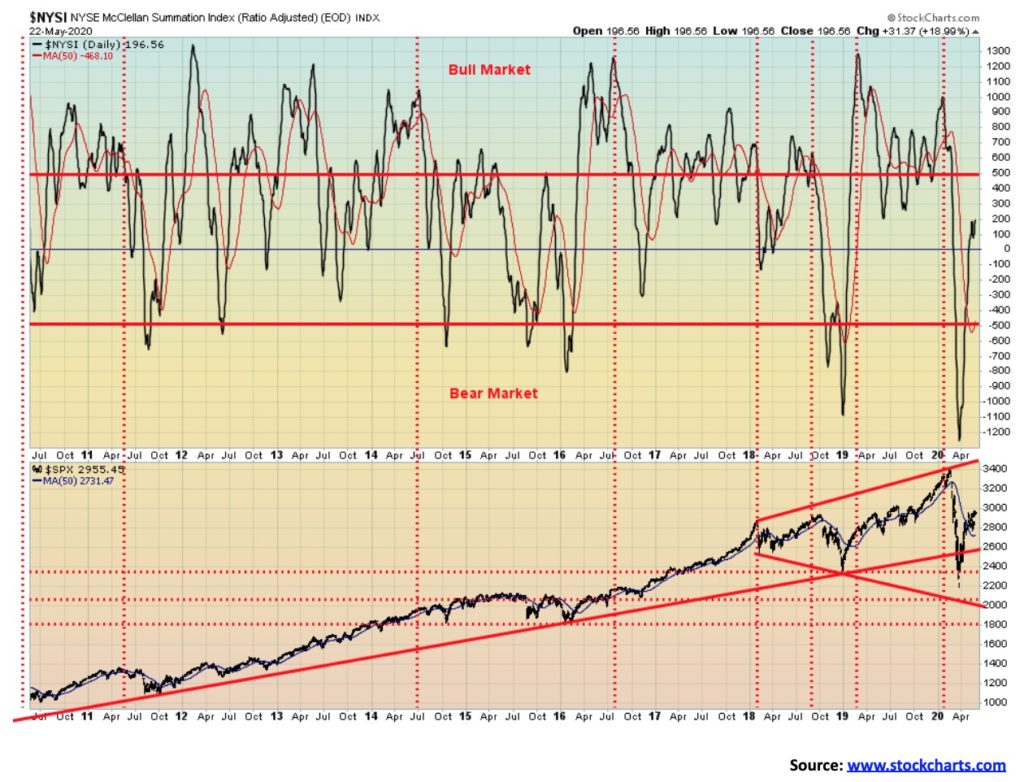
The McLellan Summation Index (ratio-adjusted), known as the RASI, continues in neutral territory. It has improved from the past couple of weeks when it was around 100 and is now at 200. But it remains below the 500 level usually associated with a bull market. That is despite the 30% bull run since the low in March 2020. We note that when the RASI exceeds 500 the best part of the bull move usually gets underway.
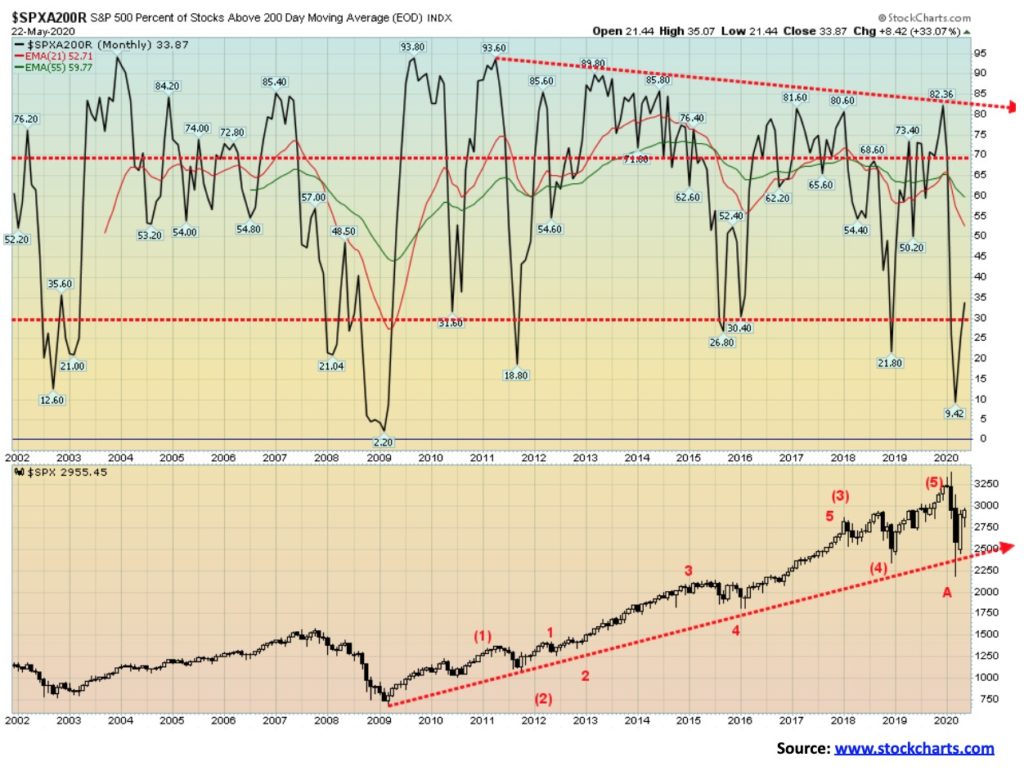
The percentage of stocks above their 200-day MA for the S&P 500 continues to languish, reaching to 34% this past week. We note that the S&P 500 itself remains below its 200-day MA so it is no surprise that the majority of stocks are also below their 200-day MA. As we note below, the rally is being led by the FAANGs so if your name is not Facebook, Apple, Amazon, Netflix, or Google then you are probably trading sub-200-day MA. This is not a bullish chart.
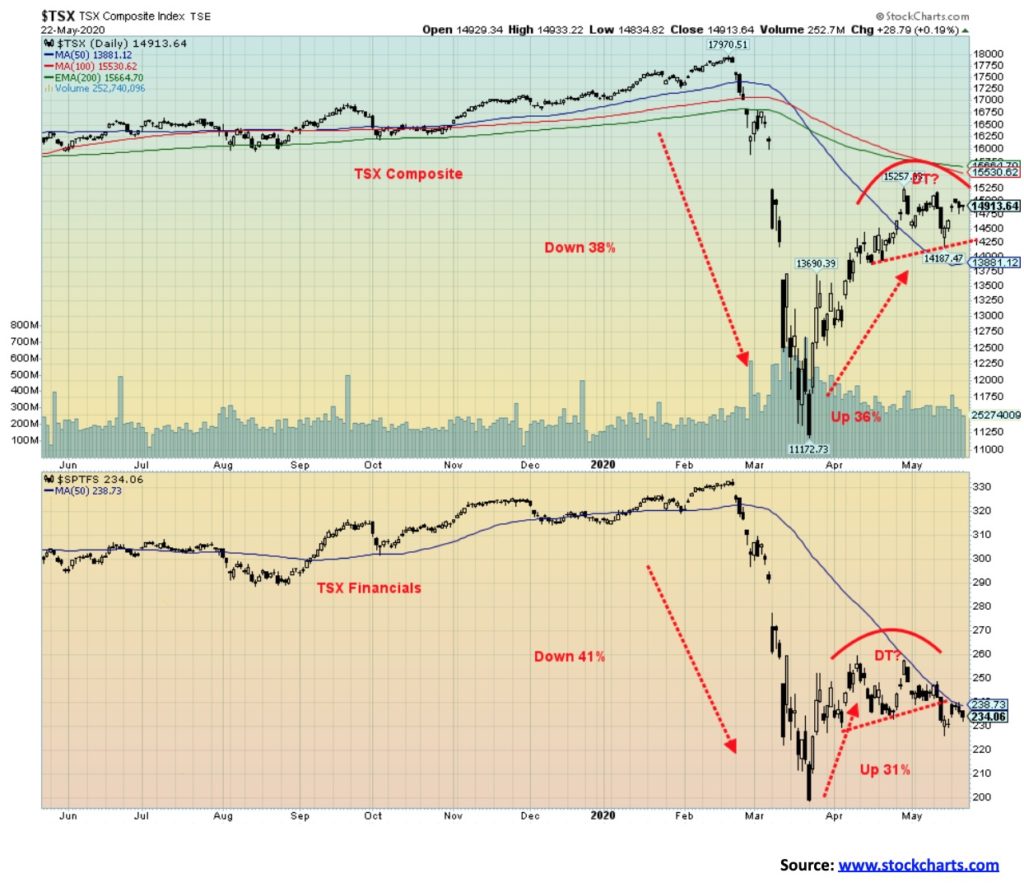
The TSX Financials (TFS) continue to look weak. The banks are laden with a growing portfolio of bad loans. We do have to wait to see, however, how much they are going to have to provide for loan loss provisions going forward. The number could be large. The TFS is down 25.8% on the year. But it is not the worst performer. That honour belongs to Energy (TEN), down 45.8% in 2020. This past week the TSX eked out a 1.9% gain, but the action on Friday suggests that the index is rolling over. A firm break of 14,250 could suggest a decline to 12,860. Interim support would be seen at 13,690 and 12,500. After falling 38%, the TSX has rebounded at least 36%. But now everyone is getting bullish again believing the market is in the process of rising to the February highs and possibly even higher. The TSX remains well below its 200-day MA currently at 15,665. The TFS appears to have broken what may be a double top. It projects down to at least 207. That’s not new lows, but it is a good test of the lows if it holds.
Overall, it was a good week for the TSX and its sub-indices. Eleven of the fourteen sub-indices were up on the week. The big loser was Golds (TGD), down 5.1% as it appears poised for a pause. However, the TGD remains the best performing on the year, up 34.6%. The other losers were Materials (TMT), off 2.1% and Telecommunications (TTS), down 0.4% on the week. The big winner on the week was Energy (TEN) up 7.1% but Consumer Discretionary (TCD) also enjoyed a good up week in anticipation of lifting of the lockdown gaining 5.8%, Industrials (TIN) was up 4.2% while Information Technology (TTK) continued its hot run, up 5.9%. Financials did gain 1.4%, but with the potential for loan losses at the banks the rollover at the end of week may extend into the coming week.
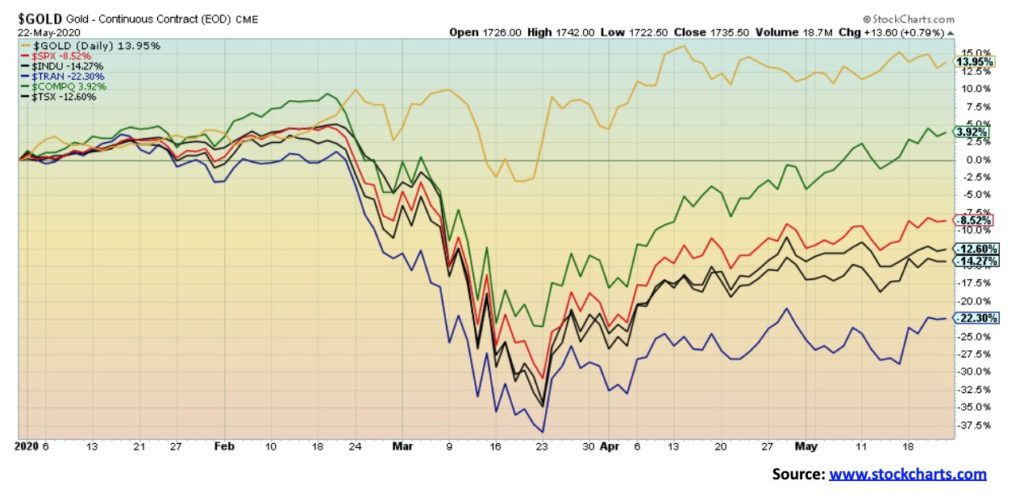
So far, gold is the winner in 2020, up about 14%. The only index up is the tech-laden NASDAQ with a gain of 3.5%. All the other indices are in the hole with the Dow Jones Transportations (DJT) leading the way, down 22.3%. The Dow Jones Industrials (DJI) is down 14.3% in 2020 and the S&P 500 is down 8.5%. The TSX is down 12.6%. Gold is the sanctuary in times of troubles.
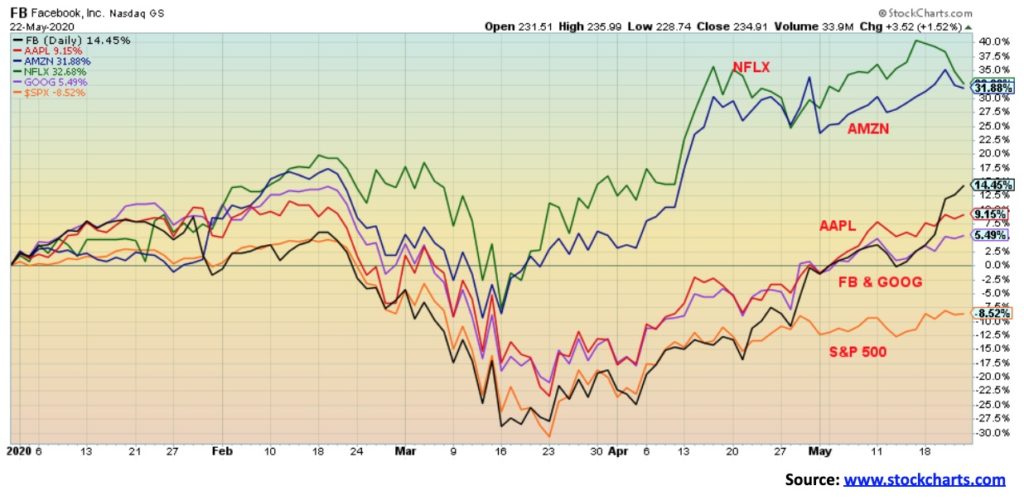
This is just to re-emphasize that the rally since the March lows has been largely on the backs of five stocks, the FAANGs: Facebook, Apple, Amazon, Netflix, and Google (Alphabet). The S&P 500 is still in the hole, down 8.5% but Facebook is up 14.5%, Apple up 9.2%, Amazon up 31.1%, Netflix up 32.6%, and Google up 5.5%. The FAANGs make up some 20% of the S&P 500. Doesn’t say much for the rest. All to some extent are actually benefitting from the global pandemic shutdown. More online business is being done (Amazon), people have more time on their hands so they are on Facebook more often and watching more movies (Netflix – who have signed up thousands of new customers), while Google and Apple are benefitting from the move for more people working home. Microsoft (MSFT) has also done well in 2020, up 17%. It is no surprise that technology stocks have been one of the best performers so far in 2020 and should continue to drive the market.
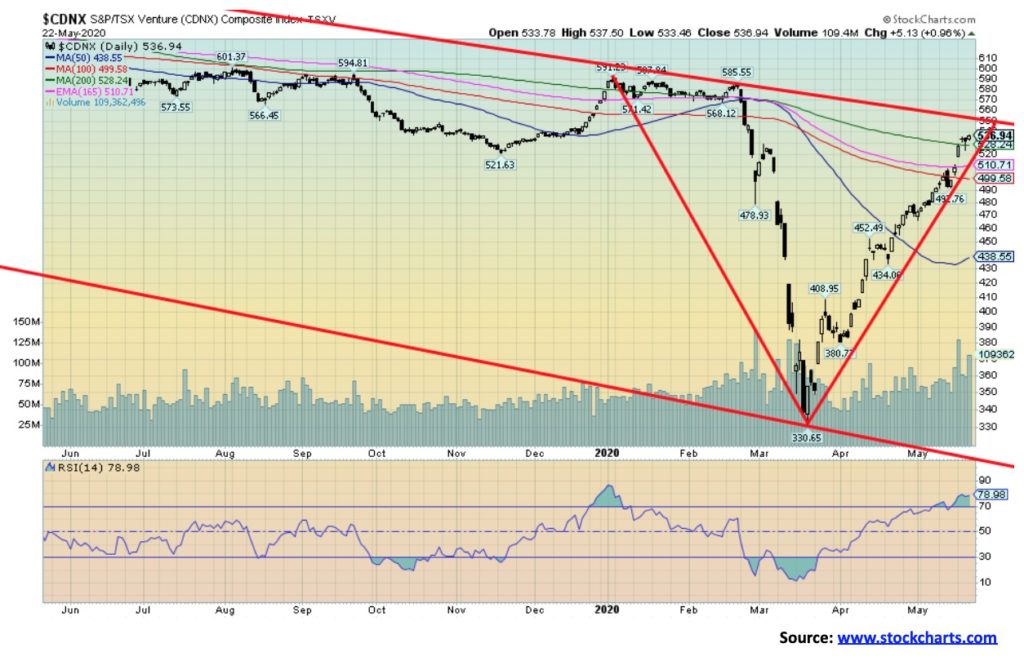
We have to note the fabulous rebound of the TSX Venture Exchange (CDNX), now up over 60% from the March lows in a classic V recovery. The CDNX is 50% or more junior mining stocks, primarily gold. There have been numerous examples of some junior gold miners doubling and even tripling already from their lows. If the market keeps going higher, then we could have ten baggers or even more for some junior mining stocks. But right now, we are running into resistance of the 200-day MA currently at 528 and further resistance up to 600 from the highs seen in January/February 2020 before the collapse. A firm breakout over 600 could project the CDNX up to at least 850. That would be a 160% gain from the March 2020 lows. The CDNX has long history of sharp up moves of 200% or more and equally horrendous collapses of 80%. But right now, we wouldn’t be surprised to see a pause. Volume has been good and we are aware of instances of hedge funds and other funds buying the junior miners. When the big money is coming in, we usually have a good bull market that lasts for a year or longer.
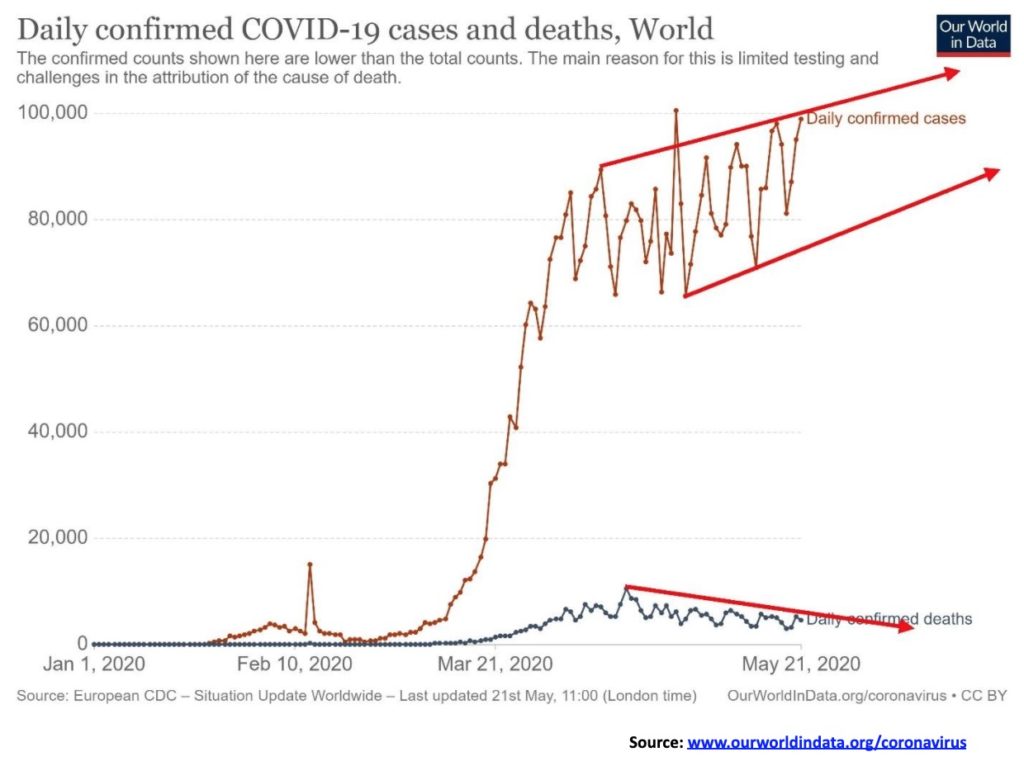
The number of cases globally continues to rise. May 22 saw a record number of cases at over 107 thousand. The push is not coming from the leader U.S.A, but instead from Russia and Brazil. Cases in Russia and Brazil have soared and both are now in the #2 and #3 spot, supplanting Spain and the U.K. and prior to that Italy. Meanwhile, the number of deaths does seem to be on a dowward path. Globally, the number of cases now exceeds 5.4 million and the number of deaths is approaching 350,000. Both numbers are most likely understated given the difficulties seen in many emerging economies where poverty and crowded conditions most likely make it difficult to track cases and deaths. It is ironic that the highest number of cases is coming from three countries where the leader (President) has been either dismissive of the coronavirus, is disinterested, or has called it a hoax. Assuming the current pace of cases and deaths were to continue by year end, the number of cases could approach 25 million while the number of deaths could be over one million. More than anything, the fate of the global economy rests on finding a vaccine.
COVID-19 Coronavirus Pandemic Sunday May 24, 2020 15:13 GMT
# Cases – 5,438,511
# Deaths – 344,585
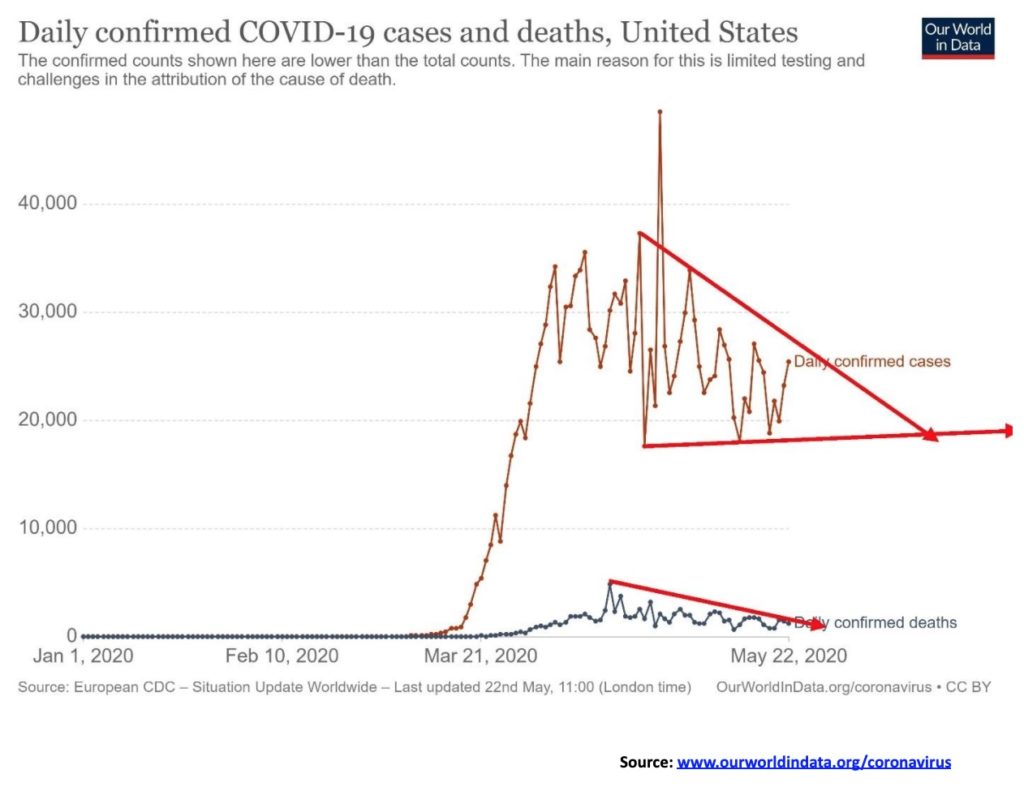
The number of cases in the U.S. continues to decline on a downward trajectory. Could it be a descending triangle given the series of lower highs and a relatively flat series of lows? The number of cases in the U.S. now exceeds 1.6 million and the number of deaths is approaching 100,000. The number of cases is falling in nearly all the states but in a few that opened up their cases are rising, although slowly. Anyway, the downward trajectory is welcomed, we’re sure, to bring back some semblance of normalcy.
COVID-19 Coronavirus Pandemic Sunday May 24, 2020 15:13 GMT
# Cases – 1,670,402
# Deaths – 98,750
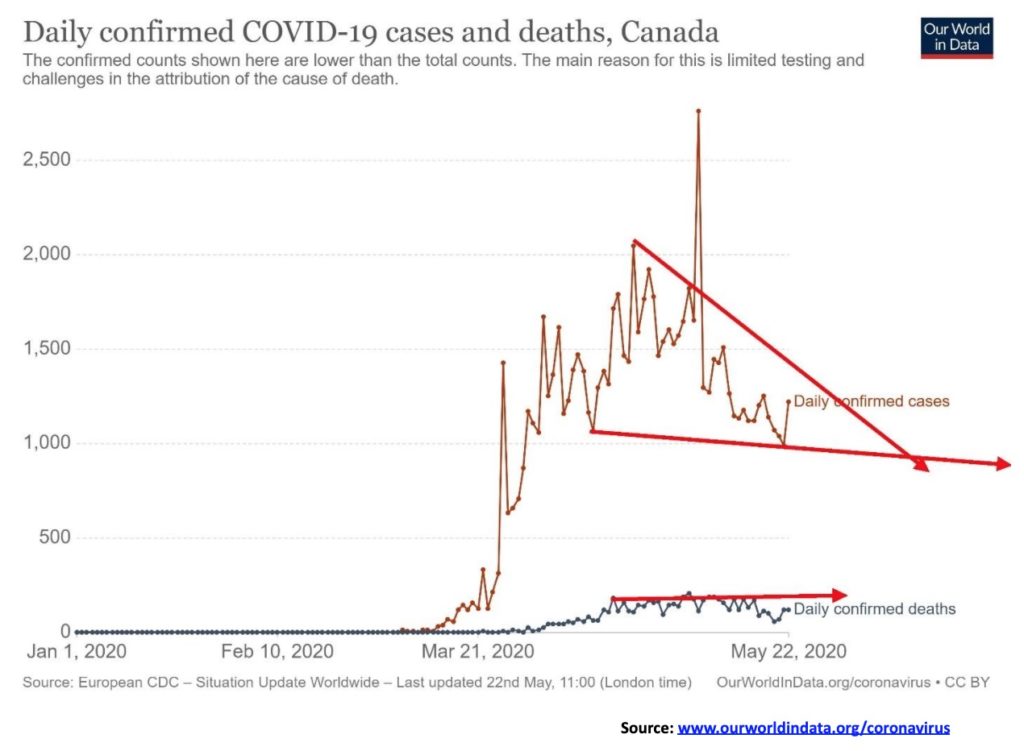
Canada, like the U.S., is on a downward trajectory. Or that could be a bull pennant and we will soon breakout to the upside? Given that many provinces are opening up, to close again may not be an option. Deaths have been rather flat but now appear to be falling.
COVID-19 Coronavirus Pandemic Sunday May 24, 2020 15:13 GMT
# Cases – 84,081
# Deaths – 6,380
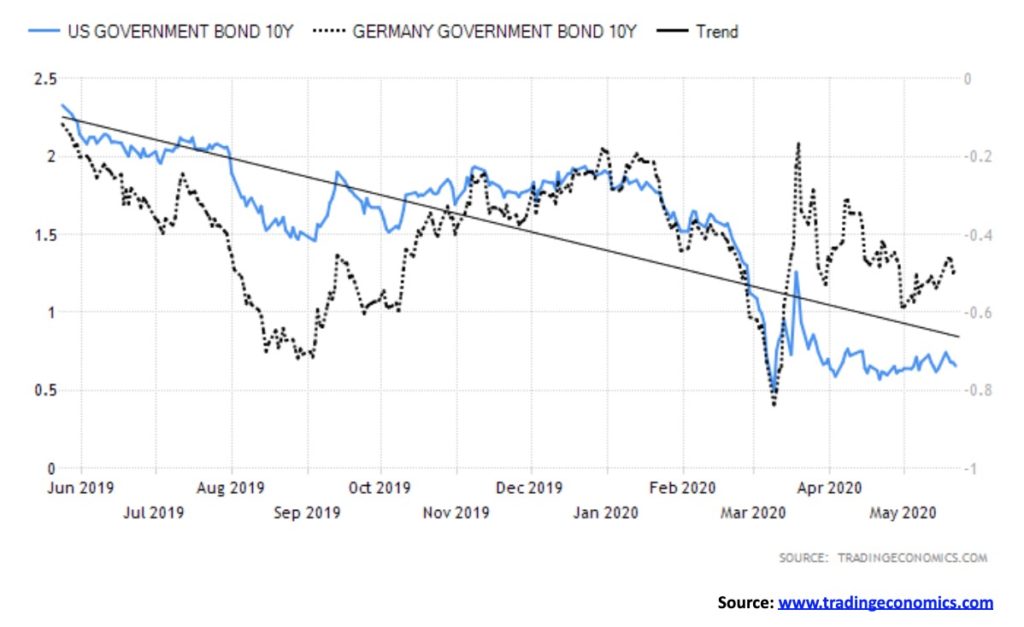
There was very little movement in bond yields this past week. The U.S. 10-year treasury note rose to 0.66% up from 0.64%. Canada’s 10-year Government of Canada bond (CGB) fell to 0.51% from 0.54%. We have overlaid on the U.S. 10-year the German 10-year bund. The left axis is the U.S. 10-year while the right axis is the German 10-year. The German 10-year bund is trading at negative 0.49% vs. negative 0.54% the previous week. The 10-year German bund has been trading below zero since May 2019. Negative rates have proven to be a trap for the EU as they can’t create any inflation and the negative yields are causing all sorts of dislocations with many trying to get around them and holding cash or gold instead. However, many are also trapped as they have to own government bonds and top-quality ones such as the German bund. Does anyone really want to hold Italian 10-year bonds even if they do pay 1.60%? As long as the central banks continue to buy bonds, government and corporate, that should continue to act as a damper on interest rates. Doesn’t mean that rates will fall further as the risk right now is a rise in rates, but the reality is we are probably going to be sub 1% for some time.
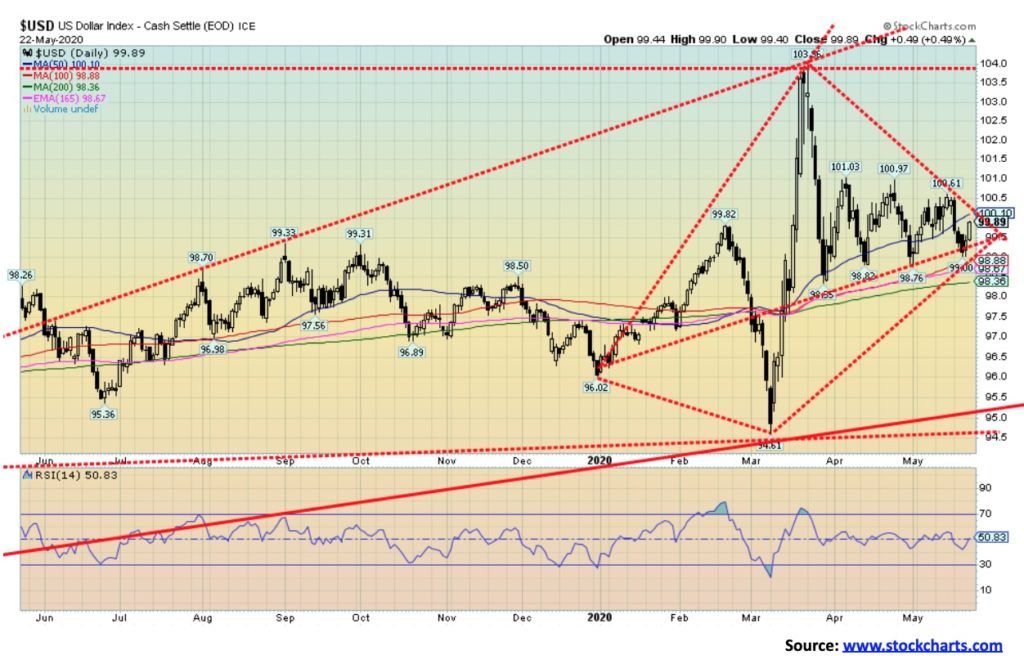
The US$ Index continues to form what may be a rare diamond pattern. Diamond patterns are seen only at tops. Over the past several weeks the US$ Index has been either in a sideways trading pattern or it could prove to be a small descending triangle as each peak was lower than the previous peak: 101.03, 100.97, and 100.61. The diamond pattern would be invalidated breaking out above 100.61 the previous high. A firm breakout above 101 would be confirmation and instead of falling the US$ Index would rise to challenge the highs of March 2020 at 103.96. International funds could be key if they were to stop investing in the U.S. stock market and buying U.S. bonds. Threats of another trade war with China could send the US$ Index lower.
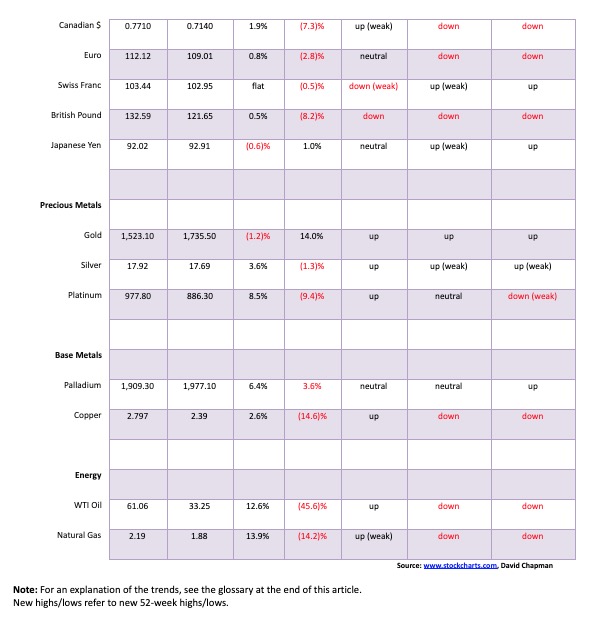
This past week the US$ Index fell 0.5%. The currencies were, for the most part, up with the euro gaining 0.8%, the Swiss franc up a tiny 0.03% so flat really, the pound sterling gaining 0.5%, but the Japanese yen falling 0.6%. The Canadian dollar was the best performer, gaining 1.9% to 71.40. The US$ Index has support down to about 98/98.25, but below 98 a breakdown could occur. The diamond pattern projects down to about 89. As noted, a breakout above 100.50 would start to invalidate the pattern and above 101 it would be completely invalidated.
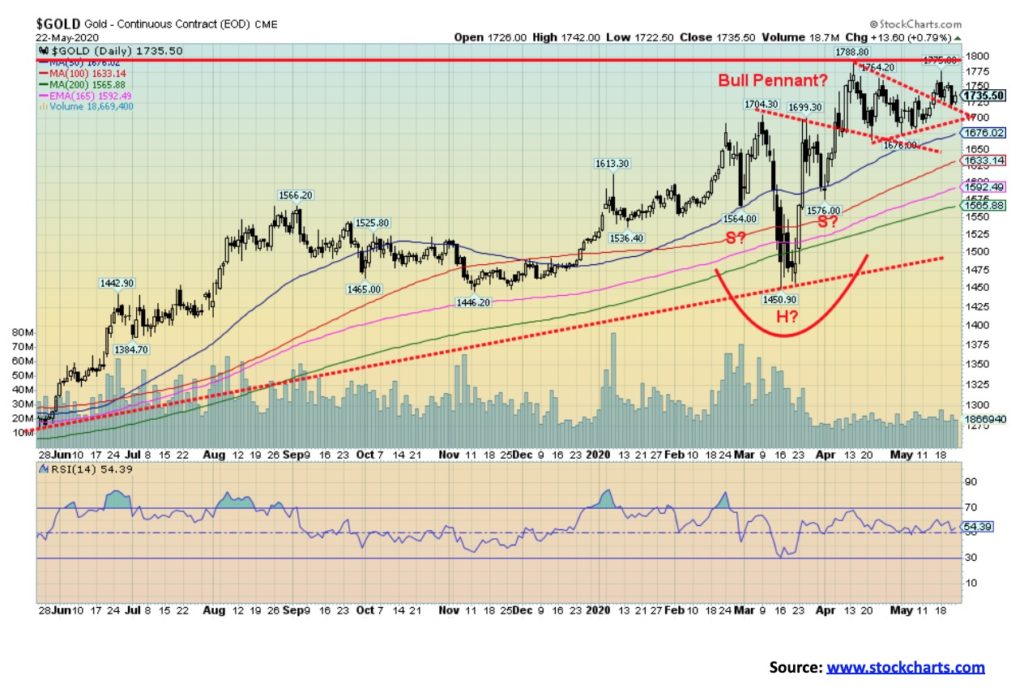
Gold made another attempt to reach $1,800 this past week and failed. Gold hit a high of $1,755 on May 18 before fading and closing this week at $1,735 down 1.2% on the week. That made it a reversal week with a slightly higher high (but not a new overall high) and a lower close. It leaves a potential double top on the charts with the other high coming in at $1,789 on April 14. Gold remains in a seasonal weak period that could extend into July. That doesn’t mean that it can’t go higher. We recall 2016 when gold did pull back into April/May only to regroup and run to new highs in July. But the seasonals tend to favour weakness. If it is a double top then the neckline is currently at $1,695 and could project down to $1,580/$1,585. The 200-day MA is currently at $1,565.
Gold was the only one of the metals to put in a down week, diverging with the others. Silver gained 3.6%, platinum was up 8.5%, and of the industrial metals that we follow that have some precious metals qualities palladium gained 6.4% and copper was up 2.6%. The gold miners diverged as both the TSX Gold Index (TGD) and the Gold Bugs Index (HUI) fell on the week possibly leading the metals. So, the reversal and the divergences have us a bit cautious going into the coming holiday-shortened week. No, we don’t believe the rally is finished yet. The possible head and shoulders bottom pattern does project up to $1,935/$1,950, but first we need to clear resistance at $1,800. The 2012 high was at $1,798, so going in we knew that level would most likely meet with resistance.
If we fail to break through $1,800 then the bull pennant that appeared to form would be invalidated and we would be looking for a new pattern. The pennant formation projected up to $1,840/$1,845. The breakout failed to make any headway on the second day up as that was May 18. That was a negative sign. Gold would fail only if we were to break back under first $1,675, then under $1,575 and finally it would be terminal under $1,450 the March low. Gold, as we have noted in the past, has a somewhat consistent major cycle low roughly every 7.8 years, range 6–10 years. A significant low was seen in 1976. After that lows were seen in 1982 (6 years), 1993 (11 years but after the 1982 low and following a rebound a lower low was seen in 1985), 1999–2001 (6–8 years), 2008 (7 years), and 2015 (7 years). That puts the next 7.8-year cycle low anywhere from 2021 to 2025. The longer 23.8-year cycle low was seen last in 2001 and is next due 2024/2025. However, it could come in as early as 18 years (2019/2020). It is highly unlikely that the March 2020 low was it. We are not dismissing that wherever the current rally takes us it could be the final one before falling into the 7.8 year and 23.8-year cycle lows.
$1,800 is now key. For this rally to continue, we need to firmly break over that level. Gold has made new all-time highs in numerous currencies, including all the major currencies. We expect that gold will also make new all-time highs in U.S. dollars before this rally is over.
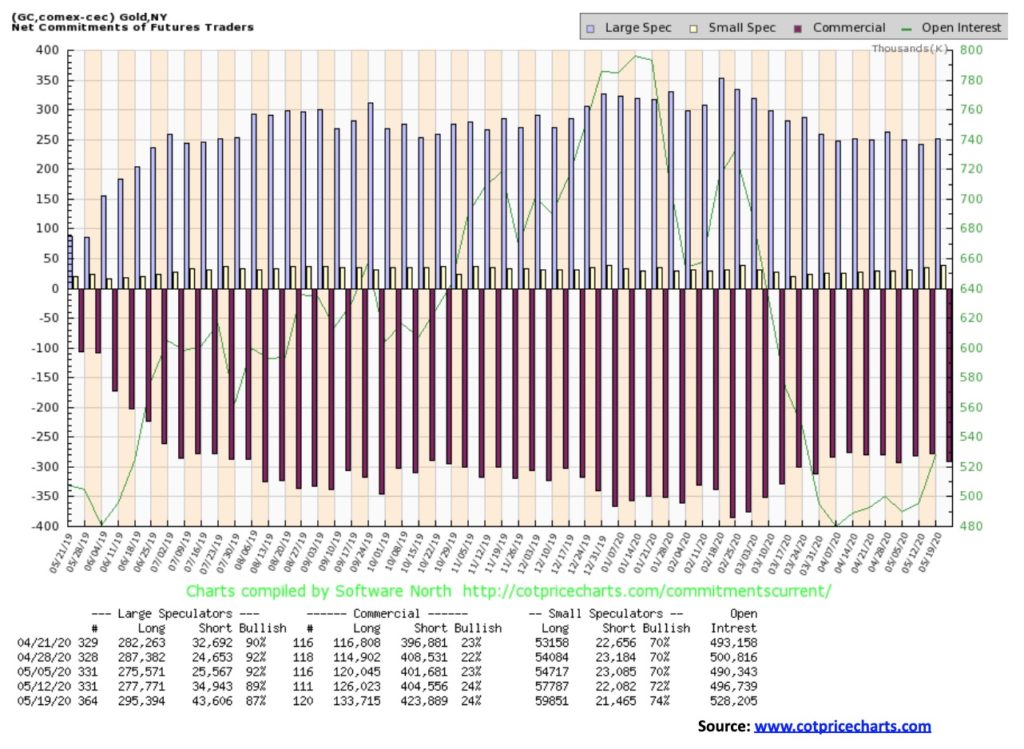
The gold commercial COT was steady this past week at 24%. Long open interest rose almost 8,000 contracts but short open interest was up over 19,000 contracts. The result is that the commercial COT remains somewhat bearish. The large speculators COT (hedge funds, managed futures, etc.) fell to 87% from 89% as their long open interest jumped almost 18,000 contracts but short open interest was also up about 9,000 contracts. The large speculators COT is down from 92%. Overall open interest rose roughly 31,000 contracts. The commercial COT has improved from lows of 22% seen four weeks ago. An improvement but not enough to end the overall bearishness.
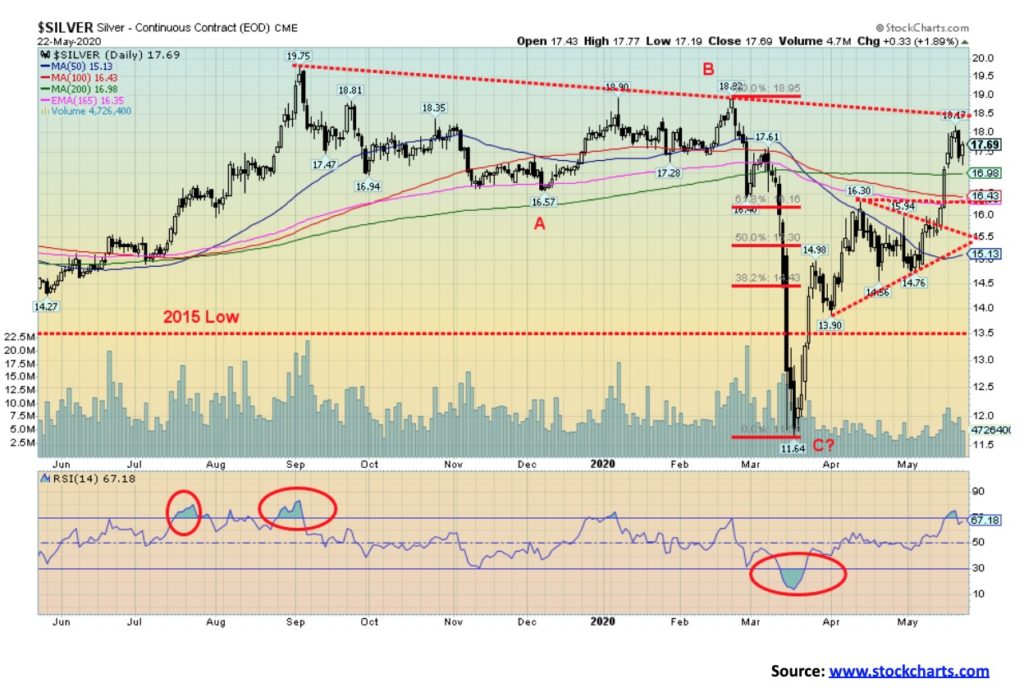
Silver had another good week, gaining 3.6% hitting a peak of $18.17 before pulling back sharply on Thursday. The sharp pullback on Thursday suggests to us that a temporary top may be in. We fell short of a significant break above $18.50. Regrouping here would not be the end of the world as the RSI had leaped above 70 into overbought territory. A pullback would also help take some of the bullish sentiment off. A pullback to $16.50 would not be out of the question and a normal correction would be for silver to pull back to $15.65 to $16.65. We’d become quite concerned if silver broke down under 15 and especially under $14.75. It’s terminal under $13.90. Despite the nice rise since the March low (up 52% as of Friday), the volume has not been huge compared to the huge volume on the downside break in March. That could be one reason we are optimistic that any pullback would be corrective in nature only as the market is just not that bullish—yet. We also remain vigilant to the fact that this past week gold and silver diverged with gold down and silver up. As well, the crash in March saw silver make multi-year lows, but gold did not. Conversely, the huge rally that preceded saw gold take out its 2013 and 2016 high and fall just shy of its 2012 high. Silver, on the other hand, failed to take out either its 2013 or 2016 high and is nowhere near its high of $37.38 seen in 2012.
As we have noted previously, silver appears to have a fairly consistent 7-year cycle (range 5–9 years). Starting in 1971 we observe key lows in 1976 (5 years), 1982 (6 years), 1993 (11 years, so outside the range, but the first low hit in 1991 and 1993 was the final low, only marginally below the 1991 low), 2001 (8 years), 2008 (7 years), 2015 (7 years), and now 2020 (5 years) assuming the March 2020 low was the 7-year low. In theory we are still in the 7-year low range of 2020–2024.
Even if we were to have a pullback, we expect we would not see a new low below $11.64 the March 2020 low.
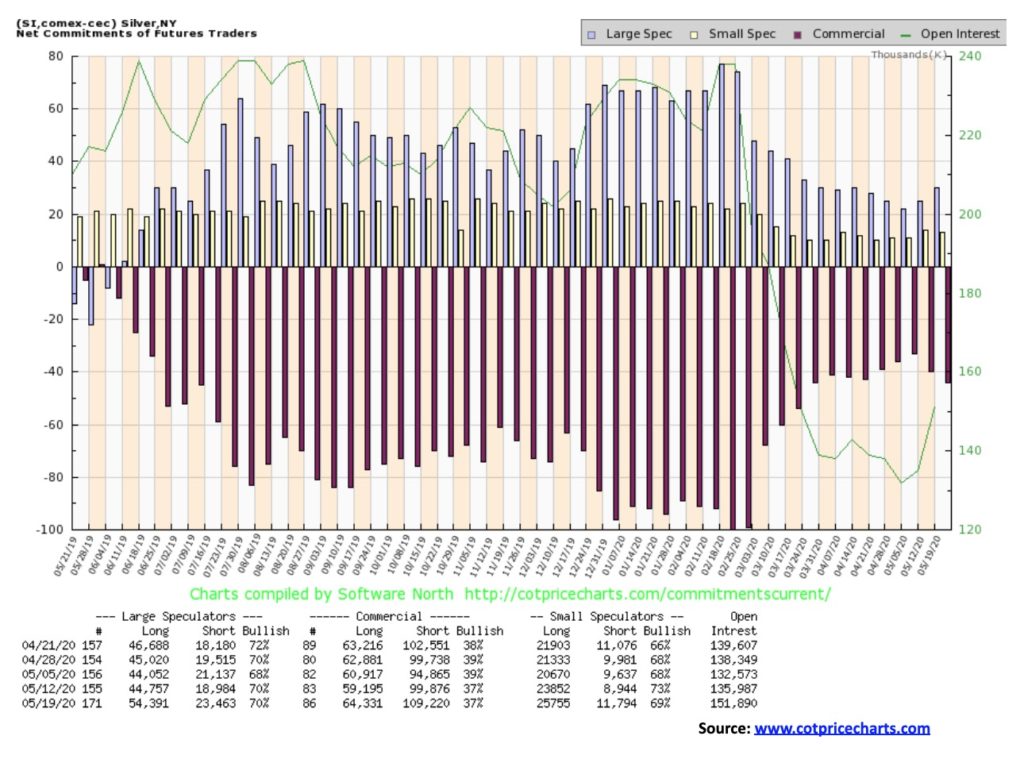
The silver commercial COT remained steady at 37% this past week. Short open interest jumped about 10,000 contracts but was offset by a rise of around 5,000 contracts by long open interest. The large speculators COT was also steady at 70%, but it too saw movement as long open interest was up almost 10,000 contracts and short open interest jumped about 5,000 contracts. Overall, open interest rose this past week by about 16,000 contracts. We view the silver COT as cautious.
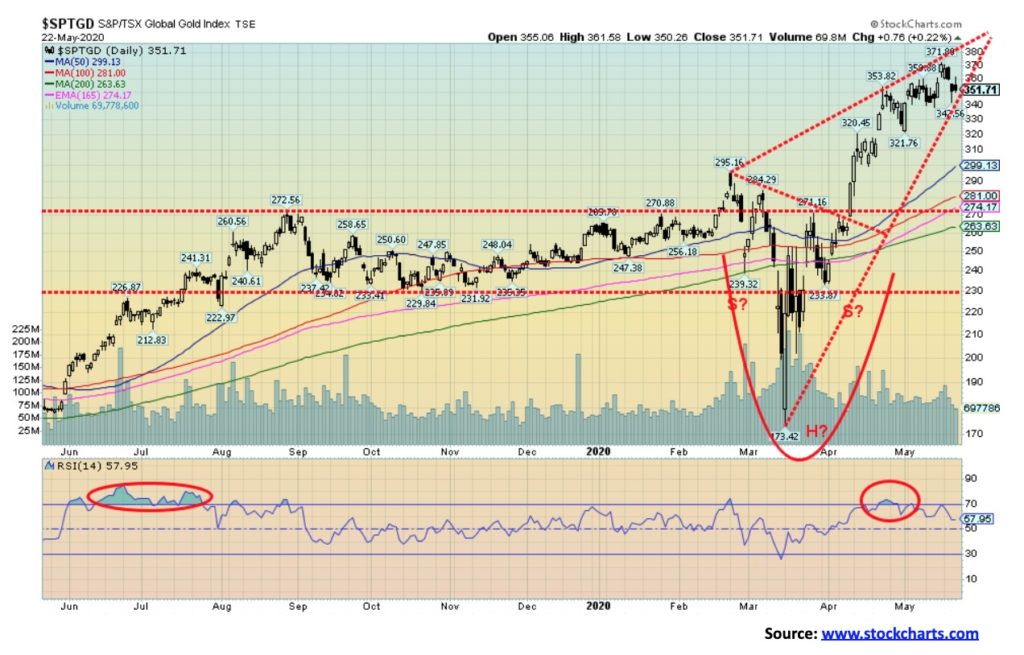
The gold miners indices diverged this past week. Both were down on the week with the TSX Gold Index (TGD) off 5.2% and the Gold Bugs Index (HUI) down 4.0%. The divergence came with the HUI making new 52-week highs but the TGD did not. Both remain up on the year with the TGD up 34.4% and the HUI up 17.9%. Both have firmly outperformed the broader stock market. But could we be seeing at least a temporary top? It is possible. The pattern that has formed eerily looks like an ascending wedge pattern which is bearish. At least short term. The break point that could be seen as early as Monday is at 345. However, before it breaks the TGD could make one more run to the head and shoulders bottom target at 388/390. The high so far is seen just under 372. The top of the channel on the ascending triangle is currently at 380, so if 388/390 is to be achieved the TGD would have to crawl up the triangle.
The TGD has achieved 85% of the target so far. Close but no cigar, as usually you want to see targets met. We are, however, now cognizant that a correction could set in. It is not the end of the world. Considerable support can be seen down to 265 and up to 300. A normal correction would be for a pullback to 295/300. Yes, that is a roughly 20% correction but it is not unusual for the sector. During the 2008–2011 bull run for gold and the gold miners the TGD had seven corrections of 15%–25%. Each correction tested the key MAs and even traded under them for more than a few days. But it was not sustained and the sector recovered to rally to new highs. However, corrections are endemic to the sector and one either sits through them or they can be successfully traded. The ascending wedge triangle suggests a fall to test those key MAs. We’d consider a correction fatal if it broke back under 260. Confirmation would come with a breakdown under 235. The action over the past week has pulled the bullish sentiment back just enough to give the gold miners impetus to rise again. But for the interim we’ll consider a break of 345 suggesting a corrective period is underway.
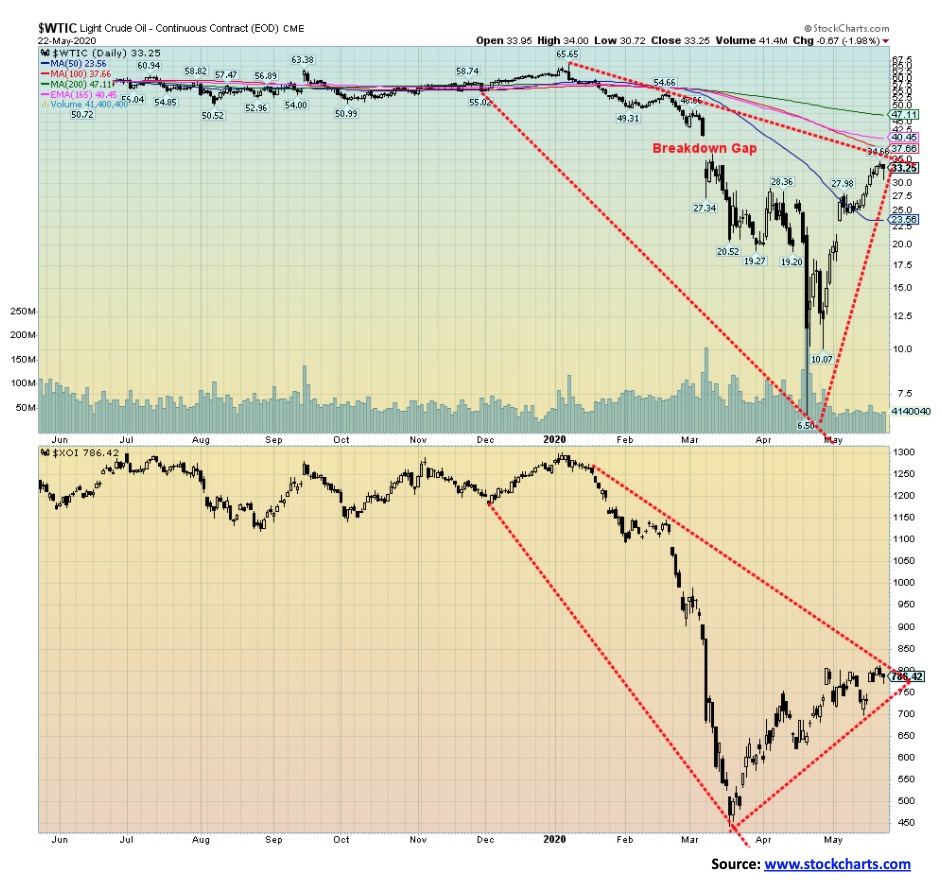
WTI oil has given meaning to the V recovery. The Arca Oil & Gas Index (XOI) has as well but it is not as clean as the WTI recovery. So, will it last? Are we headed back to $50 oil? The 200-day MA is currently up at $47 and a test of the 200-day MA in a bear market is not unusual. The glut has come down, and things are opening up again although don’t expect air travel to surge anytime soon.
On Friday, oil prices hesitated after learning that China is not going to set a growth target for 2020. China has innumerable problems coming out of the COVID-19 including the potential for some new clusters and now an army of unemployed people. The rescue package from the Chinese government was also considered tepid, especially when compared to the largesse in the EU and the U.S. China’s oil demand is back to about 90% of what it was. While China is a producer they don’t produce anywhere near enough and rely on imports. China is the world’s largest importer of oil. China primarily gets its oil from the Middle East, Saudi Arabia, Iran, Iraq, UAE, and elsewhere. They even get some from the U.S.
This past week WTI oil rose 12.6% and its still down 45.6% in 2020. Friday’s action saw oil fall about 2%, leaving what distinctly looks like a hanging man on the charts. A hanging man is a Japanese candlestick signal whereby the market opens, plunges, and then rallies back, leaving a small body at the top (the head). A hanging man pattern is seen only at tops. The opposite is a hammer seen at bottoms. Naturally, the signal only works if there is follow-through to the downside, but generally it is an excellent sign of a pending top.
The previous day WTI oil left what appears to be an evening star on the charts. The evening star is another Japanese candlestick pattern, again usually seen only at tops. The evening star is usually a small body where the open and close may be the same or at least close together. It is usually preceded by a good up day and followed by a good down day, leaving a small body at the top (the star). The counter to it is the morning star seen at bottoms, again similar but at bottoms only.
So there is a good chance we have seen a top, but downside follow-through is needed. Natural gas also enjoyed a good up week, gaining 13.9% but remains down 14.2% on the year. The energy stocks had a good up week as well with the XOI gaining 7.4% and the TSX Energy Index (TEN) up 7.1%. However, both remain sharply down on the year with the XOI off 38.1% and the TEN down 45.8%.
The North American economies didn’t really benefit from the low oil prices as demand fell sharply, given that driving was down and airlines grounded and the oil & gas sector was in chaos with stressed out companies and bankruptcies and in the U.S. shale industry defaults. That in turn puts stress on the banks as loan losses rise.
Oil rose to just below the 100-day MA. Support is now down at the 50-day MA near $23.50. The rally would be considered over and done with a break under $22.50. The XOI breaks down under 680 and the TEN under 68 and especially under 64. Expect profit-taking on longs.
—
(Featured image by StockSnap via Pixabay)
DISCLAIMER: This article was written by a third party contributor and does not reflect the opinion of Born2Invest, its management, staff or its associates. Please review our disclaimer for more information.
This article may include forward-looking statements. These forward-looking statements generally are identified by the words “believe,” “project,” “estimate,” “become,” “plan,” “will,” and similar expressions. These forward-looking statements involve known and unknown risks as well as uncertainties, including those discussed in the following cautionary statements and elsewhere in this article and on this site. Although the Company may believe that its expectations are based on reasonable assumptions, the actual results that the Company may achieve may differ materially from any forward-looking statements, which reflect the opinions of the management of the Company only as of the date hereof. Additionally, please make sure to read these important disclosures


The TopRanked.io Weekly Digest: What’s Hot in Affiliate Marketing [uMobix Affiliate Program Review]
Right now, the internet's freaking the eff out about YouTube cracking down on "inauthentic" and "mass produced" videos (i.e., AI...


Bitcoin Traders Bet on $140,000: Massive Bets until September
Bitcoin hit a record high above $112,000, with traders eyeing $140,000 by September. Deribit call options worth $868 million signal...


BLS Secures 500 Million Dirhams to Drive Morocco’s Next-Gen Logistics Expansion
BLS raised 500 million dirhams via a private bond issue to fund a 2 billion dirham investment plan, aiming to...


Italy’s Electric Cars Market Rebounds, but 2030 Targets Remain Elusive
In 2024, electric vehicle (EV) sales declined in Europe and Italy, but 2025 shows strong recovery: +21.9% in Europe and...


Switzerland Advances Cannabis Legalization with Public Health Focus
Switzerland is moving toward cannabis legalization with a public health-focused bill. Adults could buy certified marijuana from licensed outlets, grow...
 |
|
 |  |
 |
|
-
 Markets6 days ago
The Big Beautiful Bill: Market Highs Mask Debt and Divergence
-

 Markets4 days ago
A Chaotic, But Good Stock Market Halfway Through 2025
-

 Cannabis2 weeks ago
Cannabis Clubs Approved in Hesse as Youth Interest in Cannabis Declines
-

 Crowdfunding6 days ago
World4All, a Startup that Makes Tourism Accessible, Surpasses Minimum Goal in Its Crowdfunding Round