Featured
US stock market looks rosy or just the calm before the storm?
The US stock market seems to be steady right now, but the possibility of a trade war with China and the Facebook controversy are driving its volatility.
Volatility has become the name of the game. As Lloyd Blankfein notes, just as you think everything is under control something erupts. It was always hubris and complacency to think that nothing was going to happen to the markets as they climbed relentlessly higher, seemingly oblivious to the potential “dark clouds” gathering around. But threats of trade wars, rising debt, global geopolitical tensions, chaos and turnover in the White House, and gathering storms around the U.S. President all eventually do take a toll. The global economy still looks strong with steady, if unspectacular, growth; low unemployment (at least, the officially reported unemployment); relatively strong consumer confidence; tax cuts (in the U.S.); and continued recovery in the housing market—all this is contributing to a somewhat rosy outlook.
But since the stock markets topped back in late January 2018, the markets have been anything but calmly rising. Instead, the markets have been punctuated with sharp ups and especially downs. This past week alone saw a 600+ point rise for the Dow Jones Industrials (DJI) followed immediately by a 300+ point decline. The previous week saw the DJI shed over 1,100 points in two days. The threat of trade wars, the Facebook (FB/NYSE) debacle, and the mind-numbing turnover in the White House all contributed to volatility and decline. The markets barely mentioned geopolitical tensions with Russia, the circling Mueller investigation, and the growing scandal sheet on the U.S. President’s peccadillos. All of the volatility makes one wish for the elation over the tax cuts that helped propel the markets higher—ignoring, of course, the growing debt problem as the tax cuts are estimated to add $1.5 trillion to the U.S. deficit over the next decade. As well, trillion-dollar budget deficits could soon be de rigueur once again.
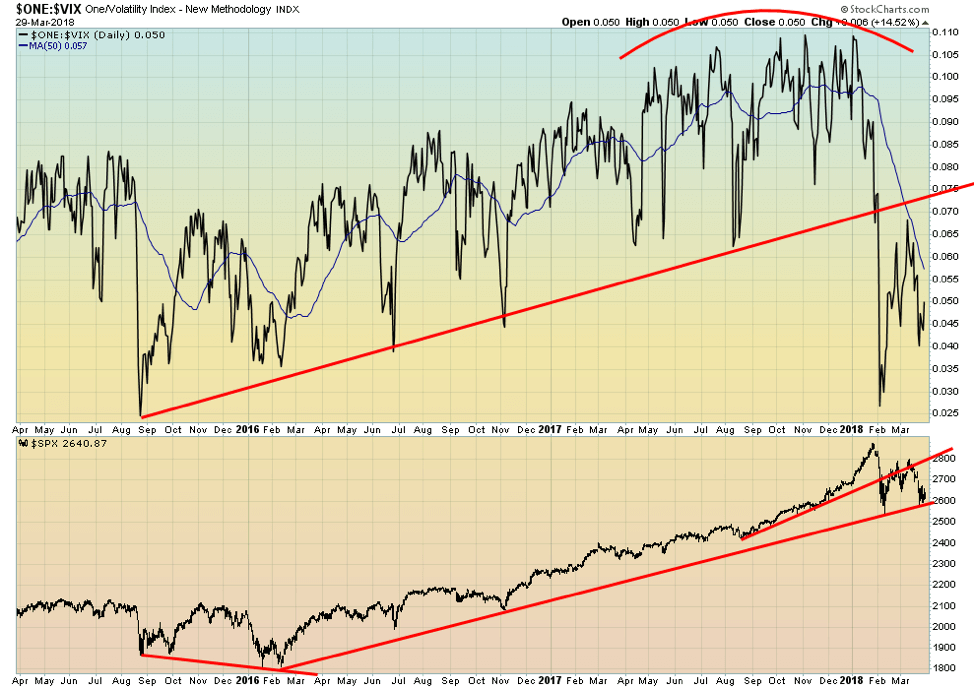
Our chart below is an inverted volatility index (VIX). Normally, the VIX is shown as moving opposite to the market. As the stock market rises, the VIX falls and vice versa. The inverted version lines the two of them up nicely, so divergences stand out. Note how the February 2016 stock market low was below the August 2015 low. But the VIX, instead of making new lows, was making a higher low. This divergence was a strong clue that the market could rise from there as volatility had fallen.
Despite pullbacks on the S&P 500, even as the market moved higher, the VIX kept rising in a series of rising lows as well. Then from about May 2017 onwards, the S&P 500 started rising sharply, but the VIX, despite many attempts, did not follow; instead, it made a series of only slightly higher highs. This was another significant divergence telling us that despite the sharp rise in the stock market, the VIX’s upward momentum was actually easing.
© David Chapman
Given the sharp rise in the stock market against the backdrop of declining volatility, it was expected the next move could be a sharp rise in volatility. Sure enough, the market collapsed in late January or early February 2018, and volatility (VIX) fell sharply along with the market. Now, volatility has eased even as the stock market has tested the February 2018 low. While the S&P 500 has not made new lows, it did make a new low close. The VIX could be diverging here once again with the stock market. If that is the case, our expectations are the market could soon rise once again. But don’t expect to see the VIX make new highs even if the S&P 500 does. Volatility has increased, and we expect it to remain that way going forward.
The week that was
This past week was much quieter in a lot of respects than the previous one. Maybe it has something to do with Easter weekend, and everyone has calmed down just a little. The President’s peccadillos stayed firmly in the news as the Stormy Daniels “60 minutes” interview drew a huge viewing audience. Behind the scenes, the court maneuverings continued as this case plus the other outstanding cases of accusations from women against the President could present a more dangerous situation for him than the Mueller investigation. They could drag him into court where he would have to testify under oath. A court has ruled he can’t declare himself exempt from testifying. He and his Twitter account have been strangely quiet concerning Stormy Daniels and the other women.
The comings and goings in the White House continue. Veterans Affairs Secretary David Shulkin is out, and Trump’s personal physician Rear Admiral Dr. Ronny Jackson is in. This should be interesting as Veterans Affairs is an organization with over 377,000 employees, managing a budget in excess of $180 billion. Jackson has no experience running a large organization. Jackson has to be approved by the Senate.
Communications director Hope Hicks finally left, and it is rumored that Trump’s Chief of Staff John Kelly is next. It is being suggested Trump can be his own communications director and Chief of Staff, and that could add even more confusion and chaos in the White House.
The west and Russia continued their tit-for-tat expulsion of diplomats over the poisoning of the double agent in Salisbury, England. A number of NATO countries and the United Nations expelled Russian diplomats, and the U.S. closed down the Seattle consulate. Russia retaliated by expelling 160 diplomats from the same countries and closed down the U.S. consulate in St. Petersburg. None of this appears to be having any impact on the markets. But it is a clear sign of heightened geopolitical tensions, tensions that could at some point negatively impact markets.
The growing U.S. debt
The U.S. auctioned $294 billion of treasury bills, notes, and bonds this week. The split is $185 billion of treasury bills and $109 billion of notes and bonds. By any definition, this was a huge amount and above expectations. The need is to finance the $1.3 trillion budget and the $1.5 trillion tax cut. The amount is the largest since the financial crisis of 2008. Despite somewhat weak demand, the yield on the 10-year Treasury note actually fell this past week as volatility and weakness in the stock market translated into strength in the bond market. In stock market meltdowns, investors seek safer assets such as U.S. Treasury notes and bonds.
U.S. Treasury debt now sits at $21.05 trillion and has jumped $1.1 trillion since President Trump took office in January 2017. A jump of this magnitude happened only once before: at the height of the 2008–2009 financial crisis. An issuance of almost $300 billion in debt in one week is the equivalent of what the total debt was back in the days of former President John F. Kennedy, according to Goldcore. U.S. debt is increasing, parabolically it seems, yet the wrangling continues over the debt limit, which it is never really set but instead merely pushed down the road. The U.S. has already exceeded the most recent debt limit.
The question is, is this vast amount of debt a potential Achilles heel for not only the U.S. but also for the global economy? It represents nine percent of all global debt outstanding. Total U.S. debt (government, corporate, and consumer) stands at $69.8 trillion, which represents 30 percent of all global debt. Little wonder that many say it will never be repaid.
The key is, will there still be those that step up as buyers of U.S. debt? That is a question particularly for the Chinese, with Trump appearing to be set to start a trade war with them even as they are trying to negotiate some sort of compromise. As we have noted before, the Chinese owns $1.168 trillion of U.S. national debt. But that is down from a peak of over $1.3 trillion held back in 2013. Overall, China’s holdings of U.S. debt have declined over the past seven years although they have regained a bit over the past year. If a trade war escalates with China, the debt may become a bargaining tool. China has stated they are looking at “all options.”
As to the Chinese looking at “all options,” Bloomberg reported that “senior government officials in Beijing reviewing the nation’s foreign-exchange holdings have recommended slowing or halting purchases of U.S. Treasuries.” If the Chinese stops buying, others such as the BOJ or the BOE would have to step up. The Fed may even have to step up purchases even as they want to lighten their balance sheet.
© David Chapman
If trade between the U.S. and China contracts, then the latter would have fewer U.S. dollars to purchase U.S. Treasuries. China could then switch to other sovereigns. China does not seem put off at the thought of purchasing Russian debt, for example. China and Russia, unlike the U.S., have a sharply lower national debt to GDP ratios. The U.S.’s national debt to GDP ratio currently stands at 106 percent. China’s is 20.2 percent, and Russia is at 12.6 percent.
A beneficiary of the looming U.S. debt crisis could be gold, although one would never know it in looking at the sticky gold price of today. The U.S., of course, has the world’s largest reserves of gold at 8,133 metric tons. That represents 74.5 percent of the U.S.’s reserves. China, at least officially, holds 1,843 metric tons, and Russia holds 1,716 metric tons ranking them sixth and seventh in the world’s gold reserves holdings. But for Russia, it is only 16.6 percent of their reserves, and for China, it is a mere 2.3 percent. As an aside, Canada holds zero gold reserves having dumped all of theirs by January 2016, which eventually included all their holdings of gold coins of George V dated 1912–1914. Collectors eagerly snapped them up.
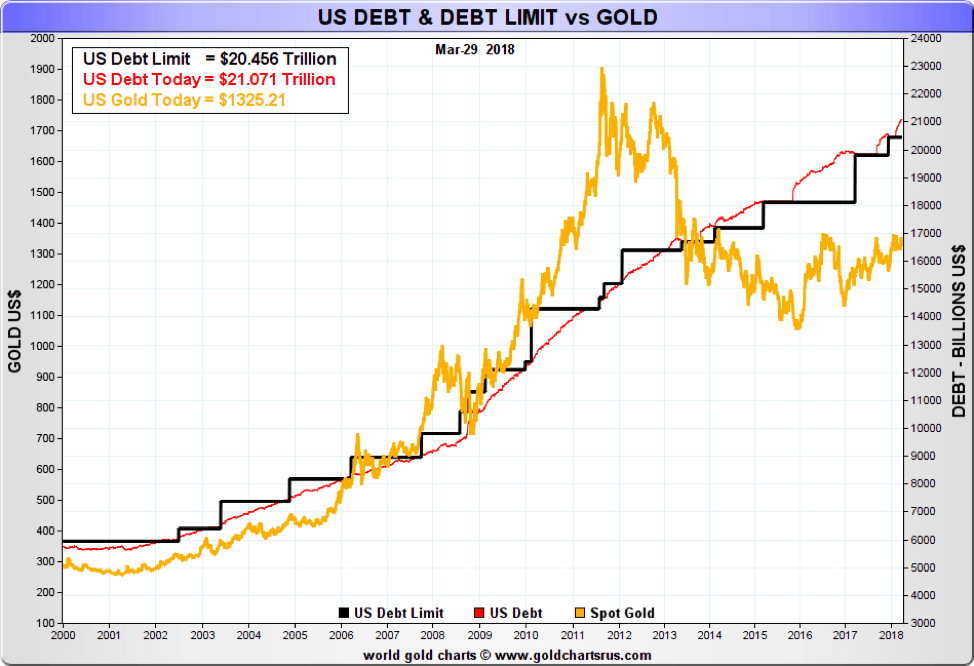
Our chart above from Nick Laird at Gold Charts ‘R’ Us shows the rise in gold prices corresponding to the rise of U.S. debt and its debt limit. This is not the first time we have shown this chart. The chart has proven popular with others as well. The gold price overshot the rise in the debt limit and debt into its top in September 2011. The last few years have seen the gold price lag the increase in the debt limit and the debt. Gold may be poised to catch up once again. Over the past few years, both Russia and China have increased their holdings of gold to back the Ruble and the Yuan, respectively. Given their low holdings as a percentage of their total reserves, it is expected that both will continue their purchases going forward as they aim to approach the U.S. in terms of its holdings. Even as others dump their gold, China and Russia would continue to snap it up.
Bitcoin watch!
© David Chapman
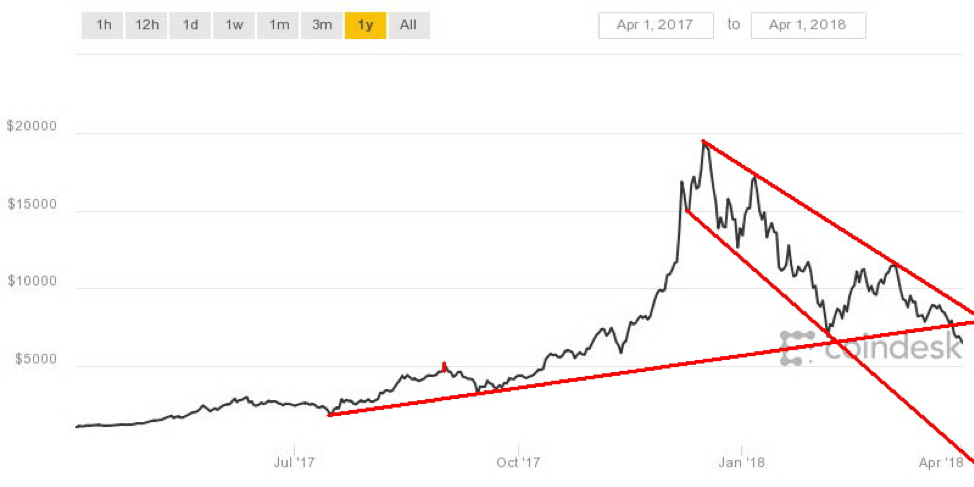
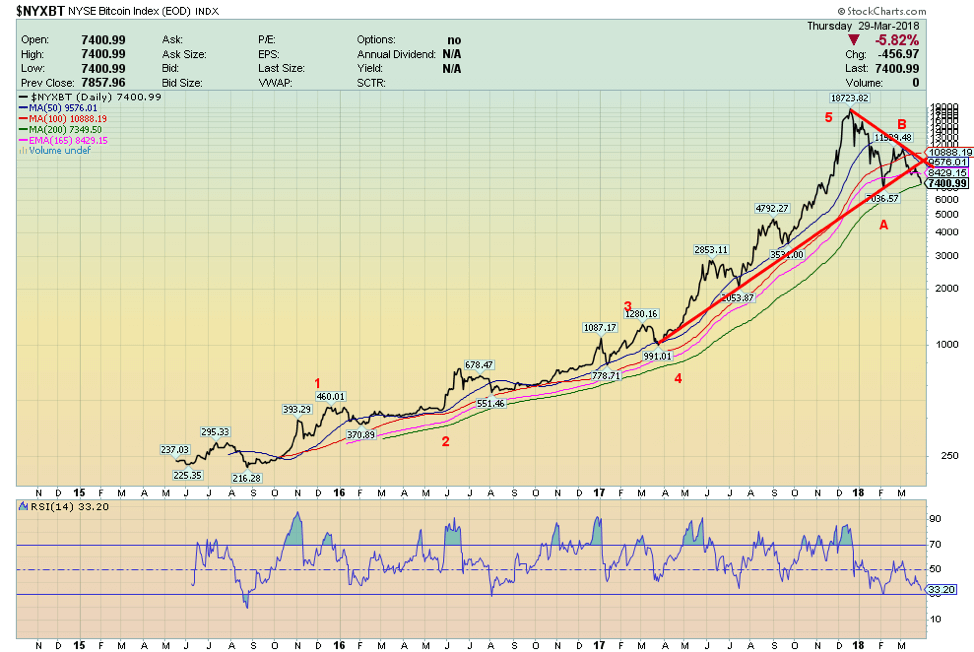
It was inevitable. Bitcoin has now fallen back under $7,000 to new lows. Worse, it has broken down under a key trendline indicating that it is about to fall even lower. There is some support for Bitcoin down to $6,000, but under that level, the next good support doesn’t develop until $4,600 to $5,000. Potential targets for this downswing are to about $2,300. At that point, Bitcoin would be down some 88 percent from its all-time high. All we can say to the holders of Bitcoin and other cryptocurrencies is they were warned.
And it is not as if it is just Bitcoin falling in price, as all or almost all cryptocurrencies are declining, some faster than others. There are still 1,594 cryptocurrencies listed at Coin Market Cap. The last time we looked, they had a combined market cap of around $245 billion. At its peak, Bitcoin had a market cap of $324 billion. To call this a “bloodbath” could become an understatement.
Regulation, scams, hype, an overabundance of IPCs, and the bursting of what still might be termed a huge bubble are all playing their part. Panic could envelop the market, pushing it even lower. The entire crypto market just never passed the smell test, and now, those who leaped in even leveraging up are paying a steep price. Losses are already in the billions. The worst performing cryptos are already down 90 percent or more from their peak. Some are calling it a warning sign for the stock market. Given the performance of the stock market over the past couple of months, they may have a point. Yet it didn’t stop many from calling cryptocurrencies and Bitcoin, in particular, a “safe haven” as good if not better than gold. But Bitcoin and the cryptos were always considered ephemeral, and they are now proving to be.
The bubble has burst, and the question is, how low will they go? And we say this despite reading stories that this is merely a “bear trap” and that somehow Bitcoin and the other cryptos will recover and go to new highs. They could be in denial.
© David Chapman
Markets and trends
© David Chapman
© David Chapman
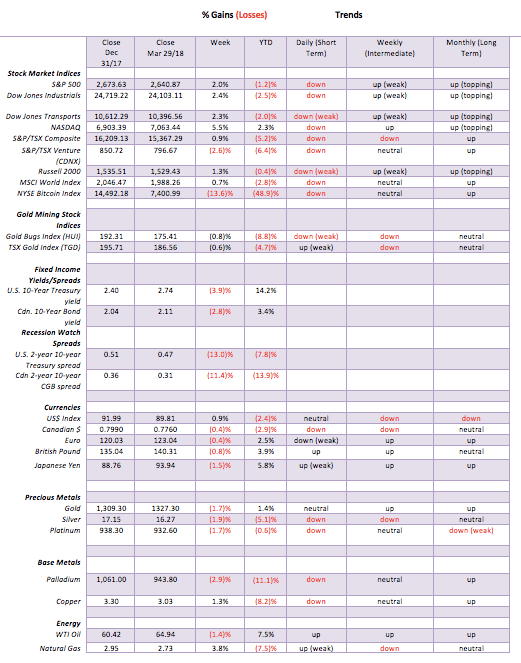
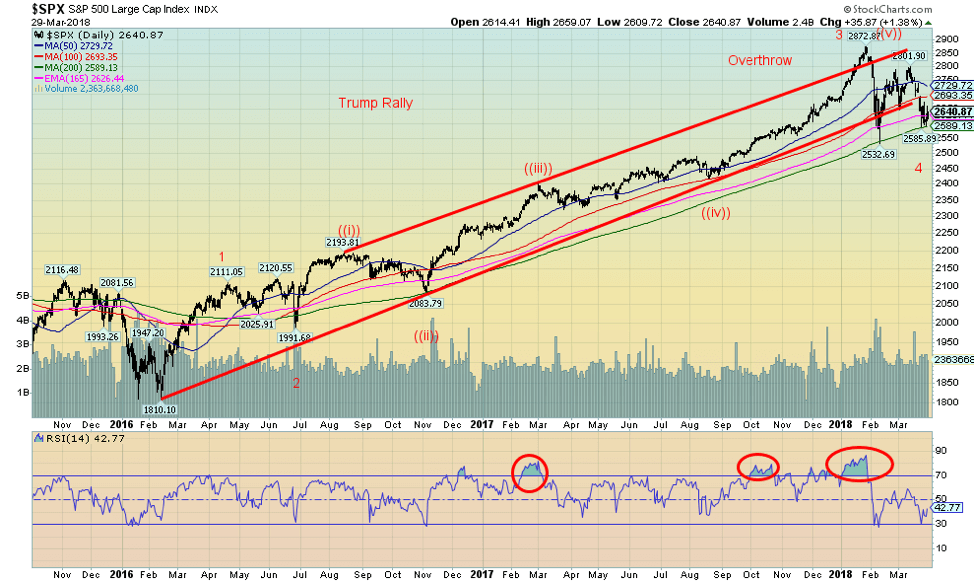
The S&P 500, thanks to a good up day on Friday, put in a positive week. We continue to believe all of the recent action is the forming of a low that could eventually take the S&P 500 to new highs. Currently, the S&P 500 is down just over two percent on the year and down just over eight percent from its all-time high seen in late January. At its recent low, the S&P 500 was down just under 12 percent from its January high. Not quite what one would call bear market territory. We continue to muse as to whether the wave count up from the February 2016 low puts this current correction as wave 4. Elliott Wave International has put the January top as wave 5. They are currently looking for another sharp wave to the downside. We don’t think it will happen but recognize that until we take out key points to the upside further sell-offs are clearly possible, especially given the ongoing news in the background.
One reason we are encouraged is that the Russell 2000, a small-cap index, has actually held up remarkably well. The Russell 2000 is down only 0.4 percent so far in 2018, outperforming the big cap stocks. Normally in a bear market, the small-cap stocks are considerably weaker. The S&P 500 has held thus far the 200-day MA another positive development. Resistance remains above. There is good resistance up to 2,700 and 2,750. Above 2,800, the S&P 500 would indicate new highs are probable. Naturally, all this is conditional on the S&P 500 holding the recent lows just below 2,600 and especially the early February low at 2,532.
Easing of tensions with regard to potential trade wars between the U.S. and China were a good reason why the markets rebounded this past week. As we have seen with the NAFTA negotiations, they can be very fluid, moving from high tension and appearing that nothing will be accomplished until we could have a deal. Our expectations are the China-U.S. trade negotiations will take on a similar appearance as negotiations ebb and flow. A full-out trade war is not likely. Even all the noise over tariffs on steel and aluminum disguises the fact that steel and aluminum trade make up barely 0.2 percent of global trade that totals some $2.4 trillion. Besides, Trump is not the first president to go the trade protectionist route. Every president since Jimmy Carter has imposed some tariffs on things. While tariffs are not positive, it is the reaction, retaliation and escalation that could make things worse. But if both sides are willing to talk then it eases those tensions—at least, until the next round of threats. But as of the moment, we are not seeing quite the tit-for-tat trade retaliation that we are seeing, for example, in the expulsion of diplomats between the West and Russia. But then, the latter has had little impact on markets.
© David Chapman
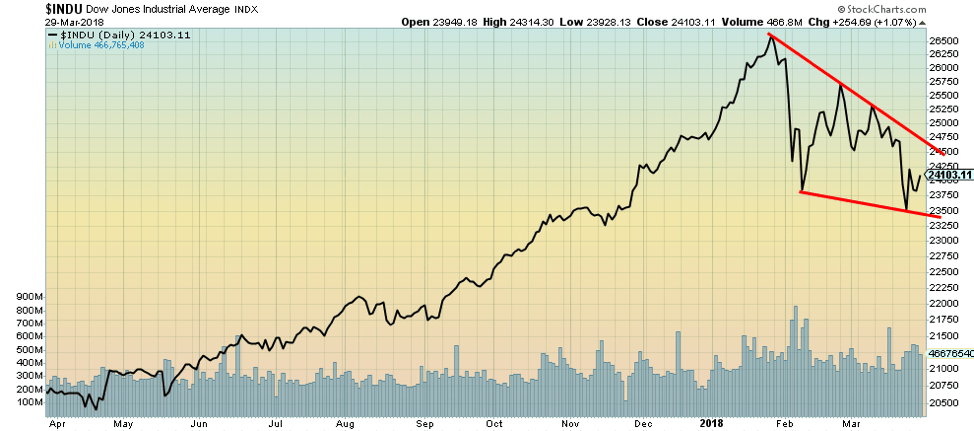
A line chart gives a slightly different view of the market than a traditional bar chart or even a candlestick chart. The line chart only plots the close. Here, we see that the DJI made a new low close on March 23, 2018, below the close of Feb. 8, 2018. But the traditional bar chart shows that the DJI made a lower low on Feb. 8 than it did on March 23. Based on close, only the DJI could be forming a descending wedge triangle. This triangle would not be visible on a bar chart of the DJI. A descending wedge triangle is potentially bullish. In this case, the breakout comes at around 24,500 and could see the DJI return to the highs near 26,500. Naturally, once again, the bottom end of the triangle must hold. That is currently near 23,500. The low close was at 23,509. Note also the decline in volume that has occurred on the recent pullback. It suggests that selling pressure is abating.
© David Chapman
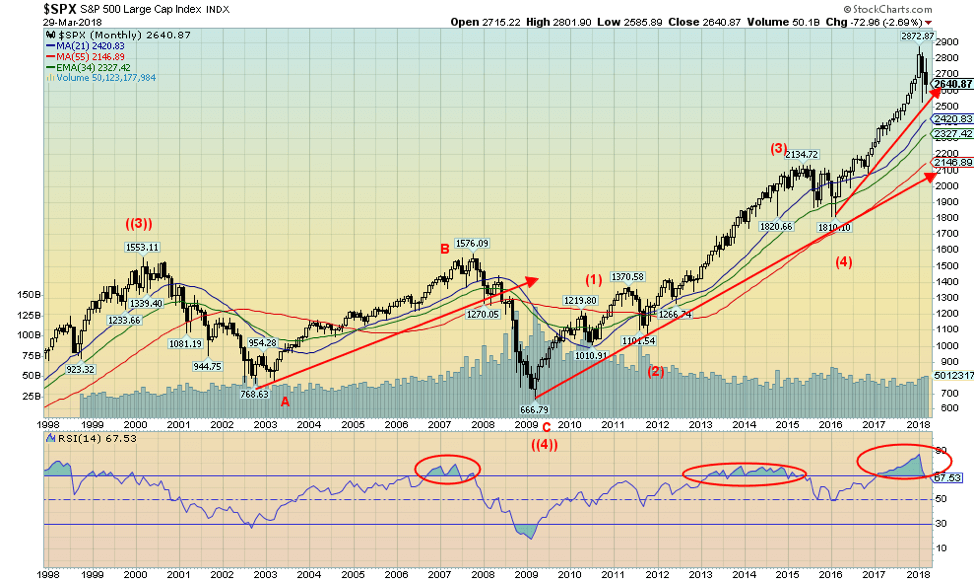
The monthly chart of the S&P 500 shows potentially five waves up from the major low of March 2009. Waves 1, 2, 3, and 4 are complete with the key corrections in 2011 (wave 2) and 2015/2016 (wave 4). The only question remaining is: has the final high been seen in January 2018 to complete wave 5? Irrespective of this, the pullback has held uptrend lines, and it remains well above the key monthly MAs of 21 and 55 months, respectively. The 21-month MA is currently at 2,420, while the 55-month MA is at 2,146. We also show the 34-month exponential MA currently at 2,327. The chart goes back to 1998 and shows that when the S&P 500 broke the 34-month EMA, the bear market accelerated to the downside. In both the 2011 and 2015/2016 corrections, the S&P 500 tested the 34-month MA but didn’t firmly break down. The 34-month EMA in those cases acted as key support.
© David Chapman
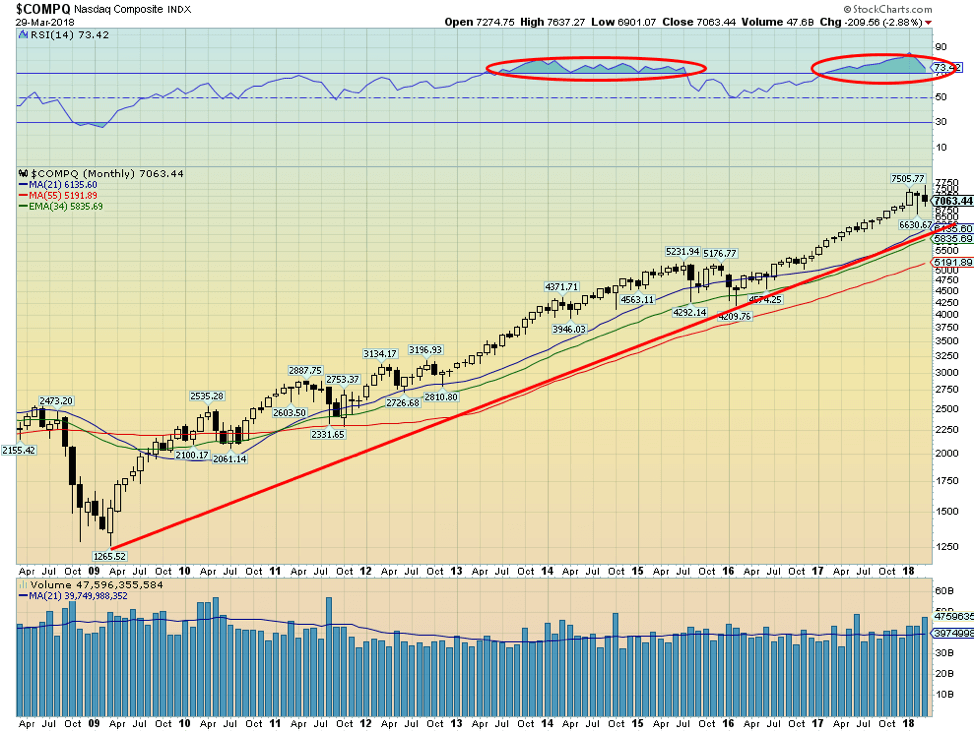
Here is the monthly NASDAQ chart from the major 2009 low. The NASDAQ is also holding its uptrend line. The uptrend also roughly coincides with the 34-month EMA, currently 5,835. So once again, we are defined as to when a really serious bear market might get underway. The final line of support would come in at the 55-month MA currently down at 5,190. Volume has been on average declining. That is typical of markets in their final stages.
© David Chapman
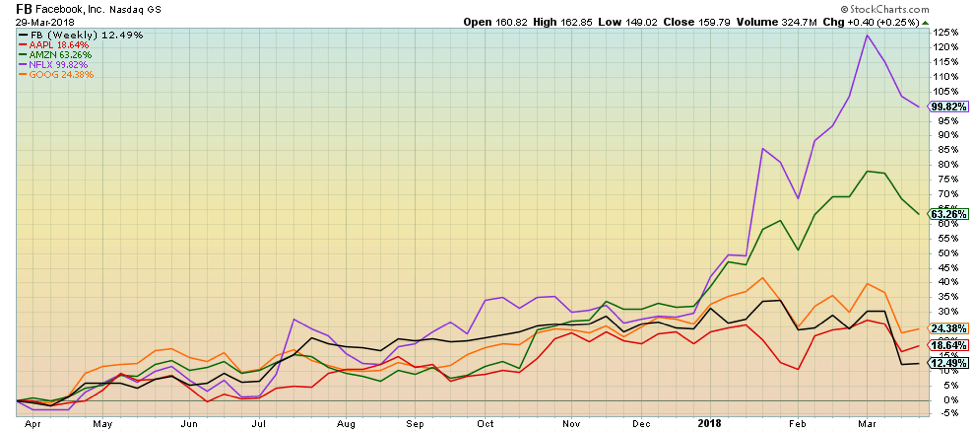
Here is the performance of Facebook, Apple, Amazon, Netflix, and Google (FAANGs) over the past year. All remain positive for the year, but they are off their highs. While the center of attention has been on Facebook, we note Amazon has been under attack from the Presiden,t who has been twittering up a storm over the low taxes it pays, its misuse of the Post Office, and CEO Jeff Bezos. Bezos owns The Washington Post, a newspaper that has been quite critical of Trump. Bezos is also a well-known Democrat. Amazon fell 3.2 percent this past week even as the markets as a whole were up. Netflix also lost 1.9 percent, while the other FAANGs were up on the week (Facebook was essentially flat with a small gain). As we have noted before, the FAANGs led the market up. Could they lead the market down?
© David Chapman
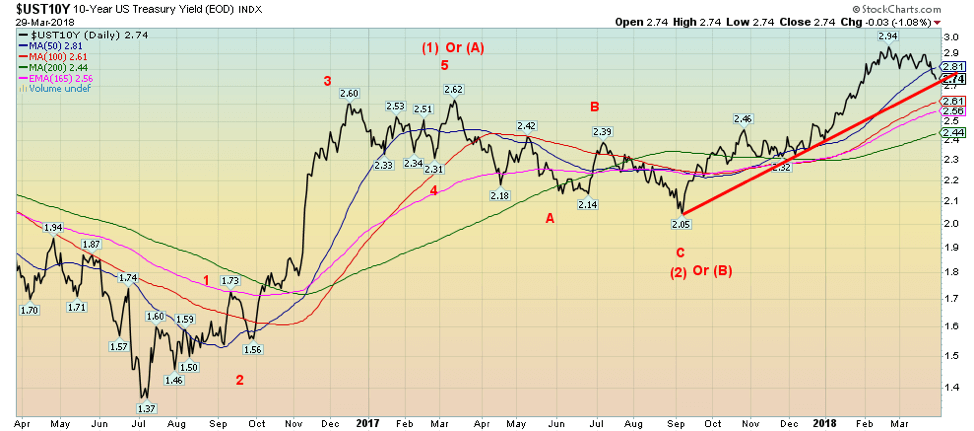
Given all the market volatility, it may have been no surprise that despite an almost record issuance of Treasuries, this past week yields actually fell, at least in the long end of the curve as investors sought safety over the volatility of the stock markets. Given expectations of the Fed hiking interest rates at least two more times in 2018, pressure has been maintained at the short end of the yield curve. The yield on the 10-year U.S. Treasury note has fallen to 2.74 percent, which is where the 10-year auction settled this past week. The yield has broken the 50-day MA and could be poised to fall further. A break of 2.70 percent could send the 10-year down to 2.60 and even send it down to test the 200-day MA, currently near 2.44 percent. While we do have a long-term target outstanding up near 3.20 percent, it may be this pullback for yields has some more downside before rising again. This could ease fears that interest rates are rising, at least in the near term even as the Fed hikes the short rates.
Recession watch spread
© David Chapman
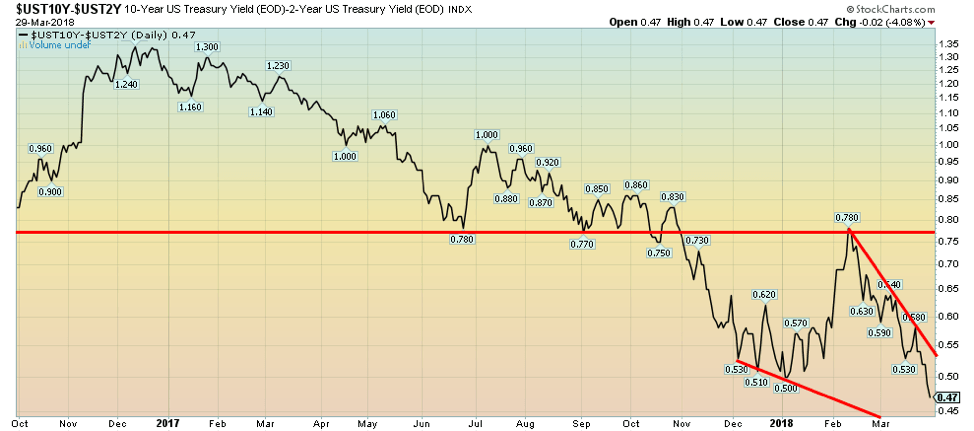
The 2–10 spread has narrowed again, this time falling to 0.47 percent down from the previous week’s 0.54 percent. In Canada, the 2–10 spread has also narrowed to 0.31 percent down from 0.35 percent. Maybe Canada’s poor GDP report for January had something to do with the spread falling. In January, Canada reported GDP growth as negative 0.1 percent when they expected a gain of 0.1 percent. This is noteworthy because it is a sign that the Canadian economy is slowing. Real estate slowing was cited as one of the factors. Before previous recessions, the 2–10 spread went negative. At 0.47 percent, it still has a ways to go, but the direction remains firmly in place, and that is down. It is noteworthy there is no record of three consecutive presidential terms with no recession. Obama had no recessions during his two terms. President Bush saw two recessions, but before that, President Clinton served two terms with no recessions. The 2–10 spread acts as a warning sign. And the current signs are not overly positive as the spread narrows.
© David Chapman
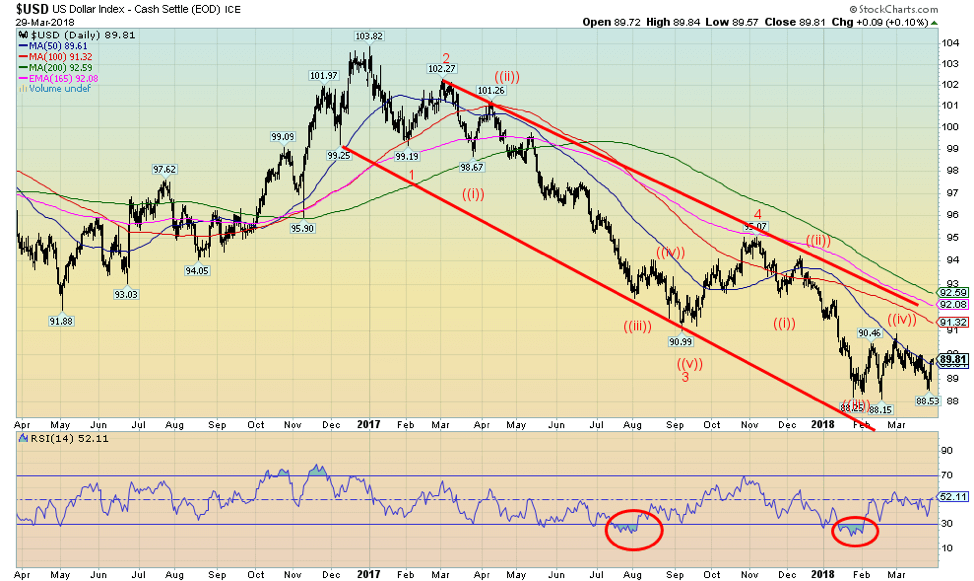
Fears about trade wars seem to be driving the U.S. dollar index of late. This past week, as fears of a China-U.S. trade abated, the U.S. dollar found a low and leaped. The low of 88.53 was well off the February low of 88.15. Its rally took its index back to the 50-day MA, just shy of 90. The U.S. dollar index gained 0.9 percent on the week, while the Euro fell 0.4 percent. However, the big loser was the Japanese Yen, dropping by 1.5 percent. The Canadian dollar was down 0.4 percent as Canada reported a weaker than expected January GDP. The British Pound lost 0.8 percent as Brexit fears continue to play havoc with the currency.
It’s hard to say which way the U.S. dollar is going to go here. The trend is still down, but the bounce-back this past week was stronger than expected. But then, the ups and downs of a potential trade war with China are like that—on one moment, back to negotiations the next. Another bone of contention between the U.S. and China could be the rise of the Petro-Yuan. China has launched oil priced in Yuan. It is China’s latest attempt to derail the dominance of the U.S. dollar for global supremacy. But as with anything, it could take years for the Petro-Yuan to get established. The Chinese have been challenging the U.S. on a number of fronts—the U.S. dominated IMF, World Bank, and the International Bank for Reconstruction and Development (IBRD). As well, China and Russia are creating an alternative to the global payments system known as SWIFT. No wonder U.S.-China tensions are high, especially when one adds in North Korea and China’s building of military bases in the South China Sea, even as U.S. military bases are themselves prevalent in South Korea, Japan, and the Philippines.
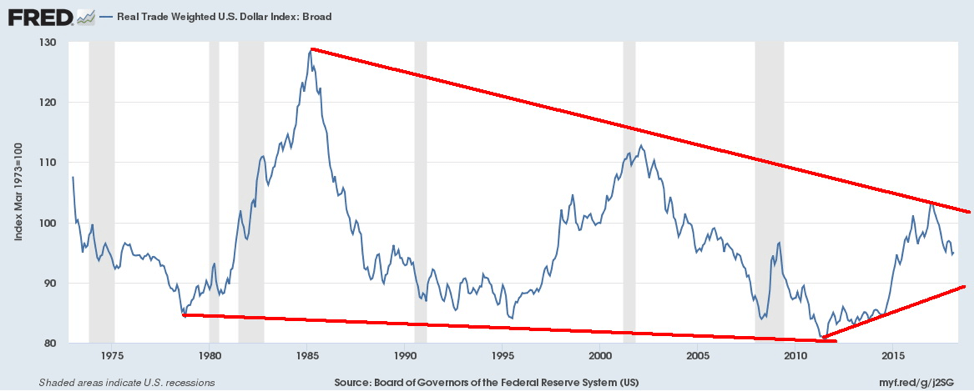
Ultimately, all this could have a negative impact on the U.S. dollar. But the U.S. dollar index does not contain the Yuan as it is predominantly the Euro (57.6 percent), the Japanese Yen (13.6 percent), and the Pound Sterling (11.9 percent). The Canadian dollar is 9.1 percent, while the Swedish Krona and the Swiss Franc are 4.2, percent and 3.6 percent, respectively. No wonder many prefer to instead look at the U.S. Dollar Trade Weighted Index. Below is the U.S. Dollar Trade Weighted Index (Broad). This index is trade-weighted to a basket of currently 27 currencies, including the Chinese Yuan, the Russian Ruble, and even the Venezuelan Bolivar. This chart is sharply different than the standard U.S. Dollar Index. The bounce-back since January-February 2018 has been stronger with the trade-weighted U.S. dollar. That may help explain some of the recent weakness for gold prices that are priced in U.S. dollar. But if the Chinese get the Petro-Yuan and the Shanghai Gold Exchange really underway, then we may soon be thinking of gold in Yuan instead.
© David Chapman
© David Chapman
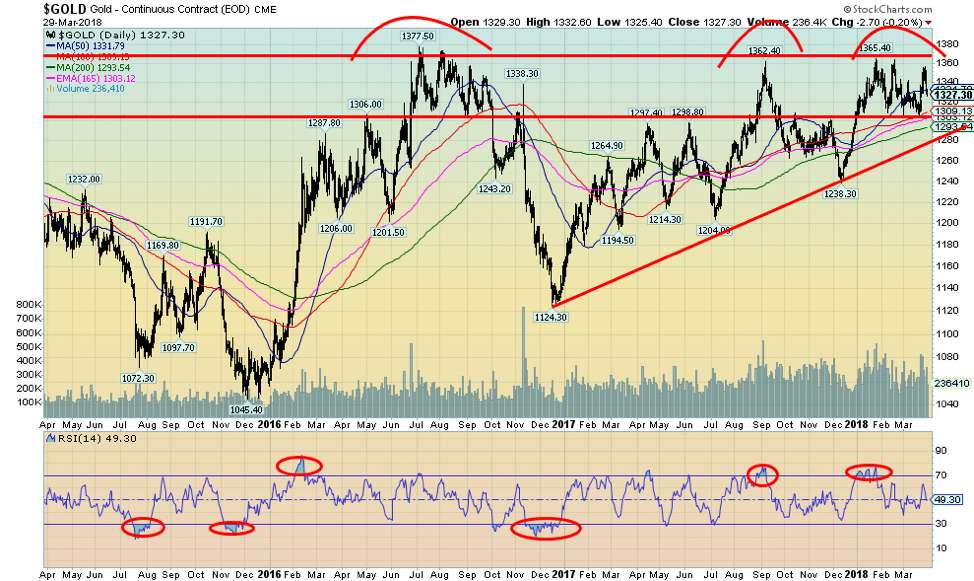
Once again, just as gold rose into our key $1,350/$1,375 resistance, it failed and backed off. The fall was swift as gold lost 1.7 percent on the week but was down 2.2 percent from the high of $1,356.80 on March 27, 2018. The sudden turnaround in the U.S. dollar was the prime reason as Chinese-American tensions eased on the trade front. We can look at the recent action somewhat nervously as the action since the beginning of the year looks eerily like the action seen in late June to early October 2016. The current action puts us in September 2016 before another downthrust followed by the final upthrust into October 2016. That said, triple tops are extremely rare, and the pattern formed since 2016 still appears to be an ascending triangle, which should be bullish. It has the characteristics of an ascending triangle with rising bottoms from the December 2015 low and a relatively flat top along $1,365/$1,375. If the pattern is correct, we should break out to the upside with potential to rise to almost $1,700 or as a minimum target to $1,620. Key, of course, is that current pattern doesn’t really turn out to be a replay of July-October 2016. What followed was the collapse to $1,124 in December 2016. Support remains down at $1,290-$1,310. Indicators are pretty neutral here. Seasonals should favor a rebound into May. The fundamentals for gold remain positive given trade wars, sharply rising debt, geopolitical tensions, and chaos in the White House. Demand continues to be good even if it ebbs and flows. China and Russia continue to add to their gold reserves.
© David Chapman
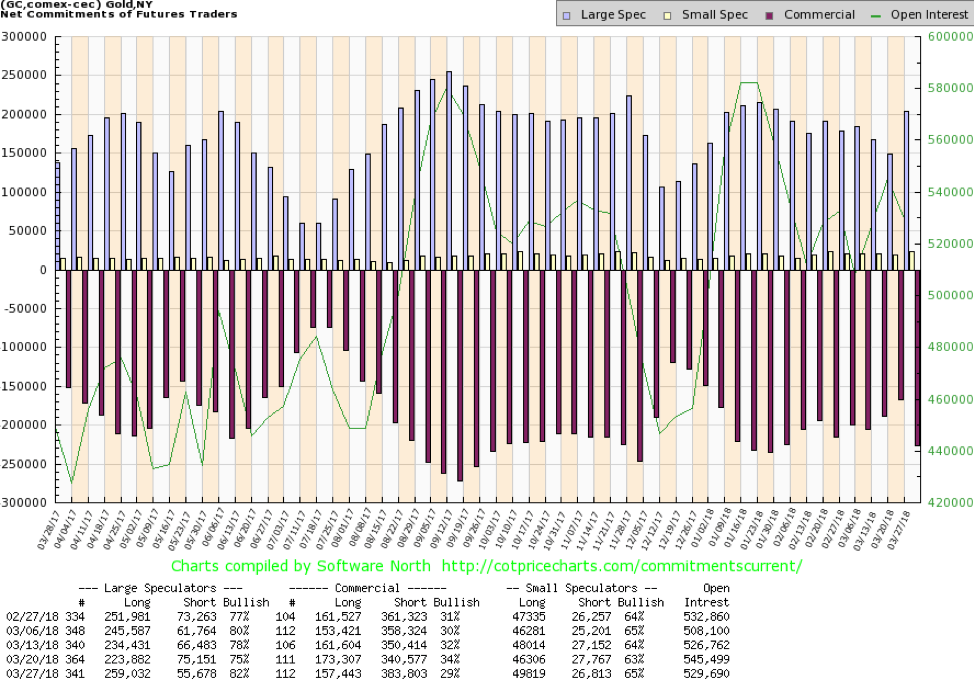
The commercial COT for gold pulled back this past week to 29 percent from 34 percent the previous week. The COT is as of March 27, 2018, which coincided with the top for gold. Short open interest took a big jump, up roughly 43,000 contracts, while long open interest fell just under 16,000 contracts. It was no surprise then that the large speculators COT (hedge funds, managed futures, etc.) jumped to 82 percent from 75 percent as they shed roughly 20,000 contracts on the short side and added about 35,000 contracts on the long side. Overall, open interest fell roughly 16,000 contracts. Given the pullback that followed for gold prices, we can view this week’s report somewhat benignly although it is a bit concerning. We have seen this happen before where the commercial COT was improving, only to suddenly lurch back to the downside again, followed by an improvement once the gold price fell. We’ll see how next week’s commercial COT looks. If it improves again, we’ll know the commercials quickly covered their shorts.
© David Chapman
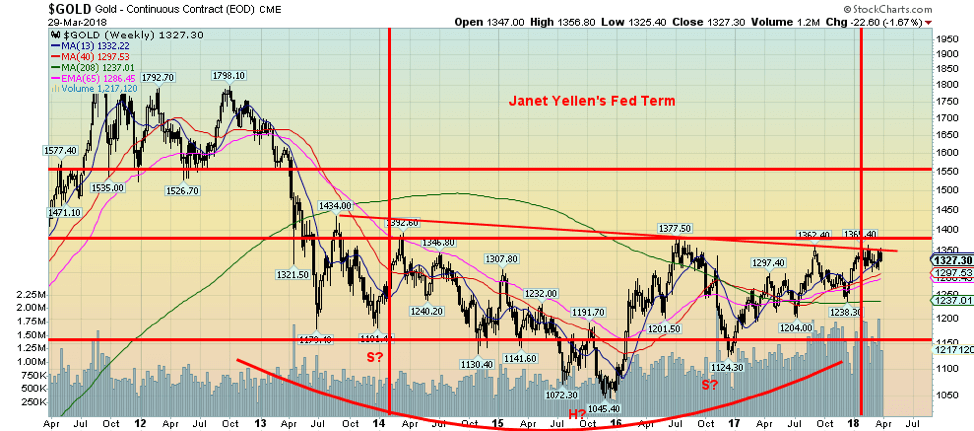
Here’s the longer-term view of gold dating from the September 2011 top and the ensuing six-plus years to date bear market. This is a chart we have shown in the past. For much of Janet Yellen’s term at the Fed, gold traded between $1,150 and $1,375. The pattern appears as a potential huge head and shoulders bottom pattern with the neckline at our major $1,350-$1,375 resistance zone. The chart pattern has potential to see gold rise to $1,750, which is in line with the previously mentioned ascending triangle pattern. The major support line for this longer-term pattern is around $1,250.
© David Chapman
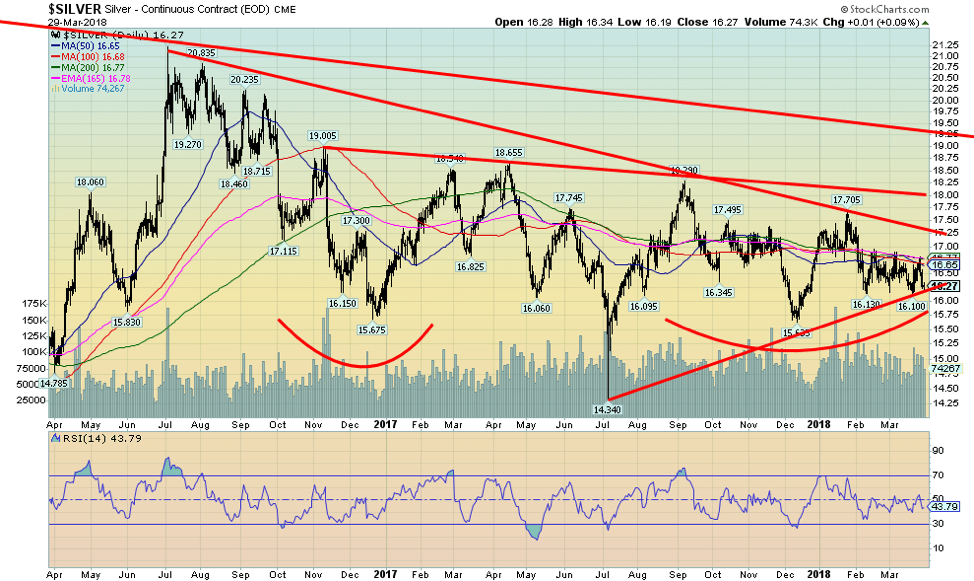
Silver continues to trade weakly. Like gold this past week, silver peaked at $16.81 on March 27, 2018, then swiftly fell, losing 1.9 percent on the week and down 3.2 percent from its earlier peak. The low-water mark for silver seen in July 2017 at $14.34 continues to be a long way off. But silver continues to be frustrating, especially against the backdrop of good demand and dwindling supply. It ran right into resistance at the converging 50-, 100- and 200-day MAs. This pattern has been in place since mid-February. To the downside, the $16.10-$16.15 zone continues to act as support. The gold-silver ratio remains historically high over 80. Like gold, the pattern, in some respects, makes us nervous for a downside break because it is beginning to look like a descending triangle (bearish). It has measuring implications down to $15.25 if it breaks under $16. But fundamentals and the very good commercial COT (seen next) continue to keep us positive towards silver. Silver should outperform if a bull market gets underway. Indicators are fairly neutral here, which is no surprise given the narrowing range of trading. Silver breaks out over $17 and $17.25. The major breakout occurs over $18 with potential targets up to $22.65.
© David Chapman
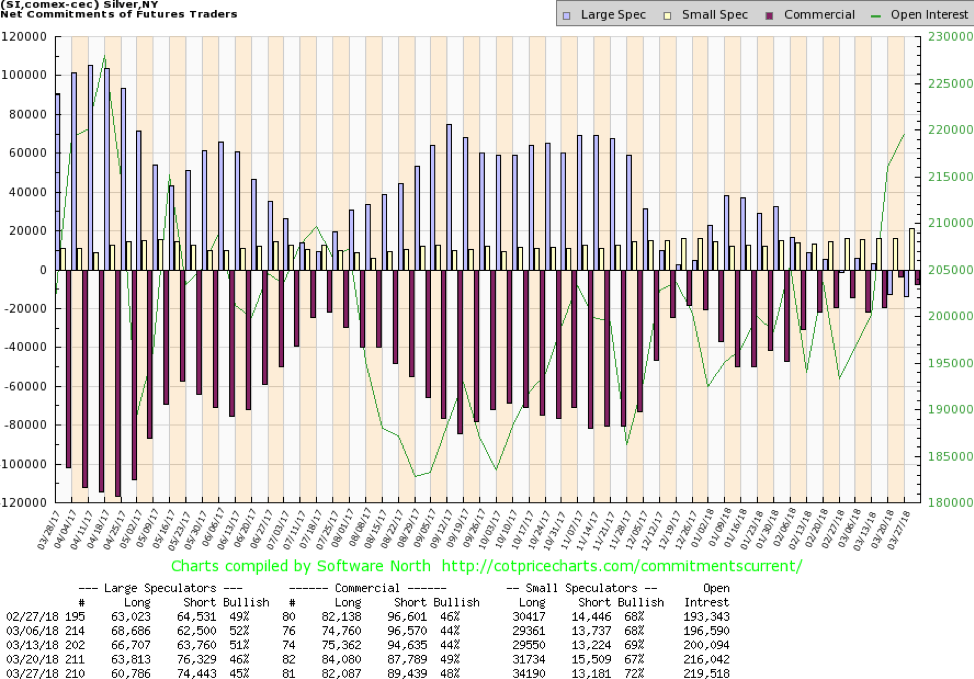
The silver commercial COT slipped a little this past week but not significantly compared to gold. The commercial COT slipped to 48 percent from 49 percent as short open interest rose just under 2,000 contracts and long open interest fell by roughly 2,000 contracts. But the large speculators COT also slipped to 45 percent from 46 percent as their long open interest fell by roughly 3,000 contracts although short open interest also fell by about 2,000 contracts. The large speculators continue to be in a net short position, something rarely seen while the commercial COT even at 48 percent continues to be amongst the best we have ever seen. Overall, this remains a very bullish report, but one would never know it with the way silver is actually trading.
© David Chapman
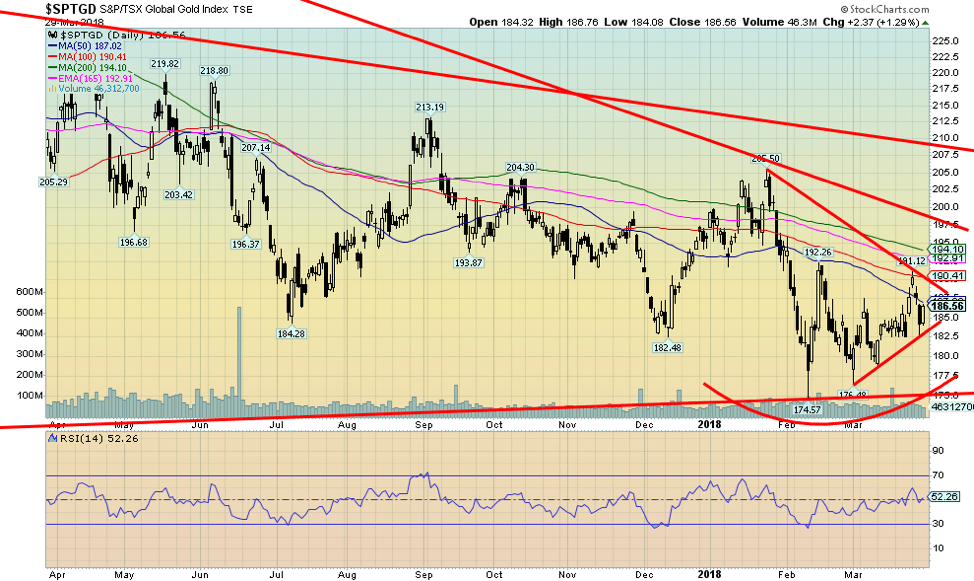
The gold stocks were off this past week with the Gold Bugs Index (HUI) losing 0.8 percent and the TSX Gold Index (TGD) down 0.6 percent. Despite being down, both gold indices actually outperformed gold and silver. We view that as at least mildly positive. Still, the TGD fell back under the 50-day MA despite the gain on Friday of 1.3 percent. The TGD has established a small uptrend, but it is not particularly strong at this point. The TGD failed this past week at the 100-day MA before moving back down. The TGD closed down 2.4 percent from that top. But it is up about 6.9 percent since making a low in February 2018. Still, both the HUI and the TGD remain down on the year after three months. Resistance for the TGD is at 190 and then again at 198. A major breakout would occur above 208/210 with potential to rise to 275. Major support is at 175 with trendline support currently coming in around 182/185.
Chart of the week
© David Chapman
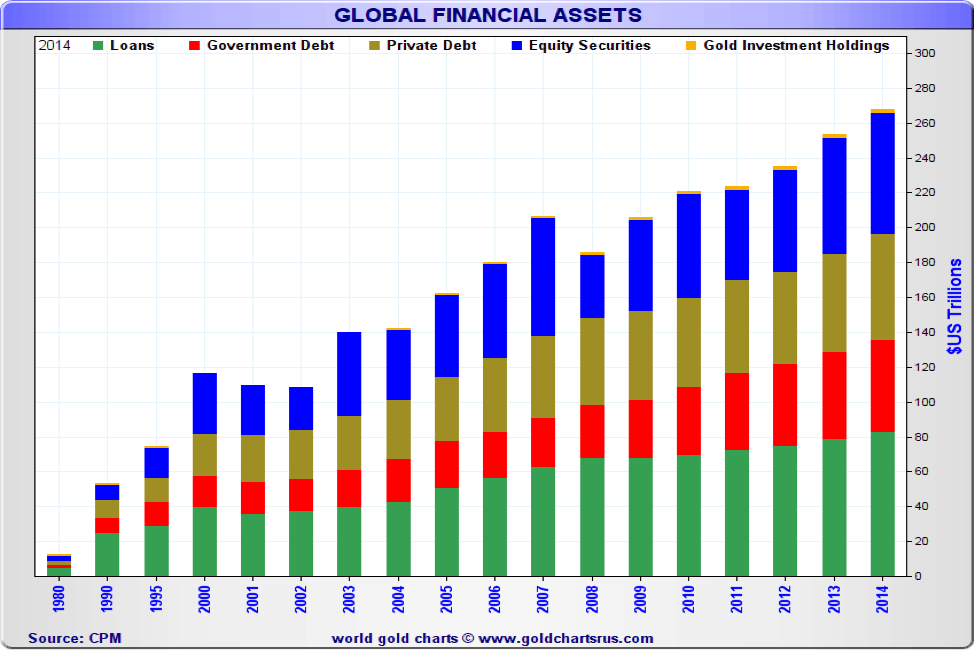
Gold really is a tiny fraction of global financial assets (does not include real estate). You can barely see gold on this chart, but it is there. The chart only goes to 2014, but the positions held three-plus years ago still hold. Today, global debt is estimated to be around $233 trillion (includes loans, sovereign debt, and all other bonds of corporations, states, municipalities, etc. as well as consumer debt). The size of the global equity market is estimated at about $80 trillion although it was also estimated the February collapse in equity prices shed $5.2 trillion. Gold has a global value of $7 trillion to $7.5 trillion considering that all the gold ever mined is still with us. That makes gold just over two percent of global financial assets. No wonder gold is a mere blip on this chart. Central bank gold reserves are estimated to be about 33,500 metric tons with a value at approximately $1.4 trillion. Yet gold, unlike equity and bonds, cannot fall to zero. Gold is difficult to find, and the timeline from exploration to production is lengthy. Yet gold remains undervalued and under-owned. If even a small one percent of debt and equity were shifted into gold, there isn’t enough gold around to even begin to satisfy the demand unless everyone cashes in their jewelry. A one percent shift would represent about $3 trillion in current value. Yet for the most part, gold has been a mainstay in the world’s financial system since ancient times today just being the latest experiment with fiat currencies.
—
DISCLAIMER
David Chapman is not a registered advisory service and is not an exempt market dealer (EMD). We do not and cannot give individualised market advice. The information in this newsletter is intended only for informational and educational purposes. It should not be considered a solicitation of an offer or sale of any security. The reader assumes all risk when trading in securities and David Chapman advises consulting a licensed professional financial advisor before proceeding with any trade or idea presented in this newsletter. We share our ideas and opinions for informational and educational purposes only and expect the reader to perform due diligence before considering a position in any security. That includes consulting with your own licensed professional financial advisor.

-

 Crowdfunding1 week ago
Italian Alternative Finance Players Unite to Form New EGM-Listed SME Hub
-

 Africa2 weeks ago
AMDL Unveils 660 Million Dirham Investment Plan to Strengthen Morocco’s Logistics Infrastructure in 2026
-

 Africa2 days ago
Unemployment in Moroco Falls in 2025, but Underemployment and Youth Joblessness Rise
-

 Biotech1 week ago
BioNTech Shares Surge in 2026 as Analysts See Further Upside


You must be logged in to post a comment Login