Business
Wall Street on Screen, Inequality in Reality, and Fears of a Growing Market Bubble
Hollywood has long depicted Wall Street’s greed and excess, from Wall Street to The Big Short. Wealth inequality in the U.S. is now extreme, with the top 1% holding 31%. Past eras of similar inequality ended in crashes and turmoil, raising concerns of another major bubble despite conflicting views on AI-driven markets.

Hollywood and Wall Street have a long history, even though most of the films about Wall Street only go back to the 1980s. The most famous one may be Wall Street (1987), a film about ambition and greed. Our favourites are The Wolf of Wall Street (2013), a film based on the true story of Jordan Belfort and his rise and fall against the corruption and greed in Wall Street’s boiler rooms, and The Big Short (2015), a film set against the backdrop of the 2008 financial crisis, about investors betting against the U.S. mortgage market, based on the book by Michael Lewis.
There have also been comedies, such as Trading Places (1983), about a snobbish commodities broker and a street hustler trading places in the commodities brokerage business. While set in Chicago, the home of the Chicago Board of Trade (CBOE) and the Chicago Mercantile Exchange (CME), it still, nonetheless, encompasses the investment business.
Even Canada got into the act with a TV series, Traders (1996–2000), about the goings-on of investment bankers on Toronto’s Bay Street. What struck us about these films was that, given our own 50+ year career in the investment industry, the depiction of investment bankers in these films was quite accurate. Where money was involved, greed followed. The rows of traders on phones, power lunches, palace intrigues, affairs, and even drugs were quite common.
The richest one percent of this country owns half our country’s wealth, five trillion dollars. One-third of that comes from hard work, two-thirds comes from inheritance, interest on interest accumulating to widows and idiot sons and what I do, stock and real estate speculation. It’s bullshit. You got ninety percent of the American public out there with little or no net worth. I create nothing. I own. We make the rules, pal. The news, war, peace, famine, upheaval, the price per paper clip. We pick that rabbit out of the hat while everybody sits out there wondering how the hell we did it. Now you’re not naive enough to think we’re living in a democracy, are you buddy? It’s the free market. And you’re a part of it. You’ve got that killer instinct. Stick around pal, I’ve still got a lot to teach you. —Gordon Gekko, played by Michael Douglas in Wall Street (1987)
Solomon Brothers Trading Floor in the 1980s
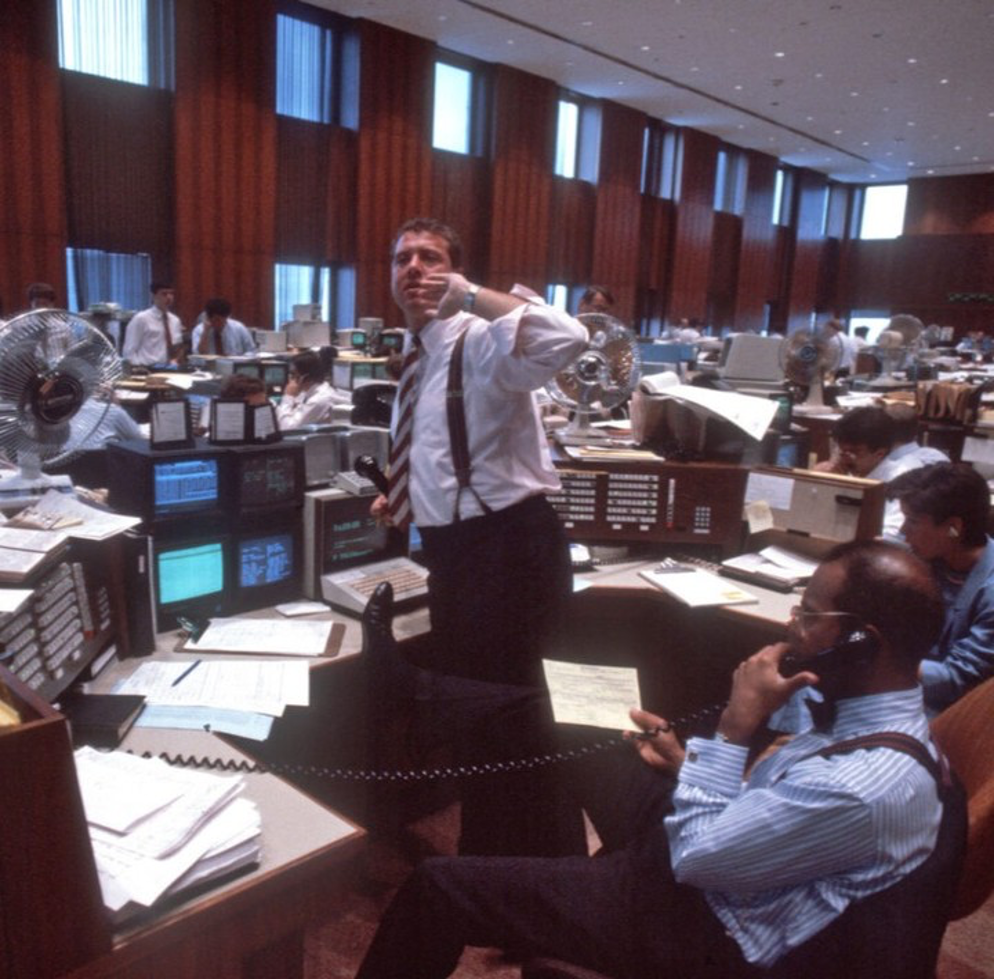
Source: Instagram. A picture of the trading floor of Solomon Brothers in the 1980s, an era often referred to as the golden age of Wall Street
Gordon Gekko was off a little bit. According to the wealth distribution of the U.S. in Q1 2025, the richest 1% hold about 31% of the country’s wealth. The richest 10% hold 67% while the bottom 50% have only 2.5%.
Quite the disparity. Apparently, it is the widest gap in U.S. history between the haves and the have nots, even beyond The Gilded Age (1870s to 1890s) and The Roaring Twenties(1920s).
Both eras ended in significant stock market crashes, financial crisis and economic depressions. The Gilded Age ended with stock market panics in 1893, 1896, 1901, and 1907. But even before that, from 1870 to 1907, there were a series of stock market crashes, recessions, and depressions where mostly only the wealthy came out ahead. The 1920s culminated in the crash of 1929, followed by the Great Depression of the 1930s.
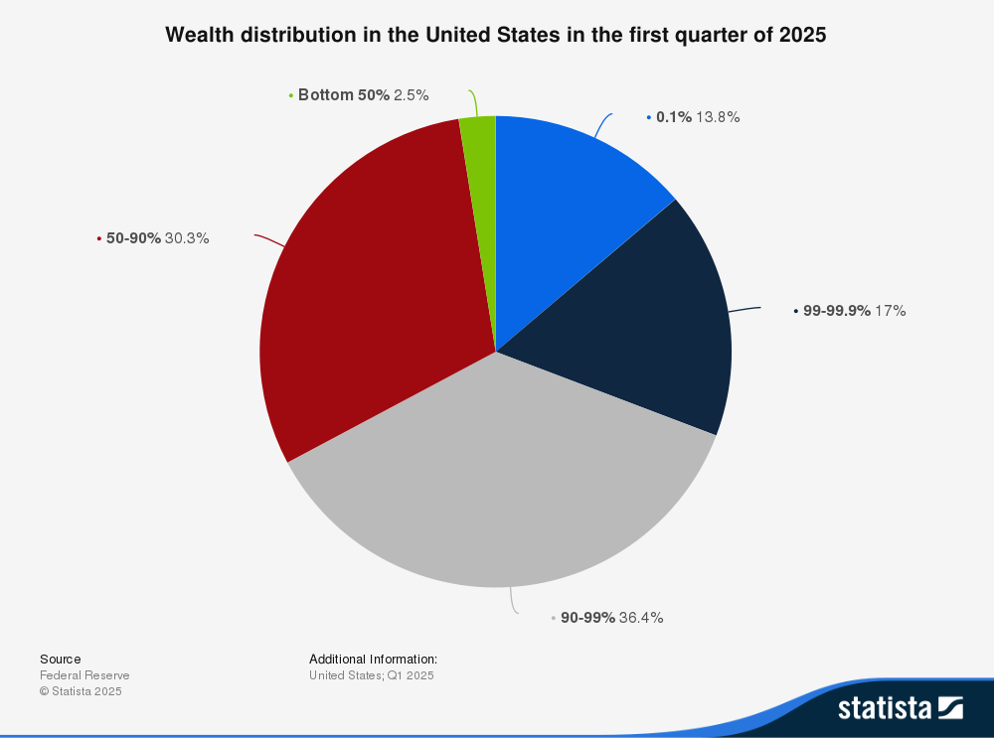
Source: www.statista.com, www.federalreserve.gov
While millions were being thrown off food stamps, bashes worthy of The Great Gatsby were being held at Mar-a-Lago, the president’s home on a barrier island in Palm Beach, Florida. In the past, huge wealth inequality has led to revolutions, notably the French Revolution of 1789 and the Russian Revolution of 1917. However, be careful what you wish for. The French Revolution was followed by the Reign of Terror in 1793–1794, where thousands of the elite were executed by the guillotine.
That was followed by the rise of Napoleon Bonaparte as the dictator of France. The Russian Revolution was followed by the Russian Civil War (1918–1923), a war that even involved the allied powers of the U.S, Japan, U.K, and Canada, plus others, in an attempt to overthrow the Bolsheviks. That in turn was followed by the rise of Stalin and the dictatorship of the U.S.S.R. Millions were killed in the civil wars that followed the Russian Revolution of 1917. Millions more were killed under Stalin or banished to Siberian prison camps.
Are we in a bubble? According to some, we are in one of the biggest bubbles in history. Others say the AI bubble has more years to run since AI is replacing a lot of the old internet and the industries around it. What that means for employment going forward is to be determined. Some say we are in the “everything bubble” as everything has been rising – stocks, houses, land, rare coins, and more. The housing market is currently tipping over. Will the stock market follow?
Previous bubbles ended in grief. Think of the 2000s housing bubble, the 1980s Japanese real estate bubble, and the 1990s dot.com bubble. All ended in crashes. Warren Buffett believes we are in a bubble. The Buffett Indicator, which we have noted before, is last at 2.24 (some will show 224). We hit over 200 just before the pandemic collapse in 2020. Some believe that AI will make the Buffett Indicator obsolete. AI will rewrite the rules of stock market metrics. It’s the classic “this time is different.” Buffett currently has a large cash stockpile of $382 billion, indicating he expects this bubble will not last. So, two differing views on where the market is headed. Only one will be right.
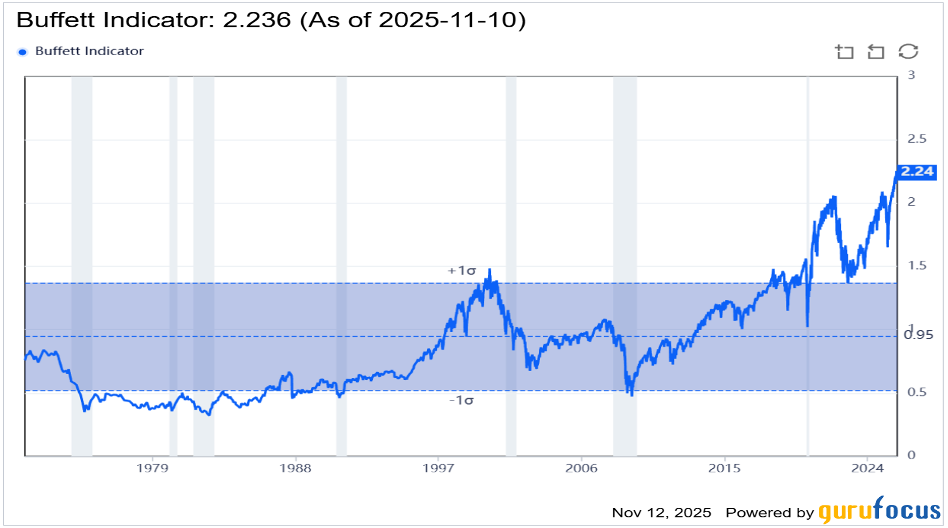
Source: www.gurufocus.com
Stock Market (Dow Jones Industrials DJI) Bear Market Collapses of over 40%, 1900–2025
| Period | # days in recession/depression | % Decline | Cause |
| June 1901–Nov. 2003 | 875 | 46.1% | Panic of 1901 following assassination of President McKinley |
| Jan. 1906–Nov. 1907 | 665 | 48.5% | Panic of 1907, collapse of Knickerbocker Trust Co. |
| Nov. 2016–Dec. 1917 | 393 | 40.1% | U.S. entry into World War I |
| Nov. 1919–Aug. 1921 | 660 | 46.6% | Post-World War I recession/depression, hyperinflation in Europe, Spanish flu pandemic |
| Sept. 1929–July 1932 | 884* | 89.2%** | Panic of 1929, Smoot-Hawley tariff wars, Great Depression |
| March 1937–April 1942 | 1106* | 52.2%** | Secondary Depression, World War II |
| Jan. 1973–Dec. 1974 | 694 | 45.1% | Arab oil embargo, Watergate, collapse of Franklin National, stagflation |
| Oct. 2007–March 2009 | 517 | 53.8% | 2008 financial crisis, Great Recession, collapse of subprime loan market, credit default swaps (CDS), collapse of numerous regional banks and investment dealers, notably Lehman Brothers |
Source: www.stockcharts.com, www.wikipedia.org
* Number of days in official recession as there were stock market rallies in between, including November 1929–April 1930, March 1938–November 1938, and April 1939–September 1939, all with gains of 28% to 60%
** Total combined drop in September 1929–July 1932 and March 1937–April 1942
Most of the collapses with a decline of over 40% occurred from 1900 to 1942. Since the 1970s, only two occurred, in 1973–1974 and 2007–2009. What changed? Before the 1970s, the world was on a gold standard and the Fed, although created in 1913 after the 1906–1907 collapse, was not the active Fed we see today. Sharply lowering interest rates, flooding the financial systems with liquidity, and quantitative easing (QE) are all phenomena that really got underway after the stock market crash of October 1987. That collapse saw the DJI lose only 36.1%, thus not qualifying for the above table; however, it did trigger a different way on how market collapses were handled.
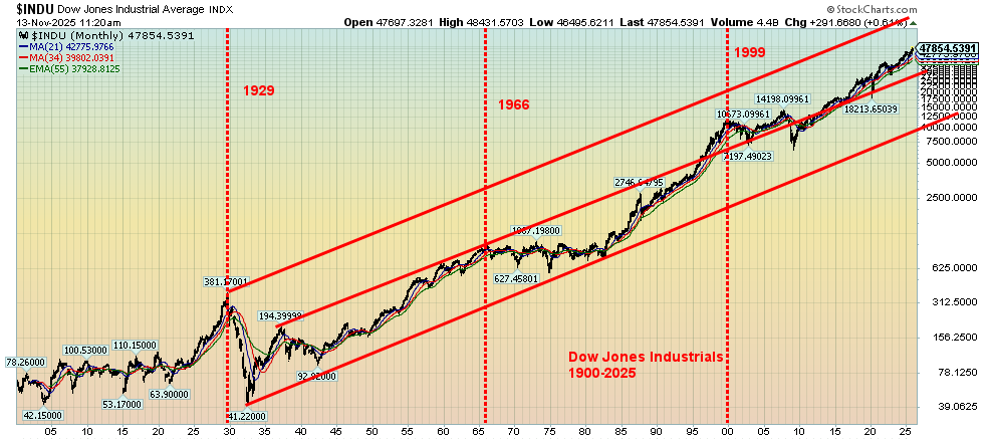
Source: www.stockcharts.com
Source: www.macrotrends.net
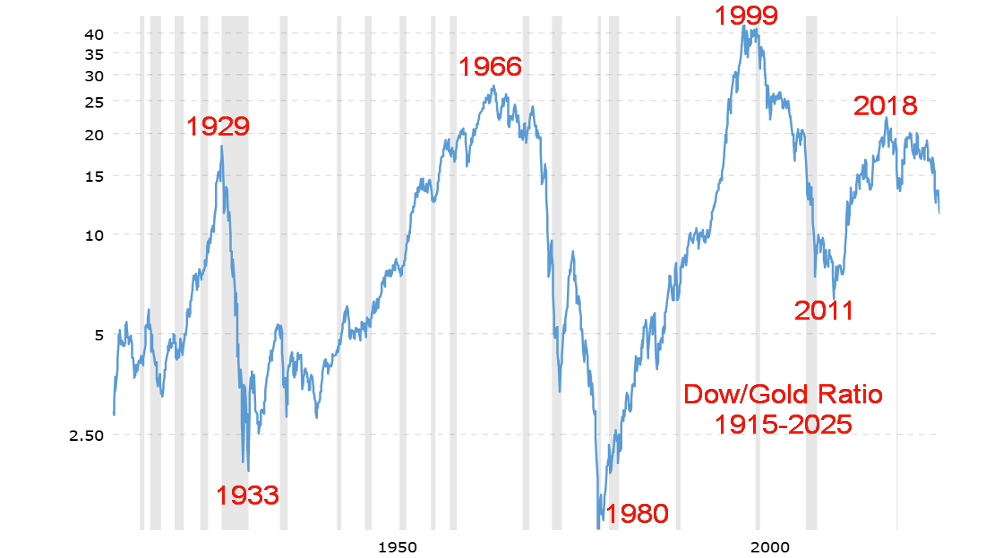
The Dow/Gold ratio is a useful tool for determining overvaluation in the stock market versus gold over the long term. The ratio represents the number of ounces of gold required to purchase the Dow Jones Industrials average. No, it does not tell you when the ratio tops or bottoms. Other tools are needed to determine a top of bottom. Generally, the ratio peaked at 20 or higher and bottomed at 2.50 or lower.
Over a 100-year period there have not been too many peaks or bottoms. As a result, the ratio is still a work in progress. Currently the ratio sits at 11.88, having clearly broken down from a period of consolidation. The ratio last peaked in 2018 and, while the DJI has gone on to new all-time highs, the falling Dow/Gold ratio indicates that gold has been rising faster than the DJI.
Lest we forget, the U.S. government had been shut down for 43 days before reopening. A new record. Will things quickly return to normal? Not likely. How soon will we get a catch-up on the numbers? We did not get the September employment numbers, nor the October employment numbers. The odds of seeing the September numbers are slim to none. October is also doubtful. Number-gathering for November is supposedly underway.
There are other reports that didn’t come out. Airports were in chaos and were not expected to return to normal anytime soon. We could go on. The reality is that the legislative process in the U.S. is in shambles and policy proposals almost non-existent, while the long-term fiscal capability of the U.S. is severely compromised. The health care system is not doing well either. The main focus these days is on the Epstein papers. Where it all goes is unknown.
Financial crises have been with us for millenniums. Huge up markets in stocks have inevitably been followed by a financial crisis and a stock market crash. No, this time is not different – just the circumstances. But given the current inequality, overvaluations as measured by the Buffett Indicator plus numerous other indicators, and the Dow/Gold ratio breaking down in favour of gold, it’s best to be selective in the stock market and long some gold. A few years from now we’re sure we’ll see new films depicting this era. The 2008 financial crisis had at least 10 fictionalized films and documentaries.
Chart of the Week
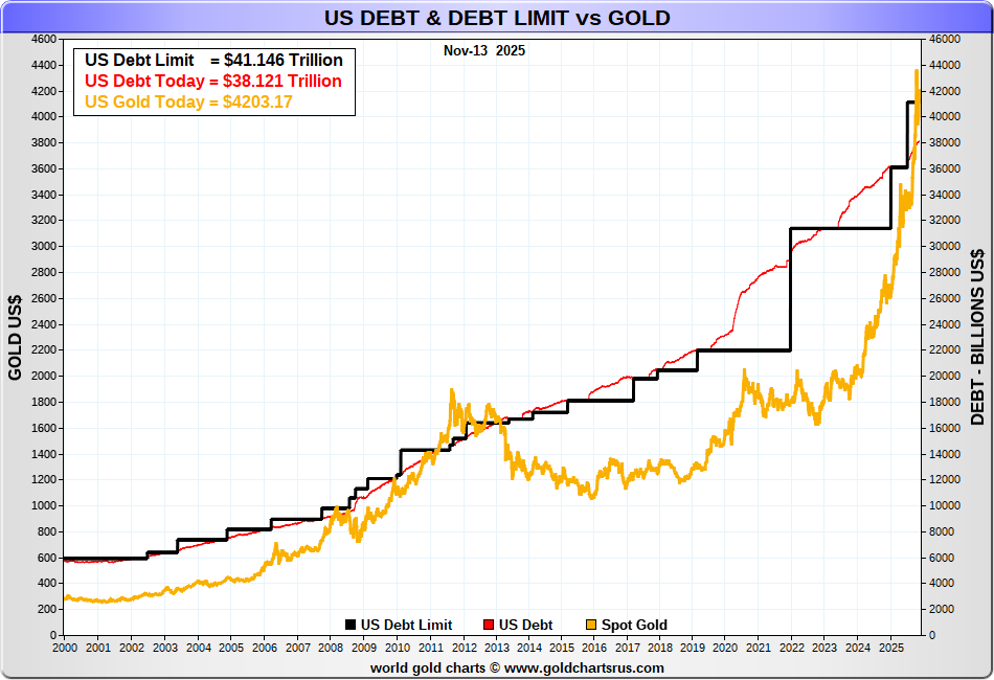
Source: www.goldchartsrus.com
The U.S. has the largest government debt in the world, currently at $38.2 trillion. That represents about 12% of all the debt in the world and 34% of all government debt in the world. The budget deficit of roughly $1.8 trillion adds to that deficit every year. It is projected to rise to at least $2.0 trillion. A promise to pay eligible citizens a so-called tariff dividend of $2,000 each could add $300 billion to the deficit. The U.S. debt currently represents 121% of GDP.
The budget deficit represents 5.6% of GDP, one of the highest in the world. The U.S. has the distinction of holding not only the highest debt of any G7 country, but their budget deficit to GDP is also the highest in the G7. It’s small consolation that the U.S. debt to GDP trails both Japan and Italy in the G7.
In some respects, it is good that the U.S. has a current debt limit of $41.146 trillion. At current rates, we could hit that target within the next year. When that happens, Congress must vote to increase the debt limit; otherwise, the U.S. could default.
As the U.S. debt has increased, so has the price of gold. But the world was taken off the gold standard in August 1971 by former President Richard Nixon. Since August 1971, the U.S. federal debt has increased by $37.8 trillion or roughly 9,270%. In August 1971, gold was at $42.80. The gold price has increased 9,820% showing that, as the U.S. debt rose, so did the price of gold.
U.S. Debt and Gold
| U.S. debt ($billions) | $38,193.2 |
| U.S. gold reserves (ounces/millions) | 286.9 |
| Current valuation of U.S. gold reserves ($42.22) $millions | $11,041 |
| Current valuation of U.S. gold reserves ($4,203) $millions | $1,205,840.7 |
| Current valuation of gold as a % of U.S. debt | 3.2% |
| Current valuation of gold as a % of GDP | 3.8% |
| Current debt/GDP | 121.0% |
| Price of gold to cover 10% U.S. debt | $13,310 |
| Price of gold to cover 40% U.S. debt | $53,250 |
| Price of gold to cover 100% U.S. debt | $133,120 |
Source: www.usdebtclock.org, www.federalreserve.gov
There has been talk of revaluing gold upward to help pay down the sovereign debt. Call it Bretton Woods 2. The premise is many believe that the U.S. has reached the point of no return regarding its debt. Today the U.S. pays more in interest on the debt, last estimated at $968.7 billion, vs. defence spending, officially reported as $925.5 billion. As some describe it, the Rubicon has been crossed.
This table shows what the gold price would have to be to cover 10% of the U.S. debt, 40% and 100%. These are approximations and, in some respects, represent pie in the sky as there has been no official move to revalue gold upwards. But it has been discussed as a possibility to deal with the monstrous debt. Will it happen? That question remains to be answered.
Markets & Trends
| % Gains (Losses) Trends | ||||||||
| Close Dec 31/24 | Close Nov 14/25 | Week | YTD | Daily (Short Term) | Weekly (Intermediate) | Monthly (Long Term) | ||
| S&P 500 | 5,881.63 | 6,734.11 | 0.1% | 14.5% | neutral | up | up | |
| Dow Jones Industrials | 42,544.22 | 47,147.48 (new highs) * | 0.3% | 10.8% | up (weak) | up | up | |
| Dow Jones Transport | 15,894.75 | 16,072.56 | (0.8)% | 1.1% | up | neutral | up | |
| NASDAQ | 19,310.79 | 22,900.59 | (0.5)% | 18.6% | down (weak) | up | up | |
| S&P/TSX Composite | 24,796.40 | 30,326.46 (new highs) * | 1.4% | 22.6% | neutral | up | up | |
| S&P/TSX Venture (CDNX) | 597.87 | 879.88 | (0.6)% | 47.2% | down | up | up | |
| S&P 600 (small) | 1,408.17 | 1,423.38 | (1.0)% | 1.1% | down | up | up | |
| MSCI World | 2,304.50 | 2,873.27 | 1.7% | 24.7% | down (weak) | up (weak) | up | |
| Bitcoin | 93,467.13 | 94,869.65 | (8.3)% | 1.5% | down | down (weak) | up | |
| Gold Mining Stock Indices | ||||||||
| Gold Bugs Index (HUI) | 275.58 | 615.20 | 6.2% | 123.2% | neutral | up | up | |
| TSX Gold Index (TGD) | 336.87 | 742.39 | 6.3% | 120.4% | up (weak) | up | up | |
| % | ||||||||
| U.S. 10-Year Treasury Bond yield | 4.58% | 4.15% | 1.2% | (9.4)% | ||||
| Cdn. 10-Year Bond CGB yield | 3.25% | 3.23% | 1.6% | (0.6)% | ||||
| Recession Watch Spreads | ||||||||
| U.S. 2-year 10-year Treasury spread | 0.33% | 0.54% | 0.9% | 63.6% | ||||
| Cdn 2-year 10-year CGB spread | 0.30% | 0.74% | 1.4% | 146.7% | ||||
| Currencies | ||||||||
| US$ Index | 108.44 | 99.26 | (0.3)% | (8.5)% | up (weak) | down (weak) | down | |
| Canadian $ | 69.49 | 0.7131 | 0.1% | 2.6% | down (weak) | neutral | neutral | |
| Euro | 103.54 | 116.24 | 0.5% | 12.3% | neutral | up (weak) | up | |
| Swiss Franc | 110.16 | 125.93 | 1.4% | 14.3% | up | up (weak) | up | |
| British Pound | 125.11 | 131.73 | 0.1% | 5.3% | down | neutral | up | |
| Japanese Yen | 63.57 | 64.70 | (0.6)% | 1.8% | down | down | down | |
| Precious Metals | ||||||||
| Gold | 2,641.00 | 4,082.63 | 2.0% | 54.6% | up | up | up | |
| Silver | 29.24 | 50.62 | 4.7% | 73.1% | up | up | up | |
| Platinum | 910.50 | 1,545.10 | 0.2% | 69.7% | down (weak) | up | up | |
| Base Metals | ||||||||
| Palladium | 909.80 | 1,405.50 | 0.4% | 54.5% | down (weak) | up | up (weak) | |
| Copper | 4.03 | 5.04 | 2.0% | 25.1% | up | up | up | |
| Energy | ||||||||
| WTI Oil | 71.72 | 59.98 | 0.2% | (16.4)% | down (weak) | down | down | |
| Nat Gas | 3.63 | 4.51 | 4.4% | 24.2% | up | up | up | |
Source: www.stockcharts.com
Source: www.stockcharts.com
The end of the government shutdown, rate cuts dancing in their eyes, and a proposal for 50-year mortgages should have made this another up week for the stock markets. The government may have ended the record-breaking 43-day shutdown, but the chaos and fallout over the shutdown is unlikely to change. The end of the shutdown also exposed a deep rift in the Democrats. Rate cuts turned to possibly no rate cuts as the Fed expressed reservations about a cut, given the uncertainty over no key economic numbers this past six weeks.
Especially missing were the job numbers, where no release came for September or October. A release may never come. Instead, we look forward to December 5 when we hope the November numbers are out. But will they be meaningful? Meanwhile, layoffs are mounting. The suggestion was that these numbers may never be released, leaving a big hole in economists’ forecasts.
The proposal for 50-year mortgages was widely panned. Instead, Trump was overwhelmed by the possible release of the Epstein files and a growing rift over them in the MAGA crowd. A backlash over rising food inflation prompted a walk-back by Trump to remove tariffs on some food imports. Things got worse as Republicans were mostly wiped out in a series of elections on November 4. Especially galling for the Republicans was the election of Zohran Mamdani in New York City. Word came that the tariffs might not sit well with the Supreme Court. However, the biggest setback was the growing Epstein scandal, the scandal that won’t go away.
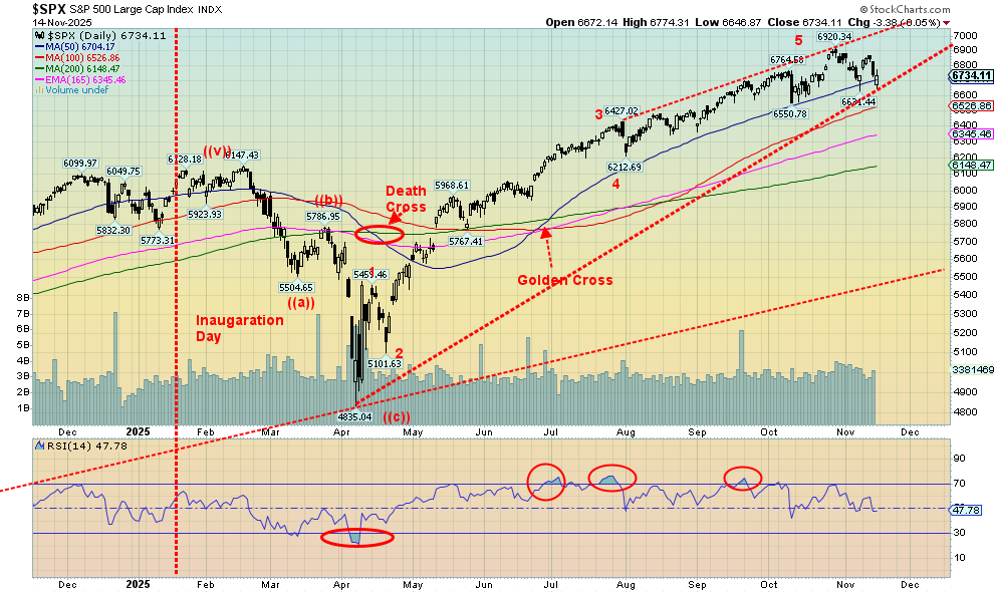
Stock markets were mixed this past week. The S&P 500 rose a small 0.1%, the Dow Jones Industrials (DJI) made new all-time highs but closed up only 0.3%, while the Dow Jones Transportations (DJT) fell 0.8%. Rotation continued out of the high-flying AI stocks into blue chips as the NASDAQ fell 0.5%. The S&P 400 (Mid) fell 1.2% and the S&P 600 (Small) was off 1.0%. Meanwhile, the S&P 500 Equal Weight Index fell 0.2% while the NY FANG Index dropped 0.4%.
The MAG7 struggled. Google made all-time highs but closed down 1.0%, Meta dropped 2.0%, Amazon was off 4.1%, Tesla was dumped 5.9%, Apple was up 1.4%, Microsoft gained 2.7%, while Nvidia was up 1.1%. Elsewhere, Alibaba fell 7.5% and Baidu was off 7.9%. But the most glaring one was Trump Media (DJT) that crashed faster than Trump’s ratings, down 15.5% to new all-time lows.
In Canada, the TSX eked out a tiny new all-time high and closed up 1.4%. The TSX Venture Exchange (CDNX) struggled, down 0.6%. In the EU, the London FTSE made all-time highs again and held on to a 0.2% gain. The EuroNext was up 2.2% to new all-time highs, the Paris CAC 40 also made all-time highs, up 2.8%, while the German DAX didn’t join the all-time high party but did gain 1.3%. In Asia, China’s Shanghai Index (SSEC) was down a small 0.2%, the Tokyo Nikkei Dow (TKN) was up 0.2%, while Hong Kong’s Hang Seng (HSI) gained 1.3%. The MSCI World Index (ex USA) gained 1.7%.
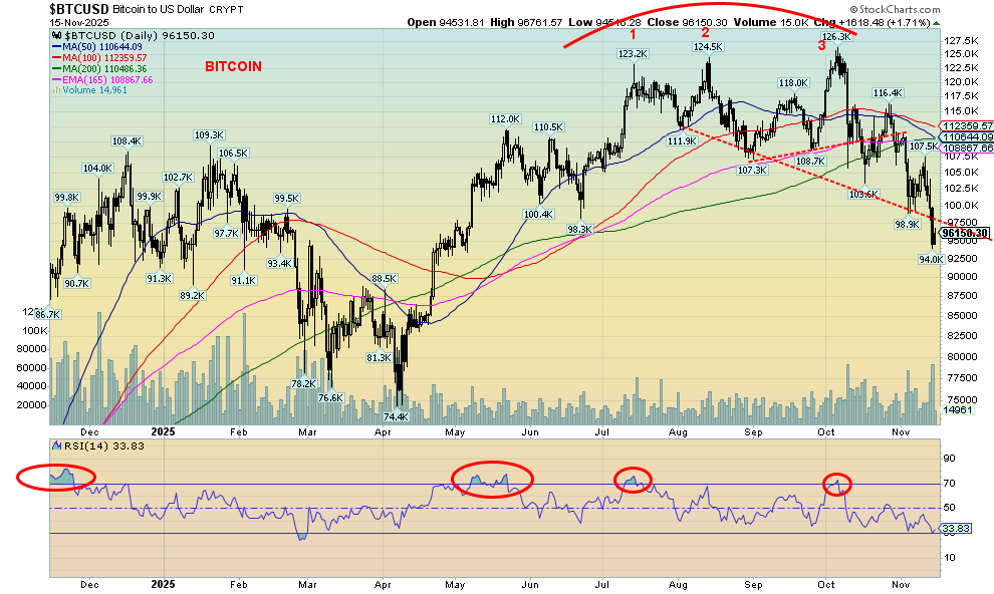
Lest we forget, Bitcoin closed under $100,000, losing 8.3%. Are Bitcoin’s glory days behind it again? The $100,000 mark was a psychological point. Bitcoin is down almost 24% from its all-time high, now ensconced in a bear market. An omen?
Significantly, for the S&P sub sectors Energy gained 4.0% but Information Technology fell 3.8%. Rotation? The DJI leaped over 48,000 but settled back down by the week’s end with a couple of sharp down days.
The 50-day MA continues to hold the S&P 500 up for the moment. But it’s threatening to break. Under 6,550, a further drop could be seen down to possibly 6,200. Below 6,200, a steeper decline could get underway. Only new highs will save this market now. Is the party over?
Source: www.stockcharts.com
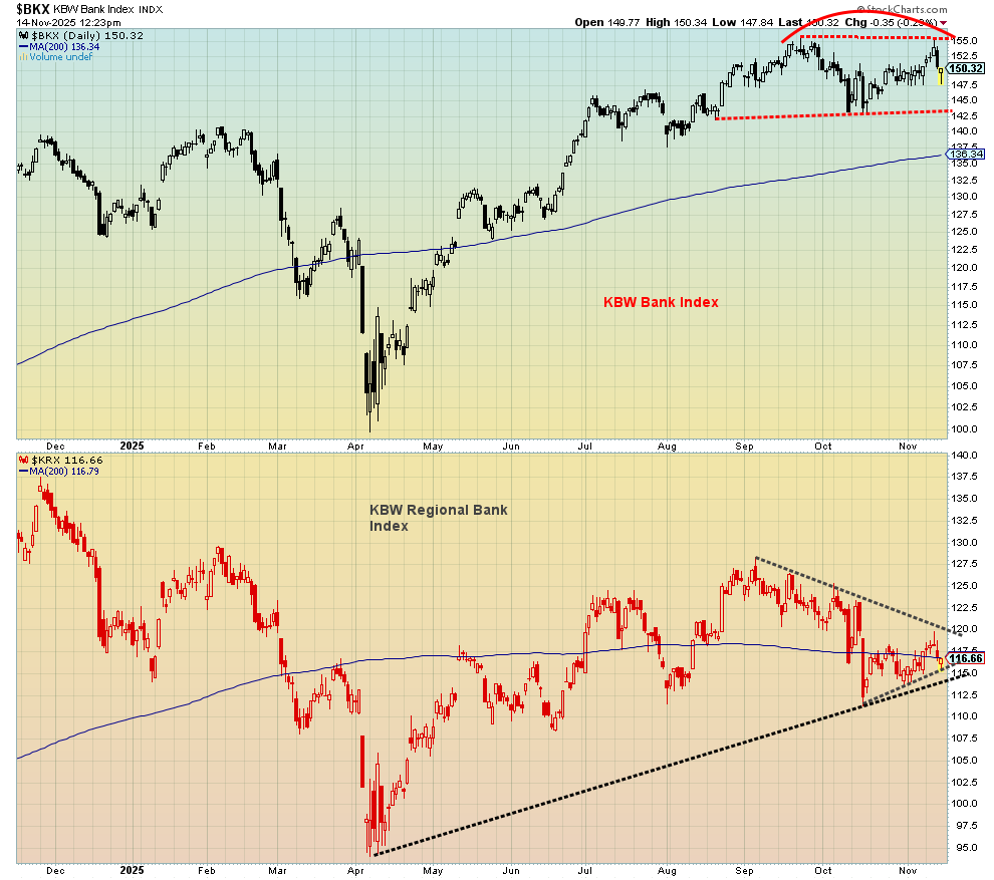
The charts of the KBW Bank Indices don’t look very healthy. The KBW Bank Index is forming what might be a double top. It breaks down under 143 and in theory could suggest a drop to 129. The KRX Regional Bank Index looks even weaker, given it is currently in a downtrend. A triangle has formed. A breakdown under 115 could suggest a drop to 98.
The KRX Index is already under the 200-day MA. The KRX Index is down about 17% from its all-time high while the BKX Index is down about 4% currently. There are regional banks already in trouble with bad loans, fraud, and more. Could that spread to the large money center banks? They are much better capitalized today than at the time of the 2008 financial crisis. But that doesn’t mean they are immune.
Source: www.stockcharts.com
Things don’t look good for Bitcoin. It fell under $100,000, closing at $96,150. We are down almost 24% from the highs, in bear market territory. We are under the 200-day MA. We broke down under that lower trendline. Three small highs, then – poof. Targets could be $71,500. Ouch. That’s down 43% and under that April low. Not good for the crypto fans.
Source: www.stockcharts.com
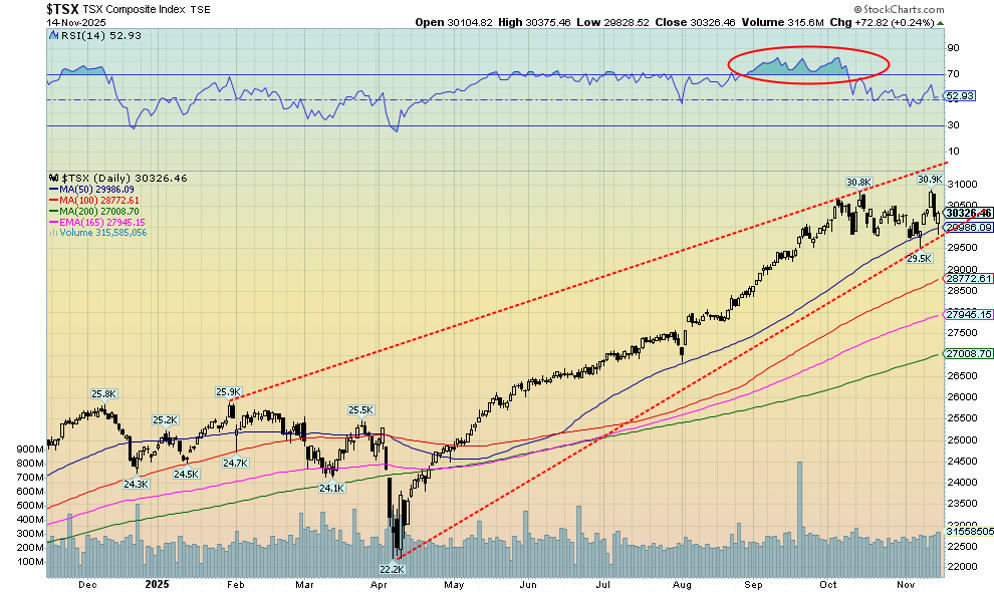
The TSX Composite eked out new all-time highs this past week, rising 1.4%. But then came Thursday/Friday and we fell. Have we topped? The new highs (barely) may suggest a double top. We need to break under 29,500 to suggest a high is in. We closed at 30,326. Nine of the 14 sub-indices closed higher on the week with Golds leading the way, up 6.3%. Metals & Mining gained 3.2% while Materials rose 5.4%.
The big losers were Health Care (THC), down 5.8%, and Information Technology (TTK), down 3.1%. Do we have a divergence? While the TSX made (barely) new all-time highs, the TSX 60 did not. The TSX reversed itself on Friday: after being down on the day we rebounded and closed higher. We can’t say we like the pattern and a firm break under 29,500 could send us tumbling to 28,000. Firm new highs turn things up again. Resistance is at 31,000.
U.S. 10-year Treasury Note, Canada 10-year Bond CGB
Source: www.tradingeconomics.com, www.home.treasury.gov, www.bankofcanada.ca
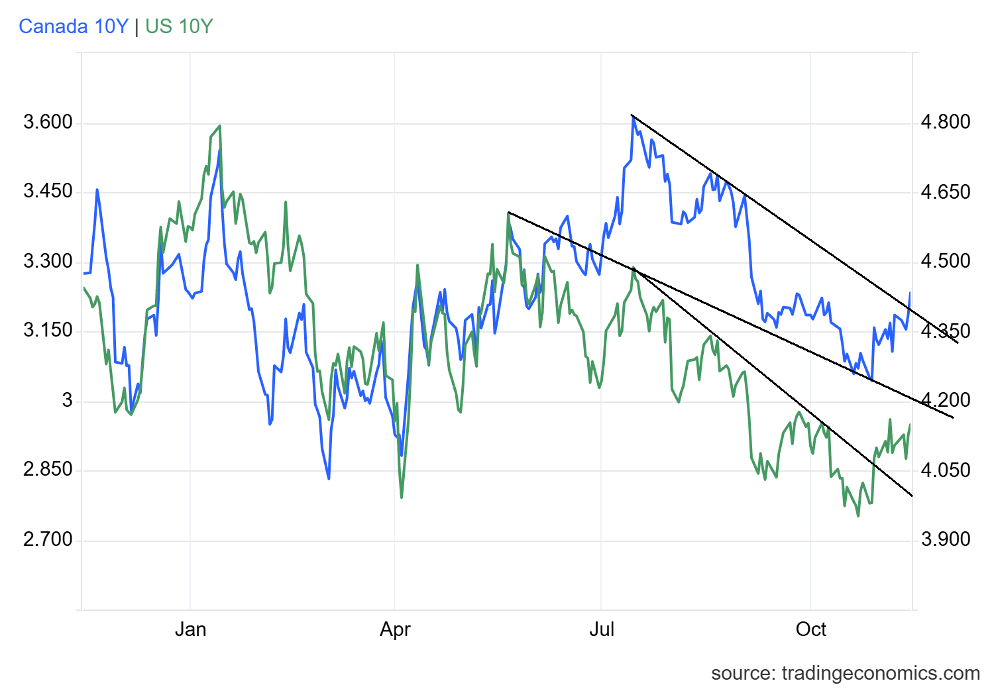
Bond yields rose this week, partly in response to talk that a rate drop in December may not happen. According to officials, there remains huge doubt as to the economic numbers, which we never saw because of the shutdown. Even Press Secretary Karoline Leavitt expressed doubts that we’ll ever see the missed numbers. Because of the shutdown, we have now gone two months with no job numbers. Yet layoffs are piling up and, despite the end of the shutdown, turmoil and chaos might remain for a while. The probability of a rate cut in December fell to 50% from 65%. Bond yields rose, then fell.
The U.S. 10-year Treasury note closed up 4bp to 4.15% after hitting a high of 4.21%. We now appear to be breaking out of that downtrend line from the July high but need to break the downtrend line from the May high. A break and close over 4.20% would suggest to us we are headed higher. The Canadian Government 10-year bond (CGB) rose 5bp to 3.23% this past week. That’s a response most likely to the budget that predicts a larger deficit. The CGB broke its downtrend line from May, suggesting we could move even higher. However, budget deficits in Canada and endless spending in the U.S. suggest to us that we could move higher in yield. Higher bond yields would upset the apple cart.
Source: www.stockcharts.com
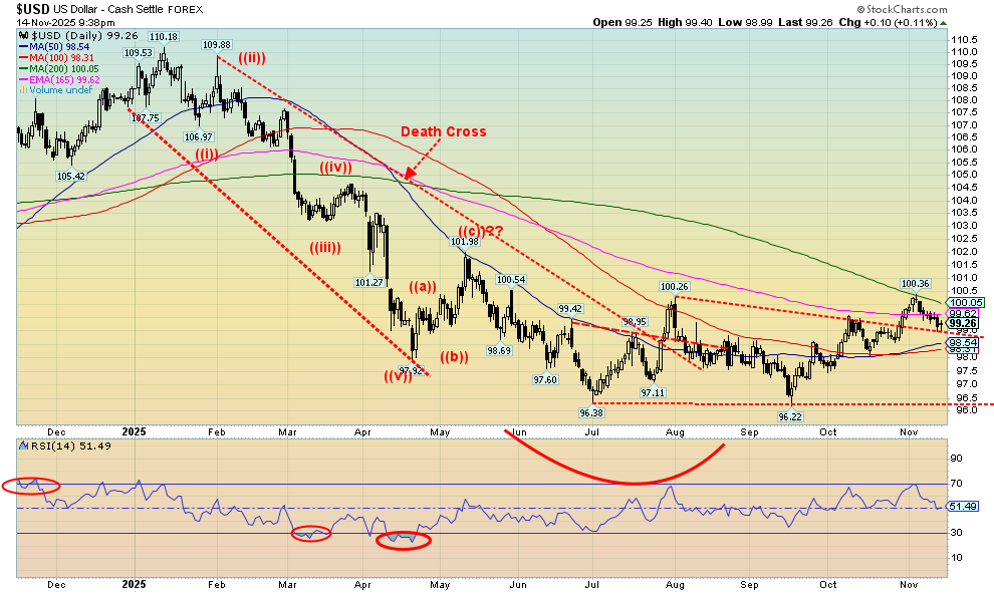
Follow-through for the US$ Index on the breakout of what appeared as a bottom pattern has been feeble and now appears to be failing. Nonetheless, we are at support, just above 99.00. A firm break of 99.00 would suggest we are headed lower. We don’t know if a low is in until we get back over 100.40.
On the week, the US$ Index fell 0.3%, the euro was up 0.5%, the Swiss franc was up 1.4%, the pound sterling was up 0.1%, but the Japanese yen fell 0.6%. The Cdn$ was up just under 0.1%, following the budget. The US$ Index is well defined here. A break under 99 and we’re probably headed lower. A breakout above 100.40 and we are headed higher, maybe as high as 103.
Source: www.stockcharts.com
Rate cut or no rate cut, that is the question. Expectations were for a rate cut in December and the government shutdown chaos continuing. Nope. Cold water was thrown on the rate cut expectations and, officially at least, the government shutdown has ended. It may have ended but the chaos is expected to continue, certainly for a while. A lot of animosity was built up over the shutdown, which lasted a record-breaking 43 days. As well, the Epstein scandal continues to slowly envelope President Trump.
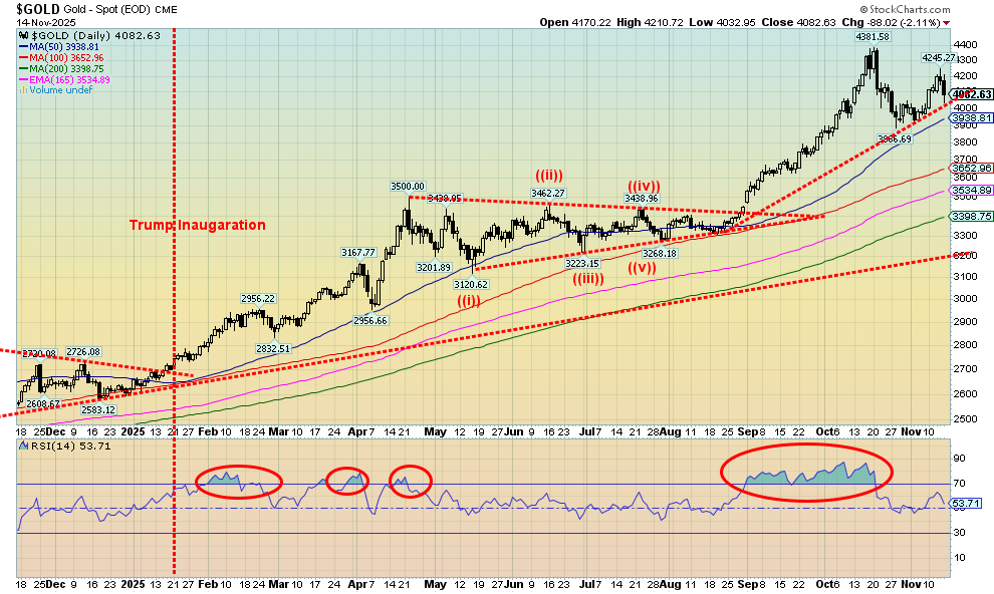
Gold was crawling back towards the all-time highs at $4,381 but then failed and Thursday/Friday saw a sell-off. Still gold managed to gain 2.0% on the week. Silver rose 4.7%, while platinum was up a small 0.2%. Palladium gained 0.4% and copper jumped 2.0%. The gold stocks were excited as the Gold Bugs Index (HUI) rose 6.2% and the TSX Gold Index (TGD) was up 6.3%. But the reversal on Thursday/Friday suggests we might not make it new highs, at least not yet. It is not clear on the gold chart, but the silver chart may have made a double top. Nonetheless, a breakdown under the recent low at $3,887 could suggest we are headed lower with possible targets down to around $3,400. There is support at $3,900, then down to $3,700.
We knew going in that the November/December period was a weak one for the precious metals. So far, we are on schedule. A final low is probably not due until December and, as noted, $3,700 might not be an unreasonable target. The RSI is neutral at 53.70. We need to get under 30 to suggest that a low might be in.
Source: www.stockcharts.com
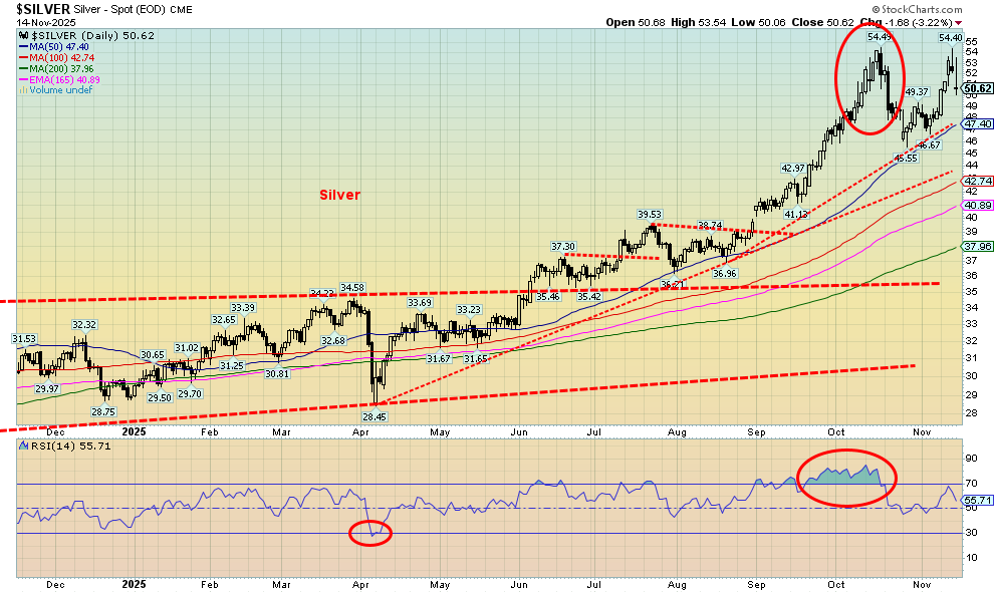
As with gold, silver rose with the government shutdown and expectations of a December rate cut. It unravelled when the shutdown ended and expectations dropped for a rate cut. Silver rose 4.7% on the week but closed Friday down 3.2% after hitting a high of $54.40. That print left us just shy of the previous high at $54.49 seen in October. This now raises the spectre of a possible double top.
The neckline breaks around $47.40 and, if it is a real double top, potential targets are $38.50. Minimum targets would be $45.30 or $44. A break to $42 can’t be ruled out. Only new highs would determine the next move. And right now, we appear to be failing it. That’s the bad news, but we still expect gold/silver rally to continue into 2026.
Source: www.stockcharts.com
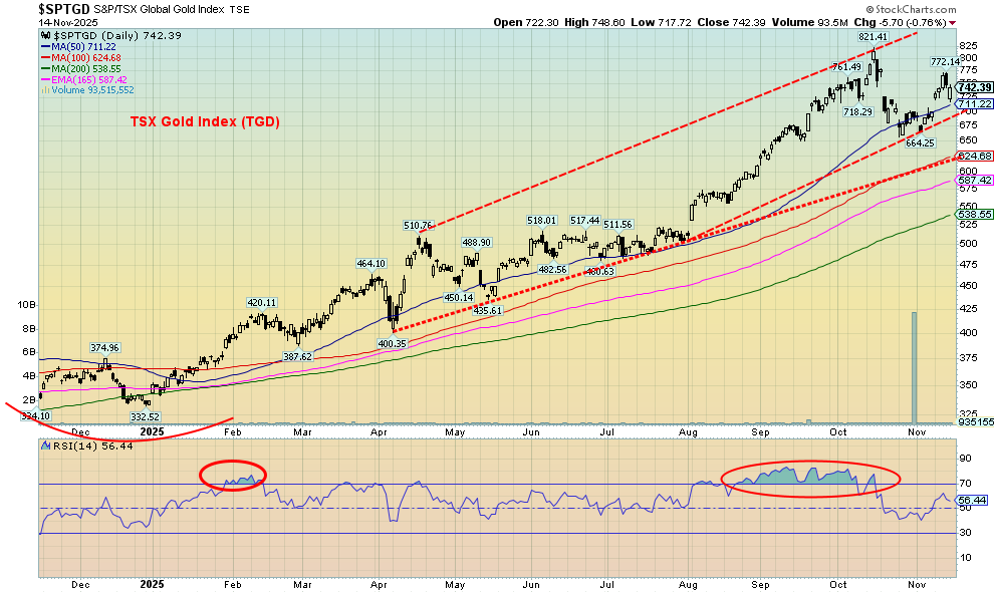
The gold stocks enjoyed a good up week with the TSX Gold Index (TGD) gaining 6.3% while the Gold Bugs Index (HUI) was up 6.2%. We also saw more positive action in the junior developer gold miners, although none were mentioned in the Liberal budget as being recipients of investment. The budget concentrated more on critical mineral projects. At the end of the week, the TGD sold off on what was probably profit-taking.
The concern here is that a failure would suggest once we break back under 664 a drop to 624 is likely. Under that level we could fall further. Failure to achieve new highs on this rally is a negative sign. Of course, we haven’t broken down yet, so thoughts of new highs can stick with us. But the sell-off on Thursday/Friday was a negative sign. Only new highs above 821 would tell us the low on this correction is in.
Source: www.stockcharts.com
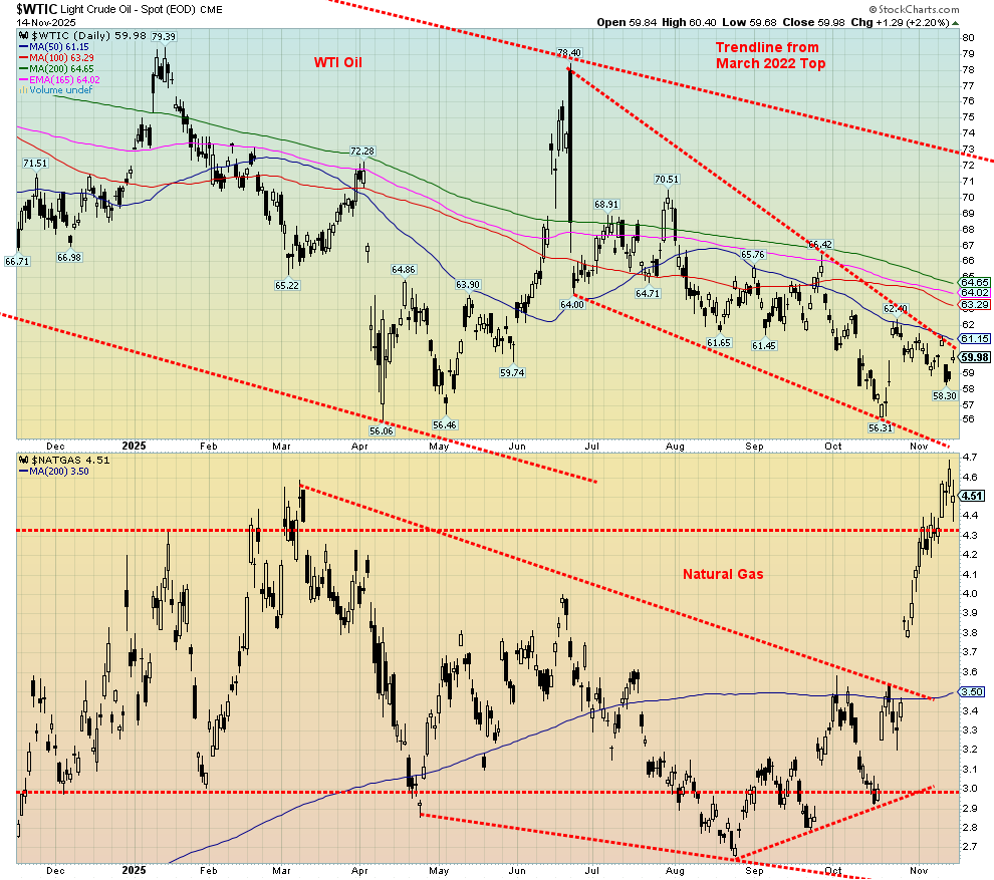
An attack on the Russian Black Sea port sparked a temporary spike in oil prices. However, by the week’s end WTI oil was largely back where it started. The world continues to be oversupplied with oil and IEA is predicting a glut of 4.1 million b/d in 2026. The result: a pop and nothing more. On the week, WTI oil closed up under 0.2%. Brent crude fared a bit better, up 0.9%.
Divergence in natural gas (NG) continues as NG at the Henry Hub rose 4.4% but NG at the EU Dutch Hub fell 0.5%. At the Henry Hub NG had been up more, but then the announcement that storage was larger than expected pushed prices back down. Helping NG are expectations of a colder winter. Strong flows and storage in the EU kept NG there to stay down.
However, the energy stocks didn’t seem to care as the ARCA Oil & Gas Index (XOI) rose 3.4% and Canada’s TSX Energy Index (TEN) jumped 4.6% to fresh 52-week highs. Are the energy stocks suggesting a rise in energy prices going forward?
Threats are being made against Venezuela by the U.S. government. Venezuela holds the world’s largest oil reserves and is the world’s 12th largest oil producer. An attack on Venezuela would we suspect send oil prices higher.
WTI oil failed at that breakout line, so another test of the lows could be underway. The breakout now is at $61, but to truly break out we must get above $65 and then the bigger line at $73. Has NG spiked? It’s hard to say. Under $4.20, the odds are we’ve peaked for the time being. But it’s the stronger than expected stocks that has us looking at accumulating oil and gas stocks.
Copyright David Chapman 2025
__
(Featured image by Lo Lo via Unsplash)
DISCLAIMER: This article was written by a third party contributor and does not reflect the opinion of Born2Invest, its management, staff or its associates. Please review our disclaimer for more information.
This article may include forward-looking statements. These forward-looking statements generally are identified by the words “believe,” “project,” “estimate,” “become,” “plan,” “will,” and similar expressions, including with regards to potential earnings in the Empire Flippers affiliate program. These forward-looking statements involve known and unknown risks as well as uncertainties, including those discussed in the following cautionary statements and elsewhere in this article and on this site. Although the Company may believe that its expectations are based on reasonable assumptions, the actual results that the Company may achieve may differ materially from any forward-looking statements, which reflect the opinions of the management of the Company only as of the date hereof. Additionally, please make sure to read these important disclosures.
David Chapman is not a registered advisory service and is not an exempt market dealer (EMD) nor a licensed financial advisor. He does not and cannot give individualised market advice. David Chapman has worked in the financial industry for over 40 years including large financial corporations, banks, and investment dealers. The information in this newsletter is intended only for informational and educational purposes. It should not be construed as an offer, a solicitation of an offer or sale of any security.
Every effort is made to provide accurate and complete information. However, we cannot guarantee that there will be no errors. We make no claims, promises or guarantees about the accuracy, completeness, or adequacy of the contents of this commentary and expressly disclaim liability for errors and omissions in the contents of this commentary. David Chapman will always use his best efforts to ensure the accuracy and timeliness of all information. The reader assumes all risk when trading in securities and David Chapman advises consulting a licensed professional financial advisor or portfolio manager such as Enriched Investing Incorporated before proceeding with any trade or idea presented in this newsletter.
David Chapman may own shares in companies mentioned in this newsletter. Before making an investment, prospective investors should review each security’s offering documents which summarize the objectives, fees, expenses and associated risks. David Chapman shares his ideas and opinions for informational and educational purposes only and expects the reader to perform due diligence before considering a position in any security. That includes consulting with your own licensed professional financial advisor such as Enriched Investing Incorporated. Performance is not guaranteed, values change frequently, and past performance may not be repeated.


Argentina Introduces Automatic Authorization to Boost Crowdfunding and Investment Growth
The national government introduced automatic authorization for crowdfunding platforms, simplifying registration under CNV rules to speed investments and reduce bureaucracy....


Gilead’s $5 Billion Tubulis Deal Boosts Evotec Stake
Gilead is acquiring German biotech firm Tubulis for up to $5 billion, benefiting Evotec, which holds a 3.14 percent stake...


Switzerland Aligns Corporate Sustainability Rules with EU Standards
Switzerland proposes new sustainability rules to align with European Union standards. The law targets large companies, requiring ESG reporting and...


Bitcoin Leads Crypto Rally as Iran Ceasefire Boosts Markets
The US and Iran agreed to a two-week ceasefire, boosting crypto markets. Bitcoin surged above $71,500, Ethereum topped $2,200, while...


ECSP Crowdfunding vs. eWpG Bonds: Overcoming SME Financing Limits
The ECSP Regulation limits annual crowdfunding per project promoter to €5 million, requiring a full prospectus for higher amounts, which delays...
 |
|
 |  |
 |
|
-

 Fintech2 days ago
Toss Explores Blockchain Mainnet to Power Next-Generation Financial Services
-

 Cannabis1 week ago
Poland Proposes Cannabis Decriminalization: 15 Grams and One Plant Without Penalties
-
 Fintech1 week ago
Credibur Scales Rapidly: €2 Billion in Structured Debt Facilities in Six Months
-

 Impact Investing2 weeks ago
Ridemovi Secures Financing to Drive European Expansion and Sustainable Mobility Growth