Markets
Oil Shock Risks: How Conflict with Iran Could Impact Markets
War in Iran raises economic and market risks mainly through oil price spikes. Past energy shocks sometimes caused recessions and major stock declines, while others led only to slowdowns. Today the global economy is less oil-dependent than in the 1970s, so impacts may be milder. Meanwhile, Enerflex Ltd. could benefit from higher energy prices.

The only story right now appears to be the war in Iran. Who’s Epstein? That the invasion was illegal under international law and the UN is moot. It’s happening and the coalition of the willing is two – the U.S. and Israel. Setting aside the geopolitics, the global concern turns on the economics and its impact on the markets.
Markets can certainly see the risk. But what’s unknown is the scale and how is it transmitted. Paraphrasing Donald Rumsfeld (Secretary of Defense during the administration of George W. Bush) during another invasion of Iraq in 2003, the current situation is a “known unknown.” The biggest unknown unknown is what lies ahead.
Events like this have been known to spike oil prices and even spark recessions. Are we headed there? Earlier events include:
- 1973–1974. Oil prices tripled/quadrupled after the Arab Oil Embargo (October 1973) that followed the disastrous Yom Kippur War that saw the Arab nations lose to Israel. The stock market fell 40%–50% into a low in 1974. A steep recession followed during 1973–1975 with U.S. GDP falling 3.5%, the steepest since the Great Depression. Stagflation became a household word.
- 1979–1980. Oil prices doubled/tripled after the Iranian revolution. Fed Chair Paul Volcker hiked the Fed rate to unheard-of levels to bring down the rate of inflation. The U.S. suffered a double-dip recession, first in 1980 as GDP contracted 2.2%, followed by a brief respite, and then a steeper recession (1981–1982) where GDP contracted 2.7%. The stock market fell over 25%.
- 1990. Iraq invaded Kuwait followed by the U.S. and a coalition bombing Iraq. Oil prices doubled. A recession followed with GDP falling 1.4%. The stock market fell roughly 20%.
- 2008–2009. Oil prices had spiked to record highs in 2007–2008, thanks to sharply increased demand from Asia. While not the main cause, high oil prices did play a role during the 2008 financial crisis and the subsequent recession that saw U.S. GDP contract 5.1%, primarily because of the financial crisis, while the stock market fell 55%. Oil crashed down 76% from its 2008 high.
- 2022. Oil surged some 60% after the Russian invasion of Ukraine. The Fed was forced to hike interest rates to combat growing inflation that occurred after the pandemic of 2020–2021. There was no recession, although a slowing was seen. The stock market fell some 25%. Following the price spike oil prices collapsed due to a glut of oil worldwide.
So, what now? So far, oil is only up by about 36% from a low in December 2025. Not earth-shattering like earlier oil spikes. To double that low, we’d have to get to $110 and even that is below the spike 2022. So, while oil prices are up and gas at the pump will creep higher, so far it’s not enough to spark a recession.
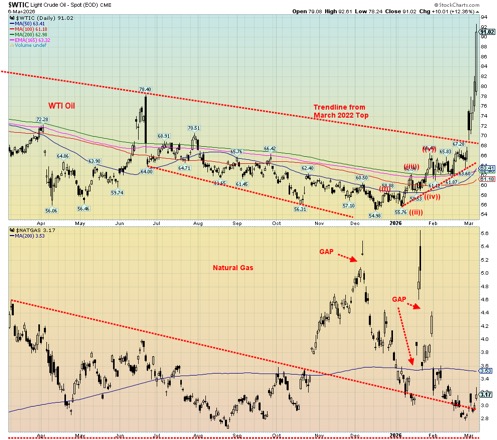
Weekly WTI Oil 2021-2026
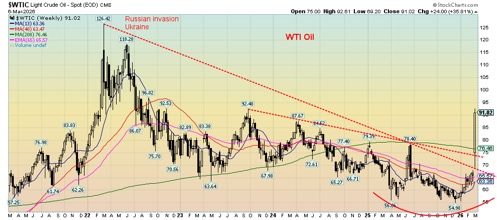
Our weekly chart of oil since 2021 shows that we have breached the downtrend line from that 2022 high. Then we quickly moved higher, closing at $92.02, by week’s end. As a result, we are beginning to break out from the entire pattern seen since mid-2023. What will this coming week bring as the war against Iran drags on?
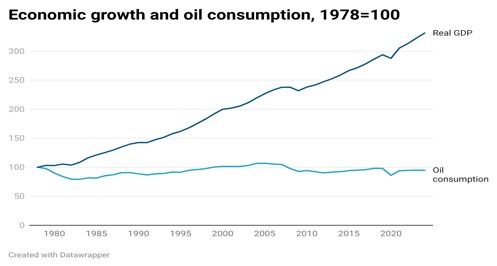
Today, oil does not have the same impact on the economy that it did back in 1973. Oil was a much bigger part of the economy then. As a result, it will require considerably higher oil prices to have the same impact as price spikes in 1973, 1979, 1990, and 2008. The chart on economic growth vs. oil consumption shows that the economy, real GDP, has tripled since 1978 but oil consumption, adjusted for population growth, has stayed mostly flat. Adding to it is that cars are more fuel-efficient today and natural gas (NG) has replaced oil in a number of cases.
Another way to look at it is the inflation-adjusted price of oil at those peaks. Interestingly, the 1974 peak is now below today’s price on an inflation adjusted basis. The outlier is the 2008 peak where oil prices would have to soar to over $220 to hit that inflation-adjusted level.
As we noted, high oil prices were not at the heart of the 2008 financial crash and the 2007–2009 steep recession, even as they did play a role. And high oil prices have less of an impact on the economy than they did back in the 70s, 80s, and 90s. Reaching over $200 could have an impact. But note that even the spike in 2022 did not spark a recession, even as the stock market sold off roughly 25%.
| Peak oil price, nominal ($US) | WTI oil today, adjusted for inflation ($US) |
| 1973–1974: $11.65 | $76.85 |
| 1979–1980: $39.50 | $154.50 |
| 1990: $41.15 | $102.40 |
| 2008–2009: $147.27 | $222.50 |
| 2022: $126.42 | $140.50 |
Where does the oil go that comes through the choke point of the Straits of Hormuz? Predominantly Asia, although a considerable portion goes to Europe as well. China and India are the two main receivers while Saudi Arabia exports the most, followed by Iraq. Saudi Arabia and the UAE have been a big source of the glut of oil that has dominated markets for the past few years. Now that is blocked behind the Straits. China has been an aggressive buyer of oil to add to its strategic reserves.
Iran used to be a major supplier, but sanctions and economic woes have cut that back. Still, Iran is a member of OPEC. China has other sources, mostly from Russia that comes overland via railroad. Interestingly, there is also a railway that runs from Iran through the ‘Stans’ to China, a project from the Belt and Road Initiative.
Market reaction to the invasion has been mostly as predicted. Stock prices have fallen 3.4% (S&P 500) from just before the invasion but bounced back, oil has jumped 65% from December 2025 lows, the US$ Index is up 3.5% at its recent peak from recent lows, while gold jumped 2.7% initially but then collapsed 4% on March 3, thanks to a higher USDX and bond yields. The VIX Volatility Index initially leaped by about 42% but then fell back when the stocks bounced back. However, the sell-off this past week has pushed the VIX Volatility Indicator up once again.
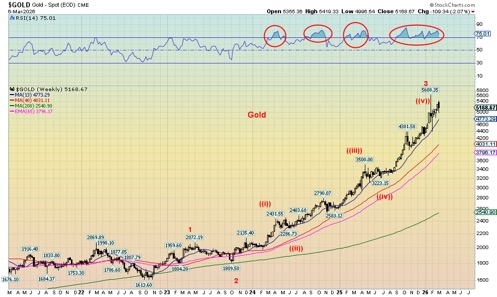
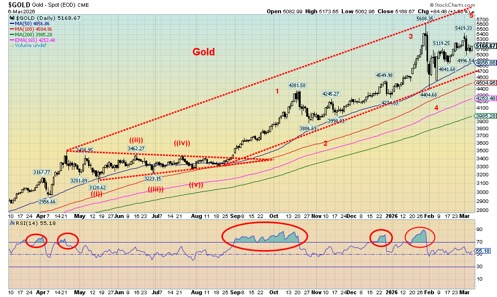
Our weekly chart of gold below shows an incredible up wave from that key low in 2022. So far, we see three waves: wave one up, wave two down, and wave three up. We now appear to be working on the fourth wave which is a down wave. This wave is incomplete. We don’t see this wave making its final low until at least the spring solstice on March 20–23. A more extended correction/consolidation period could take us into May. It depends a lot on the US$ Index and bond yields, both of which have jumped recently.
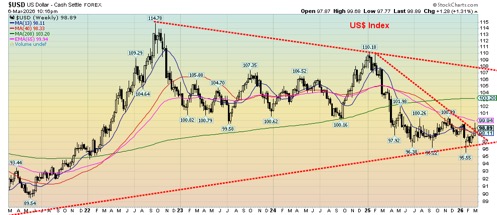
The following chart of the US$ Index indicates it appears to be breaking out of that downtrend that has been in place since early 2025. There is resistance up to 100, but if we can break out over that line then a run to 103 and the four-year MA is possible. The U.S. dollar is regarded as a safe haven during war, even though the U.S. is at the centre of the war.
Our weekly chart of the S&P 500 also shows that we may have completed five waves up from the 2022 low. We have been rolling over for several weeks now. However, we still need to break down under 6,500 and 6,400 to cause a real break that could take us to support near 5,600. A decline that far would be a roughly 20% decline. War can disrupt things. But it can also move fast and change quickly. There are both economic and market risks to this war and events can change swiftly.
Weekly Gold 2021-2026
Weekly US$ Index 2021-2026
Weekly S&P 500 2021-2026
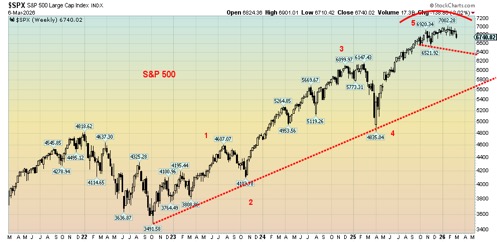
Chart of the Week
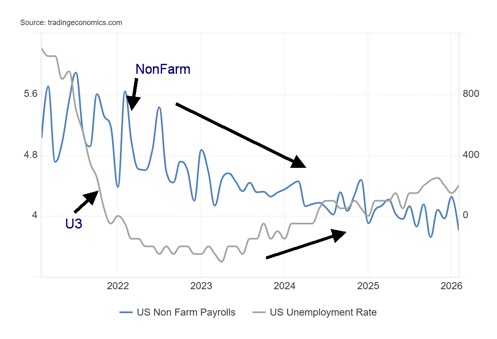
Going into this month’s nonfarm/employment reports, we were worried that nonfarm might come in well above expectations. After all, the firing of key people by the Trump administration calls into question the reports coming out. No worries. Instead, we came in well below expectations. Yes, it was the worst nonfarm payrolls report in four months. The U.S. economy shed 92,000 jobs in February after a downwardly revised January of 126,000.
It was worse than the expected gain of around 60,000 jobs. Full-time employment lost 100,000 jobs and part-time jobs lost 249,000. We know – it doesn’t add up, but then we are dealing with two different surveys. The Establishment Survey only contacts business for their numbers. That gives us nonfarm. The Household Survey calls households. That gives us everything else and, yes, the two can diverge.
The job losses were predominantly in health care and government. But virtually every category saw losses, except for social assistance. In 2024, the last year of the Biden administration, 1,459,000 jobs were created. Since the Trump administration took over in January 2025 job growth has been 150,000 for 14 months. Blame was put on striking health care workers and the bad weather. There have also been numerous layoff announcements, with some citing AI as a reason.
It has been a steadily deteriorating situation. Last month saw the civilian labour force up by 18,000. The unemployment level rose 202,000. The unemployment rate (U3) rose to 4.4% from 4.3% but oddly the U6 unemployment rate, the highest reported by the BLS (U3 + all persons marginally attached to the labour force, plus total employed part-time for economic reasons, as a percent of the civilian labour force, plus all persons marginally attached to the labour force) actually fell to 7.9% from 8.1%. The labour force participation rate fell to 62% from 62.1% while the employment population ratio dropped to 59.3% from 59.4%.
Interestingly, the number of multiple-job holders fell by 352,000 while the not in labour force category fell 504,000. The largest portion of them are retired, along with the disabled. The number unemployed 27 weeks or longer rose by 122,000 while the average period unemployed rose to 25.7 weeks from 23.7 weeks and medium weeks unemployed went up to 11.2 weeks from 10 weeks. The big drop in part-time employment reflects layoffs in the leisure and hospitality industries.
The report puts the Fed in a bind. Unemployment is rising but inflation is sticky, high, and could rise further thanks to the war against Iran that has engulfed the region. Oil prices have jumped sharply. The Fed’s next meeting on March 17–18 ought to be interesting. The Fed will face a quandary and a fight between the hawks and the doves.
Markets reacted as stocks fell, gold rose somewhat, and gold stocks fell sharply initially, then bounced back. Bitcoin fell and the US$ Index rose, then fell. Bonds bounced back a bit (yields down).
All this makes the January surprise numbers look like a one-off. As noted, it was revised downward. Oddly enough, earlier in the week the ADP Employment rose 63,000, well above the expected 19,000 and last month’s 11,000. The two reports can diverge as the ADP employment generally only covers the private sector. Nonfarm payrolls private fell 86,000.
Overall, this was not a great report. And the Fed will be in a bind as to what to do. Cut, hike, or stand pat?
Canada reports its job numbers this coming week. The forecast is for a loss of 15,000 jobs and the unemployment rate to rise to 6.7%.
Stocks
The stock market is rolling over. It just hasn’t cracked yet. This coming week? The war in Iran is sparking dislocations everywhere. Spikes in oil prices have mostly been behind recessions since the 1970s. No, not always. No recession followed the spike during the Russia/Ukraine war, but it did unleash inflationary pressures that required central banks to hike interest rates in order to bring it down again. It did induce a slowdown. Q1 GDP 2022 turned negative, but there was no follow-through. GDP recovered, but not to the levels seen in 2021.
Therefore, it shouldn’t be a surprise that stock markets globally are now wavering. This past week we couldn’t find a major stock index that didn’t fall. The S&P 500 fell 2%, the Dow Jones Industrials (DJI) was down 3%, the Dow Jones Transportations (DJT) was off 6.2%, while the NASDAQ fell only 1.2%, thanks to MAG7 rebounding. The S&P 400 (Mid) fell 4.6% while the S&P 600 (Small) was off 3.9%. Not even the S&P 500 Equal Weight Index was spared as it fell 3.4% while the NY FANG Index was up 2.9%, thanks to the MAG7. We note as well two components of the NY FANG Index, ServiceNow (NOW) and CrowdStrike (CRWD), were up 15.1% and 15.3% respectively.
In Canada, the TSX fell 3.7% despite making new all-time highs (barely), while the TSX Venture Index (CDNX) was down 4.6%. In the EU, the story was the same. The London FTSE fell 5.9%, the Paris CAC 40 was down 6.8%, the German DAX was off 6.7%, and the EuroNext down 5.6%. The EU is particularly vulnerable to the closing of the Straits of Hormuz as they get a big chunk of their oil and gas from the region. The EU pivoted away from Russia after the 2022 invasion of Ukraine, shifting more to the Middle East. Now that supply disruptions are coming from that region the question begs, where do they go next: U.S. and Canada? Or turn back to Russia?
While the EU wasn’t spared, Asia also suffered as they too depend on the Middle East supply that comes through the Straits of Hormuz for their energy needs. China’s Shanghai Index (SSEC) fell 0.9%, the Tokyo Nikkei Dow (TKN) was off 5.5%, while Hong Kong’s Hang Seng (HSI) fell 3.3%. India’s Nifty Fifty dropped 2.9%. Japan is particularly vulnerable to the supply disruptions. China held in due to its ability to draw more Russian oil and gas.
Will others return to Russia? After all, Russia is number three in oil production, and number nine in oil reserves. Iran is number three in oil reserves. As to natural gas (NG), Russia is the world’s second largest producer and holds the world’s largest reserves. Iran is number three in production and number two in reserves. Hence, the importance of both Russia and Iran in global energy production and reserves.
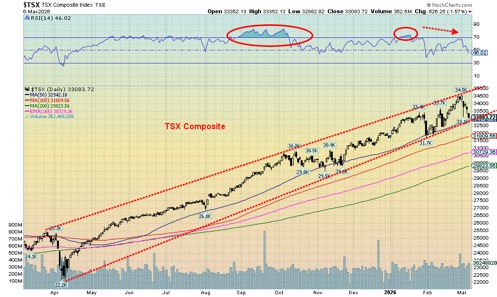
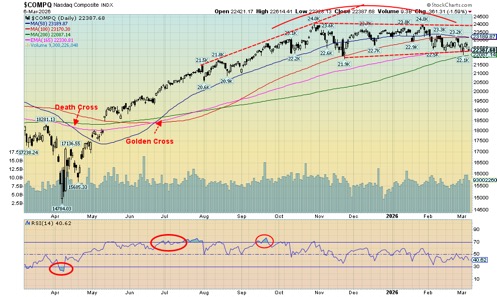
Now, the NASDAQ sits on the edge of breakdown as does the TSX Composite in the previous chart. Will they rebound this week, or tip over the edge? The NASDAQ needs to break under 21,900 to tell us that a bigger drop is coming. The TSX breaks under 33,000, but we need confirmation by breaking under 31,700. The TSX sub-indices were hit this week with new all-time highs (barely) coming for Golds (TGD), Metals (TGM), Industrials (TIN), Materials (TMT), Telecommunications (TTS) and Utilities (TUT).
Sounds great until you note that they finished down 11.8%, 12.1%, 3.3%, 11.5%, and 1.7% for Utilities. The holdout? Telecommunications, which eked out a 0.4% gain. The star of the week was Information Technology (TTK), up 4.7%, while Energy (TEN) saw new 52-week highs, closing up 2.1%. Mostly, however, it was red ink with Materials being hit the hardest. No other TSX sub index was up on the week.
Are the stock markets facing an overdue correction? No, we can’t quite say that yet. But the outlook doesn’t look positive. Some extra cash would be handy. We note evidence that suggests insiders and smart money had been lightening up for weeks.
As they say, the party is about to be over. The question becomes, how low do they go? Our initial thoughts are at least 20%-25%. First, however, we need to break key points below.
Note bond yields rose following the invasion on fears that inflation could become a big problem once again. With the stock markets wobbling and the recent jobs report, it is possible a recession could follow.
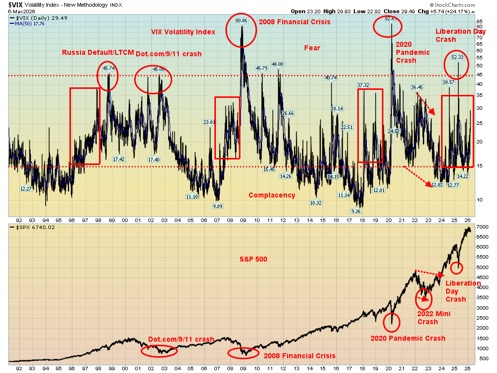
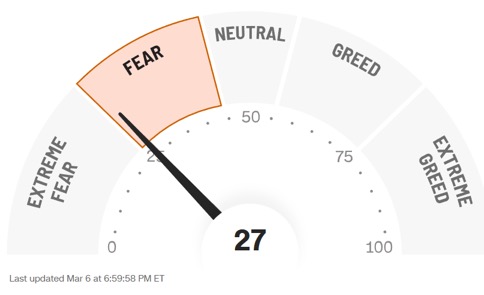
The VIX Volatility Index has leaped to its highest level since the “Liberation Day” mini-crash. The CNN Fear & Greed Index is registering fear, with five of its seven indicators registering extreme fear. It’s on the cusp of moving to extreme fear.
Gold and Silver
War has broken out. You’d expect gold and silver to soar. But no, they didn’t. Instead, they joined the stock market sell-off. We’ve seen this before during the 1987 stock market crash, the 2008 financial crisis crash, and the pandemic crash. All saw gold and silver fall (although gold remained just up during the 1987 crash) while the gold stocks took it on the chin and fell more than the stock market. That they fell sharply shouldn’t be a surprise as those markets are thin at the best of times. That’s one reason they can rise fast but fall even faster.
One thing gold likes is a weakening U.S. dollar and falling interest rates. Last week we had none of that. The US$ Index and bond yields rose. Not good for gold. Gold fell 1.7%, while silver was hit harder, down 10.1%. Platinum dropped 9.8%. The near precious metals weren’t spared as palladium fell 7.2% while copper was down 3.5%. The gold stocks suffered the most as the Gold Bugs Index (HUI) was off 11.7% and the TSX Gold Index (TGD) fell 11.8%. Before they fell, they made (barely) new all-time highs. That said, the HUI is up 23.2% and the TGD up 19.0% on the year so far. So, a drop of that magnitude shouldn’t be a surprise. The question now is, what’s going forward?
What now? The major uptrend remains intact. For gold, we’d have to fall through $3,900 to suggest we’ve made a major top. For silver, a drop through the last low near $69 is problematic. It could set up a test of the major $50 breakout level. Under $50 it’s all over. Gold under $4,700 is a sign we’ll head lower to test the recent low of $4,400.
Gold steadied on Friday after the weaker than expected U.S. job numbers. That may be our catalyst for things starting to rally again. A Fed in confusion and stagflation are good for gold. Continued deterioration on the geopolitical front is also positive for gold. And is the war spreading? According to the latest news, Russia is providing Iran with significant intel and Ukraine is being asked to provide drone interceptors. Already, almost every Middle East country is involved. Is this the opening to World War III, as some believe?
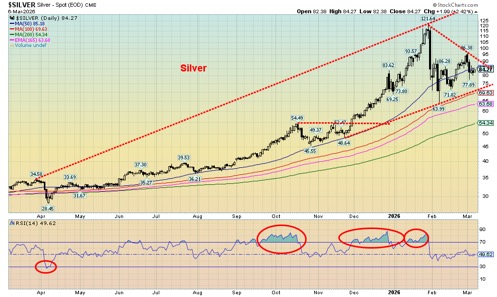
The question is, how long will this corrective period last? Typically, this period is weak for gold and silver with bottoms usually seen in June or even July. A February top is not unusual and that’s what happened. But this is a corrective period, not the end of the bull market. Geopolitics, domestic politics, slowing economies with rising inflation, and debt, debt, debt will keep upward pressure on gold and silver.
We’ll just have to work our way through this corrective period. If the drop following the late January high was an A wave and the recent rebound a B wave, then we may be embarking on a C wave down. Will it be swift or choppy? We lean towards the latter. What’s key is we may not see new lows, or we see new lows for gold or silver but not both. Gold stocks are also vulnerable to further declines. But we see this decline as a buying opportunity. The bull market that got underway in 2023 is not over.
Oil and Gas
As if we needed any evidence to know that the war in Iran has caused both oil and gas prices to not just rise but to spike higher. The question is, what now? Can the global economy withstand an oil shock? Oil shocks have happened before and, while they have resulted in a stock market correction (collapse?) and a recession, the last time this happened the economy slowed but didn’t fall into recession and the stock market corrected sharply but didn’t collapse.
That can be the case as often the correction is short-lived or once the new price is adjusted, the stock market rebounds and the economy doesn’t fall into recession. We saw that in the 2022 Russia/Ukraine oil spike followed by inflation and tightening on the part of the Fed and central banks. A slowdown, but not a recession. A correction for the stock market, but not a collapse. Others stepped in to replace any displacement caused by Russia, and soon an oil glut developed and prices fell rapidly.
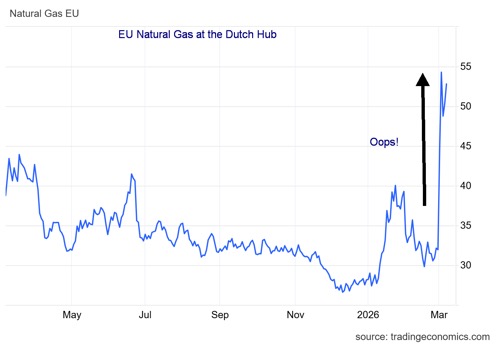
Now in the space of a week the attack on Iran sparked an almost $24 spike in oil prices or 35.4%. A bit of a shock. WTI oil is now at the highest level seen since 2024. Brent crude jumped 26.7%. Both WTI and Brent made 52-week highs. The biggest shock, however, wasn’t the leap in oil prices but the leap in natural gas (NG) prices at the EU Dutch Hub. NG leaped a remarkable 62.8%. It’s the highest since early 2025 but nowhere near the high of $339 following the outbreak of the Russia/Ukraine war. The gain was a 52-week high.
The EU is particularly vulnerable to supply shocks and disruptions due to its high dependency on both oil and gas since they produce little themselves. Their former supplier was Russia and that closed off while the current supply comes from the Middle East. Thus, the shutting of the Straits of Hormuz is a potential gamebreaker for them. Germany, the leading EU economy, is particularly vulnerable. Will they pivot back to Russia despite sanctions and the ongoing war? The U.S. is a huge producer and does export but do they have enough? Canada has facilities on the East coast, but they are small given Canada’s north-south orientation, with some oil going to Asia.
With EU NG jumping over 62%, it was no surprise to find that NG at the Henry Hub also rose but only 10.8%. Stocks responded but not spectacularly as they had been rising, leading the way for weeks. The ARCA Oil & Gas Index (XOI) rose 5.5% but the TSX Energy Index (TEN) was up only 2.1%. Both hit 52-week highs.
What next? Any sign of easing of the war could spell an equally swift decline. Further acceleration and little chance of a rebound through the Straits of Hormuz could send prices higher over $100. NG would also rise. Yes, we are overbought with the RSI soaring over 70 for oil, EU gas, and the XOI and TEN. But until things ease in the Middle East they can remain over 70 for a period. As long as WTI remains above 80, we are pointed higher. Since it’s quite a spike, that level could rise going forward. Welcome to the new era.
Markets and Trends
| % Gains (Losses) Trends | ||||||||
| Close Dec 31/25 | Close Mar 6/26 | Week | YTD | Daily (Short Term) | Weekly (Intermediate) | Monthly (Long Term) | ||
| S&P 500 | 6,845.50 | 6,740.02 | (2.0)% | (1.5)% | down | up (weak) | up | |
| Dow Jones Industrials | 48,063.29 | 47,501.55 | (3.0)% | (1.2)% | down | up (weak) | up | |
| Dow Jones Transport | 17,357.19 | 18,461.32 | (6.2)% | 6.4% | up | up | up | |
| NASDAQ | 23,241.99 | 22,387.62 | (1.2)% | (3.7)% | down | neutral | up | |
| S&P/TSX Composite | 31,712.76 | 33,083.77 (new highs) * | (3.7)% | 4.3% | up | up | up | |
| S&P/TSX Venture (CDNX) | 987.74 | 1,057.04 | (4.6)% | 4.7% | up | up | up | |
| S&P 600 (small) | 1,467.76 | 1,520.07 | (3.9)% | 3.6% | up | up | up | |
| ACWX MSCI World x US | 67.18 | 69.30 | (6.9)% | 3.2% | down | up | up | |
| Bitcoin | 87,576.98 | 68,130.55 | 3.9% | (22.2)% | down | down | neutral | |
| Gold Mining Stock Indices | ||||||||
| Gold Bugs Index (HUI) | 701.49 | 978.87 (new highs) * | (11.7)% | 23.2% | neutral | up | up | |
| TSX Gold Index (TGD) | 817.76 | 1,103.10 (new highs) * | (11.8)% | 19.0% | neutral | up | up | |
| % | ||||||||
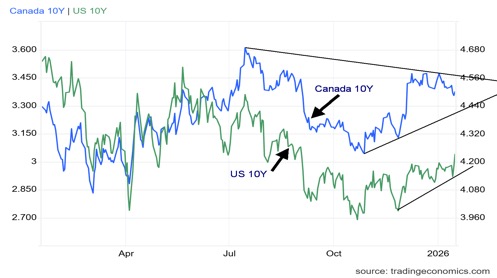
| U.S. 10-Year Treasury Bond yield | 4.17% | 4.15% | 5.1% | (0.5)% | ||||
| Cdn. 10-Year Bond CGB yield | 3.44% | 3.41% | 9.0% | (0.9)% | ||||
| Recession Watch Spreads | ||||||||
| U.S. 2-year 10-year Treasury spread | 0.69% | 0.58% | 3.6% | (15.9)% | ||||
| Cdn 2-year 10-year CGB spread | 0.85% | 0.77% | 5.5% | (9.4)% | ||||
| Currencies | ||||||||
| US$ Index | 98.26 | 98.89 | 1.3% | 0.6% | up | up (weak) | down | |
| Canadian $ | 72.87 | 0.7367 | 0.6% | 1.1% | up | up | neutral | |
| Euro | 117.48 | 116.17 | (1.7)% | (1.1)% | down | down (weak) | up | |
| Swiss Franc | 126.21 | 128.80 | (1.0)% | 2.1% | neutral | up | up | |
| British Pound | 134.78 | 134.00 | (0.6)% | (0.6)% | down | down (weak) | up | |
| Japanese Yen | 63.83 | 63.37 | (1.1)% | (0.7)% | down | down | down | |
| Precious Metals | ||||||||
| Gold | 4,311.97 | 5,168.67 | (1.7)% | 19.9% | up | up | up | |
| Silver | 71.16 | 84.27 | (10.1)% | 18.4% | down (weak) | up | up | |
| Platinum | 124.81 | 2,142.50 | (9.8)% | 4.7% | down | up | up | |
| Base Metals | ||||||||
| Palladium | 1,619.50 | 1,657.50 | (7.2)% | 2.4% | down | up | up | |
| Copper | 5.64 | 5.79 | (3.5)% | 2.7% | down | up | up | |
| Energy | ||||||||
| WTI Oil | 57.44 | 91.02 (new highs) | 35.4% | 58.5% | up | up | up | |
| Nat Gas | 3.71 | 3.17 | 10.8% | (14.6)% | down (weak) | neutral | neutral | |
__
(Featured image by Olle August via Unsplash)
DISCLAIMER: This article was written by a third party contributor and does not reflect the opinion of Born2Invest, its management, staff or its associates. Please review our disclaimer for more information.
This article may include forward-looking statements. These forward-looking statements generally are identified by the words “believe,” “project,” “estimate,” “become,” “plan,” “will,” and similar expressions, including with regards to potential earnings in the Empire Flippers affiliate program. These forward-looking statements involve known and unknown risks as well as uncertainties, including those discussed in the following cautionary statements and elsewhere in this article and on this site. Although the Company may believe that its expectations are based on reasonable assumptions, the actual results that the Company may achieve may differ materially from any forward-looking statements, which reflect the opinions of the management of the Company only as of the date hereof. Additionally, please make sure to read these important disclosures.
Copyright David Chapman 2026
David Chapman is not a registered advisory service and is not an exempt market dealer (EMD) nor a licensed financial advisor. He does not and cannot give individualised market advice. David Chapman has worked in the financial industry for over 40 years including large financial corporations, banks, and investment dealers. The information in this newsletter is intended only for informational and educational purposes. It should not be construed as an offer, a solicitation of an offer or sale of any security. Every effort is made to provide accurate and complete information.
However, we cannot guarantee that there will be no errors. We make no claims, promises or guarantees about the accuracy, completeness, or adequacy of the contents of this commentary and expressly disclaim liability for errors and omissions in the contents of this commentary. David Chapman will always use his best efforts to ensure the accuracy and timeliness of all information. The reader assumes all risk when trading in securities and David Chapman advises consulting a licensed professional financial advisor or portfolio manager such as Enriched Investing Incorporated before proceeding with any trade or idea presented in this newsletter.
David Chapman may own shares in companies mentioned in this newsletter. Before making an investment, prospective investors should review each security’s offering documents which summarize the objectives, fees, expenses and associated risks. Although Artificial Intelligence (AI) may be deployed from time to time, AI output is monitored and adjusted, if necessary, for accuracy. David Chapman shares his ideas and opinions for informational and educational purposes only and expects the reader to perform due diligence before considering a position in any security. That includes consulting with your own licensed professional financial advisor such as Enriched Investing Incorporated. Performance is not guaranteed, values change frequently, and past performance may not be repeated.


CBD and CBG Show Promise in Reducing Fatty Liver and Improving Metabolism
Research from Hebrew University of Jerusalem, led by Joseph Tam, found that cannabis compounds Cannabidiol (CBD) and Cannabigerol (CBG) reduced...


Oil Shock Risks: How Conflict with Iran Could Impact Markets
War in Iran raises economic and market risks mainly through oil price spikes. Past energy shocks sometimes caused recessions and...


Echoes of 1929: Inflated Valuations and Warning Signs in Today’s Dow
Pearl Harbor barely moved the Dow because valuations were low after the Great Depression. In contrast, the 1929 crash followed...


The TopRanked.io Weekly Digest: What’s Hot in Affiliate Marketing [Discover Cars Affiliate Program]
This week, we're talking FIFA and rental cars. Why? Because rental cars rhyme with travel, and the upcoming 2026 FIFA...


Revolut Seeks US Banking License to Expand Into American Market
British neobank Revolut has applied for a US national banking license to expand directly into the American market without partner...
 |
|
 |  |
 |
|
-
 Cannabis6 days ago
BrewDog Sale Leaves Thousands of Crowdfunding Investors Empty-Handed
-
 Markets2 weeks ago
Rice Market Slips as Global Price Pressure and Production Concerns Grow
-

 Crowdfunding3 days ago
Crowdfunding for Mobility: Wheelchair User Seeks Accessible Car
-

 Biotech1 week ago
Interministerial Commission on Drug Prices Approves New Drugs and Expanded Treatment Funding