Business
Who Owns Uncle Sam’s IOUs, and How Much?
The major concern I have for the market is the NASDAQ Banking index (#21), closed the week below its BEV -50% line. These banks have lost 50% of their market valuation since their last all-time high of November 2021, and I still sense no panic in the mainstream financial media. Well, not when they are live on camera. But I do detect a growing sense of despair in the market.
As far as the Dow Jones goes, I didn’t miss much during the two weeks I took off. Since March 31st, the Dow Jones has remained above its -10% BEV line, but can’t move up to close above its -5% BEV line, making the past six weeks one boring market as far as the Dow Jones is concerned.
One thing to keep in mind about markets; as soon as we figure out the rules, like our current rule, that nothing ever happens, someone or something always comes along to change them. So, don’t count on this market remaining boring forever. The day is coming when we’ll see more excitement than maybe you and I will want. The question is; will the excitement be to the up or downside of the market, to move the Dow Jones into record territory, with one more thrust up to its red BEV Zero line, or a plunge downward, deep below its -25% BEV line?
Being a bear on this market, I’m expecting the next big thing for the Dow Jones will be for its valuation to begin deflating. Life is full of surprises. Maybe the Not QE#4 rally still has a few new all-time highs left in it. However, as its last all-time high was on 04 January 2022, 340 NYSE trading sessions ago, and the FOMC has been conducting a QT for the past year, that seems unlikely.
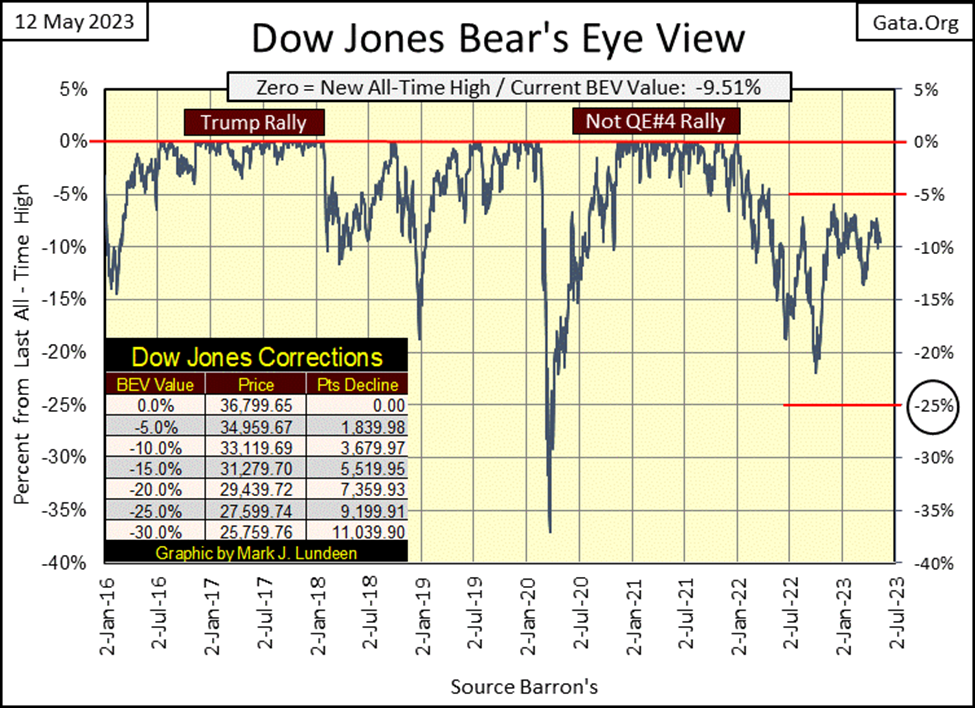
340 NYSE trading sessions is a long time, a very long time for any market advance, like the Not QE#4 rally to be correcting for excessive valuation. So, I’m expecting the 04 January 2022 BEV Zero, will prove to be the rally’s last all-time high, making it the rally’s Terminal Zero (TZ).
The TZ marks the point in all boom cycles where any investment in the market becomes all risk, with no possibility of reward. That is what happens at market tops; there is nowhere to go but down following the TZ. If so, that would make the decline following the TZ of 04 January 2022 in the BEV chart above, the initial stage of a big bear market. Exiting the market now with the Dow Jones’ BEV at its current -9.51% may just prove to be an excellent decision.
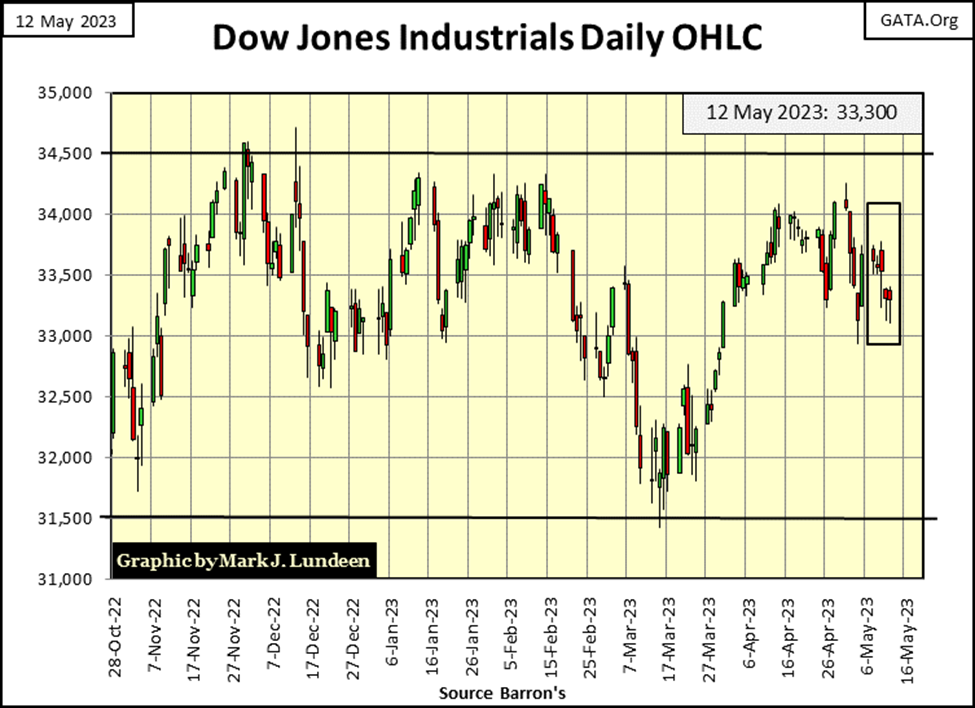
Looking at the Dow Jones’ daily bar chart below, we see what it’s been doing in dollar terms. Since it broke above 33,000 on March 31st, it’s been unable to break above, and then stay above 34,000, though it twice made the effort. This week? It didn’t even attempt to make the effort to break above 34,000, with every day a down day.
Anything can happen. Maybe next week we’ll see five consecutive daily advances, clearing the Dow Jones 34,000 line with authority. And then maybe not.
Moving down to my table listing the BEV values for the major market indexes I follow, like the Dow Jones (#2 in the table), the rest of the market continues being weak, with the average BEV value for the data set (#15) closing the week below its BEV -20% line.
The major concern I have for the market is the NASDAQ Banking index (#21), closed the week below its BEV -50% line. These banks have lost 50% of their market valuation since their last all-time high of November 2021, and I still sense no panic in the mainstream financial media. Well, not when they are live on camera. But I do detect a growing sense of despair in the market, as I see these indexes below the Dow Jones in the table, deflating ever deeper from their last all-time highs.
If the NASDAQ Banking index continues deflating to ever deeper BEV values, it will take the rest of these indexes down with them. How many more bank failures will it take before we’ll once again see the talking heads on CNBC in a state of panic, as we did during the NASDAQ Tech-wreck in 2002, the sub-prime mortgage crisis of 2008-09, and during the twenty-three days of the March 2020 flash crash.
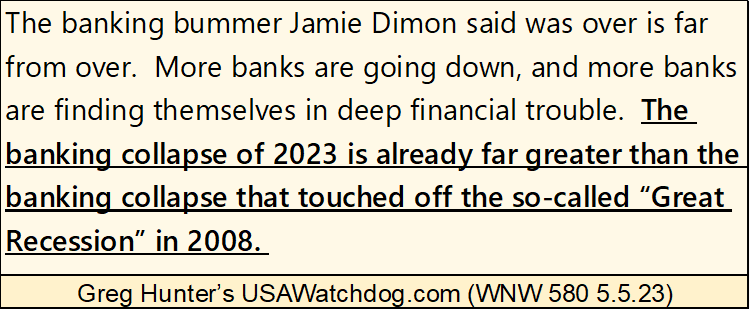
Greg Hunter over at USAWatchdog has some interesting comments on the current banking situation that are worth your time to view.
The only exception to the above would be the XAU, (#20) below. It may have closed the week with a BEV of -41.68%. But that 41.68% decline is from its last all-time high of April 2011, and is now rebounding from a BEV -83%, an 83% decline from its April 2011 last all-time high, seen in January 2016.
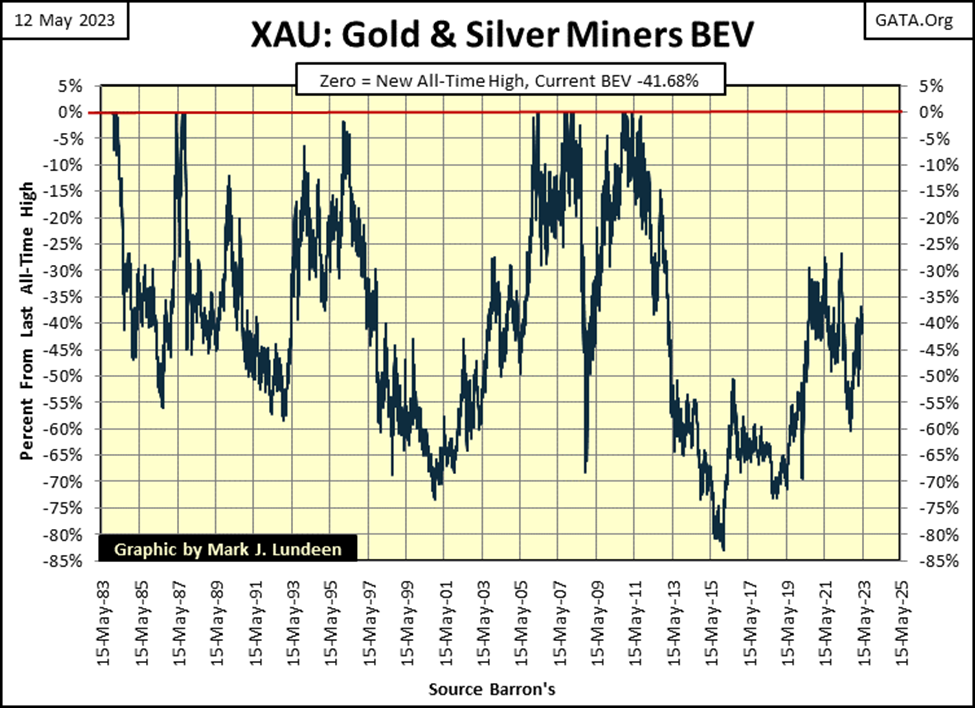
Unlike the other indexes seen below, where we are concerned that managed money and the public will soon exit, and rightfully so, the entire investment universe abandoned the gold and silver miners many years ago. That leaves ownership of the shares of these miners in the strong hands of true believers, people who are not inclined to panic at these levels.
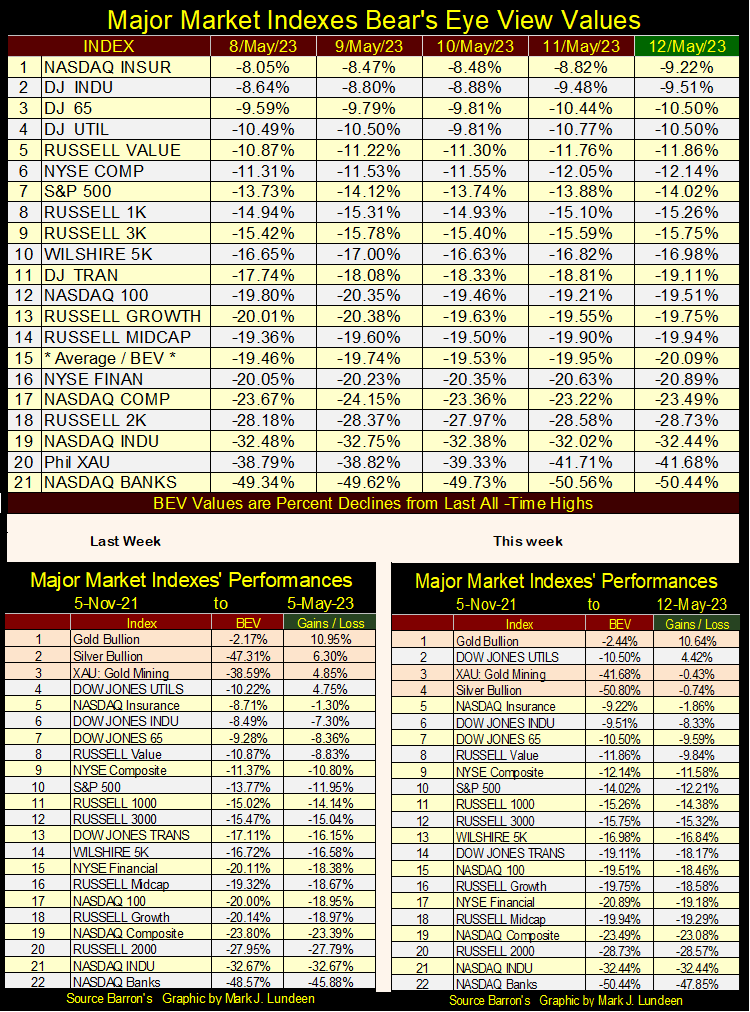
Above we see this and last week’s performance tables. They are worth a look, and note precious metal assets remain at the top.
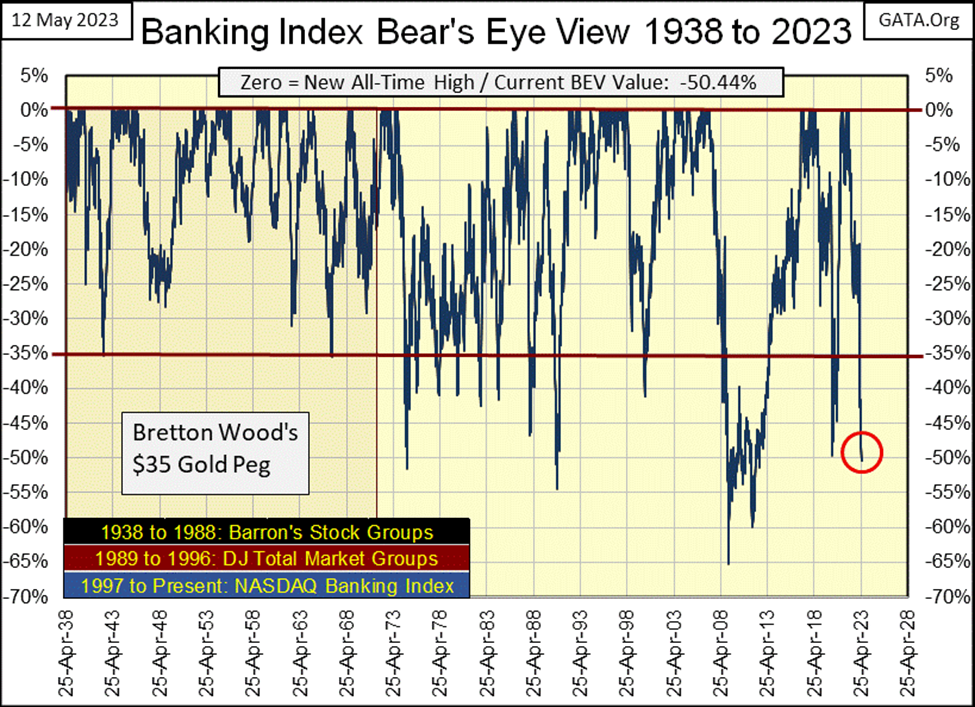
Let’s take a long-term look at the banking stocks in the Bear’s Eye View (BEV) chart below, to put into context what a BEV of -50% in the banking index means. Before the US Treasury took the dollar off the Bretton Woods $35 gold peg in August 1971, in a bad market the banks had only broken down to their BEV -35% line.
As seen below, all too soon after August 1971, that changed as banking in America became a casino for the big-banks’ management. Wall Street liked the new dollar, with their losing bets made good by a bunch of idiots at the FOMC, the ever-popular American taxpayer, and holders of the now shrinking US dollar everywhere.
The deepest decline in the banking index happened during the sub-prime mortgage crisis of 2008-09, where they deflated 65% from an all-time high. The question is, will the current decline in the banking index hold above the lows of 2008-09? I sure hope so, because there will be hell to pay if it doesn’t.
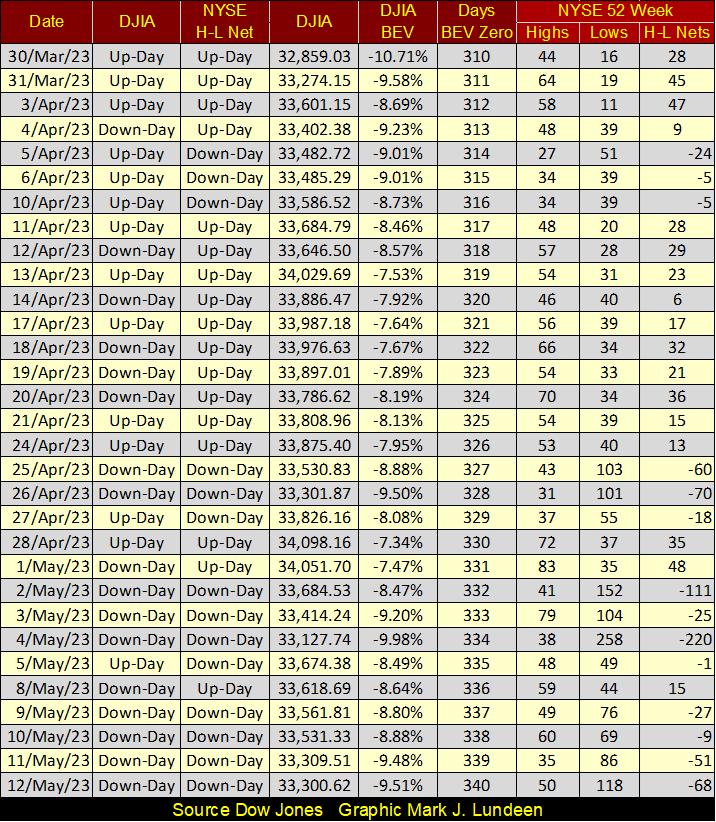
Moving on to the NYSE 52Wk High Low table below, the current market funk is on display. In the Day’s BEV Zero column, listing the number of NYSE trading sessions since the Dow Jones last all-time high at week’s end, there have been 340 NYSE trading sessions free from new all-time highs by the Dow Jones. Still since March 30th, the Dow Jones has remained above its BEV -10% line. How much longer can that go on?
Maybe longer than a bear like me would like. But then my eyes drift over to the H-L Nets column, where I centered all the positive NYSE 52Wk H-L nets; those days the NYSE saw more 52Wk Highs than 52Wk Lows. Not a day since the end of March has the NYSE seen a triple-digit positive H-L net. That is pathetic; something no respectable market advance would see.
But during this so-called market advance, we did see two days with triple digit * NEGATIVE * H-L nets, and just a few days ago. What was that about? Most likely it was just Mr Bear letting everyone know he is still thinking about us.
Let’s look at the foreign holders of US Treasury Debt; those who own, and how much of Uncle Sam’s IOUs they own. Here is the link to the data from the US Treasury, which does not include data on the Federal Reserve’s holdings.
https://ticdata.treasury.gov/resource-center/data-chart-center/tic/Documents/mfh.txt
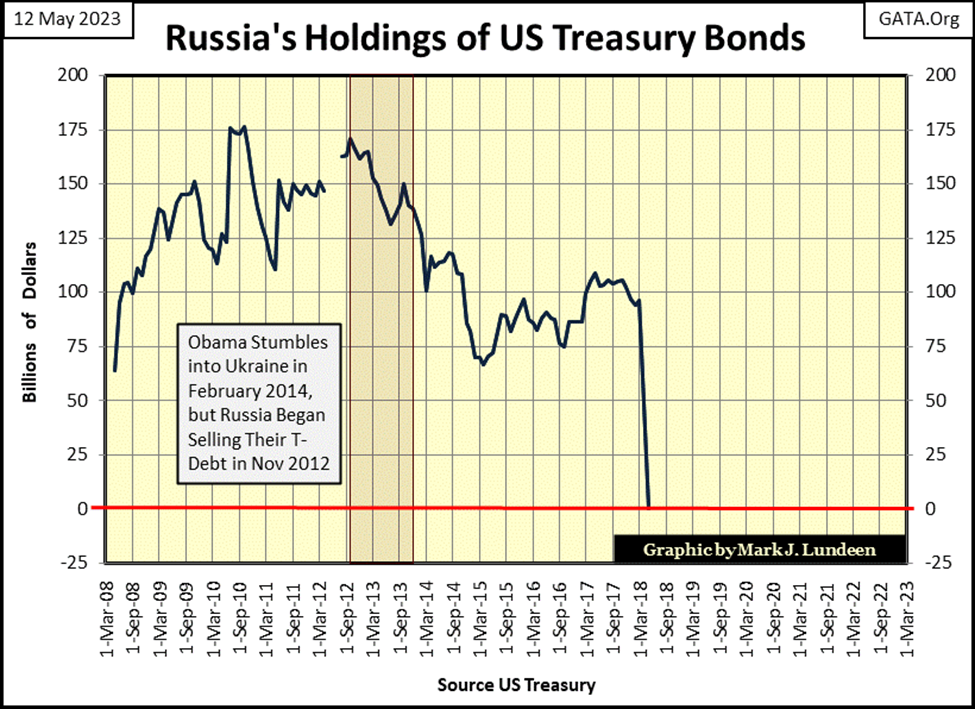
I don’t maintain the data for each nation listed in this data set, just those who have been continuously published since May 2008. Those nations the US Treasury has on occasion decided not to publish, I have omitted from my file, like Russia, who totally exited the T-bond market.
Russia began their exit from the T-bond market in November 2012, and was completely out by May 2018, five years ago, following the Ukrainian coup, where President Obama and his Secretary-of-State Clinton, usurped the elected government in the Ukraine, a government that was favorable to Russia.
Obama and Clinton then installed in Ukraine a new political establishment (the current regime) that was favorable to the dark forces of our world. Things have only gotten worse since, with a totally unnecessary civil war in Ukraine, and now, even talk of nuclear war to “keep Russia from winning.” These people have gone insane!
For all the foul deeds done to them, and slanders spoken by the American deep state about them, I don’t blame Russia one bit for getting out of the US T-bond market.
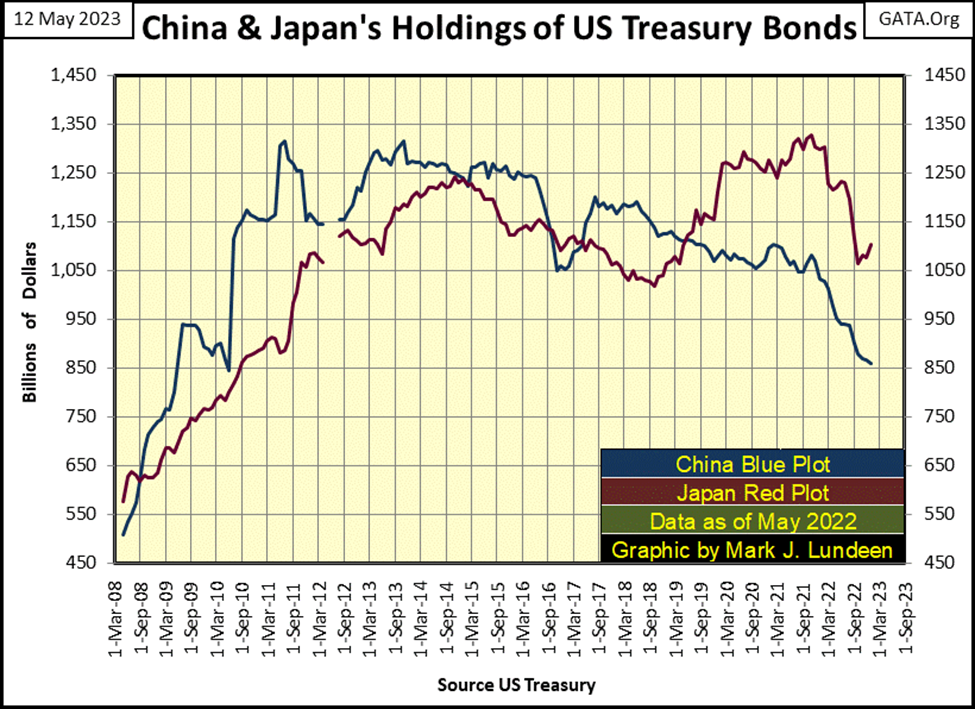
Let’s now look at the two largest holders of T-Debt; China (Blue Plot) and Japan (Red Plot) below.
My data spans from May 2008, to January 2023, the latest data published by the US Treasury. I wish it went back another decade, to see what was normal before the sub-prime mortgage crisis. I suspect the large increases seen below following May 2008 were not typical before the mortgage crisis.
However, May 2008 was during the sub-prime mortgage crisis, a time when many nations greatly increased their holdings of US T-debt, and that is exactly what we see below from 2008 to around 2014. Since 2014, both Japan and China have sold off some of their T-debt, China more than Japan. The specific details can be found in the table below.
The point made in the chart below is, it wasn’t just the United States who implemented a policy of “easy money”, a policy of monetary inflation during the mortgage crisis, a crisis which in fact was global in scope.
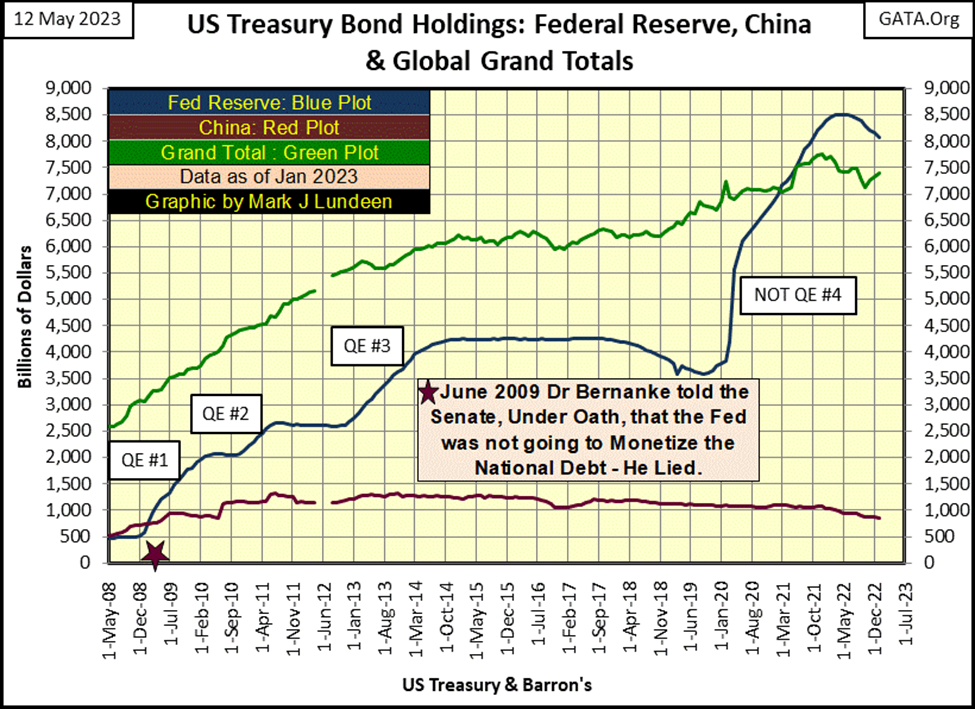
The next chart plots the data from China above (Red Plot), the grand-total data from the data sheet published by the US Treasury (Green Plot), along with data from the Federal Reserve on its holdings of US T-debt (Blue Plot). The data on the Fed comes from the Fed itself, which is published weekly from the following link.
https://www.federalreserve.gov/releases/h41/
This is an astounding chart. In 2008, some months the Federal Reserve (Blue Plot) held less T-debt than did China. By 2021, the idiots at the FOMC had monetized more debt than the grand-total, global holdings of T-debt during Fed Chairman Powell’s Not QE#4.
But that is what it took to “stabilize” the stock and bond markets during the March 2020 flash crash. What these idiots have planned for us on the next market meltdown should be very interesting.
It is no surprise bond yields bottomed in August 2020 (Black Circle), artificial demand from the FOMC for T-bonds was huge.
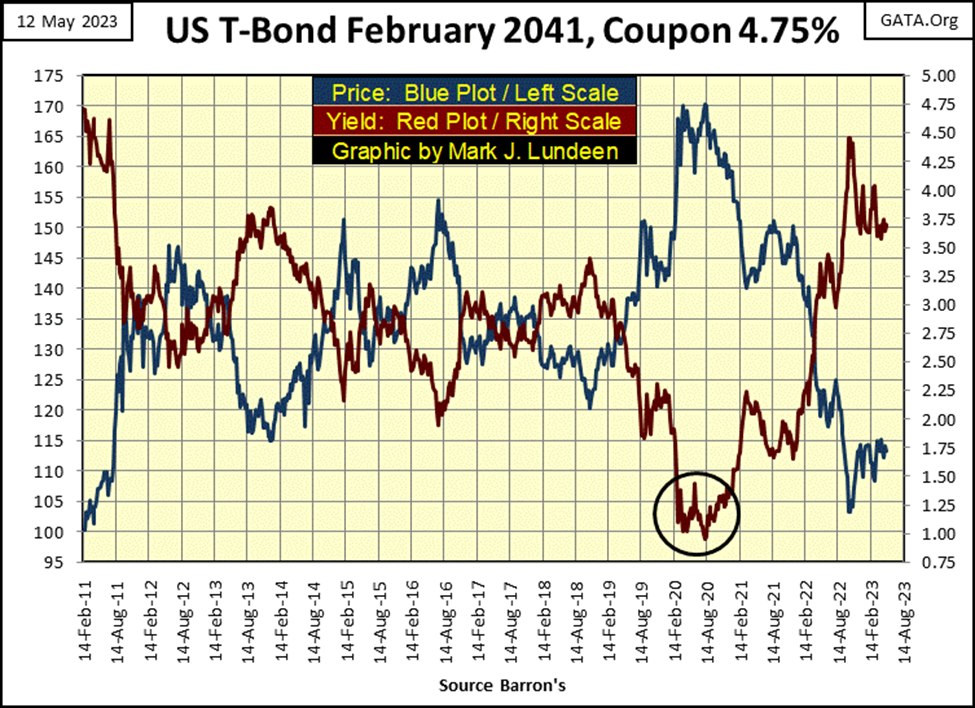
Or why in early in 2022, bond yields began spiking higher; demand for T-debt declined with Powell’s QT (chart below), a QT that began in May 2022, and continues to this day.
The T-bond chart above also shows why the banks are in a crisis, one with no easy solution to. As yields declined from 2018 to 2020, the banks were taking deposits to purchase bonds as a source of income. This T-bond charted below was issued in February 2011 with a coupon of 4.75%. As its yield (Red Plot) fell below 1.00% in August 2020, its valuation (Blue Plot) only increased. Banks loved bonds as they, because of falling bond yields, were a source of free money for them!
But since August 2020, bond yields have increased, as bond valuations have deflated – a lot. Last autumn this bond lost 38% of its August 2020’s valuation, leaving the banking system short of ready cash, should depositors demand their money back, which they have. Hence the problem for the banks.
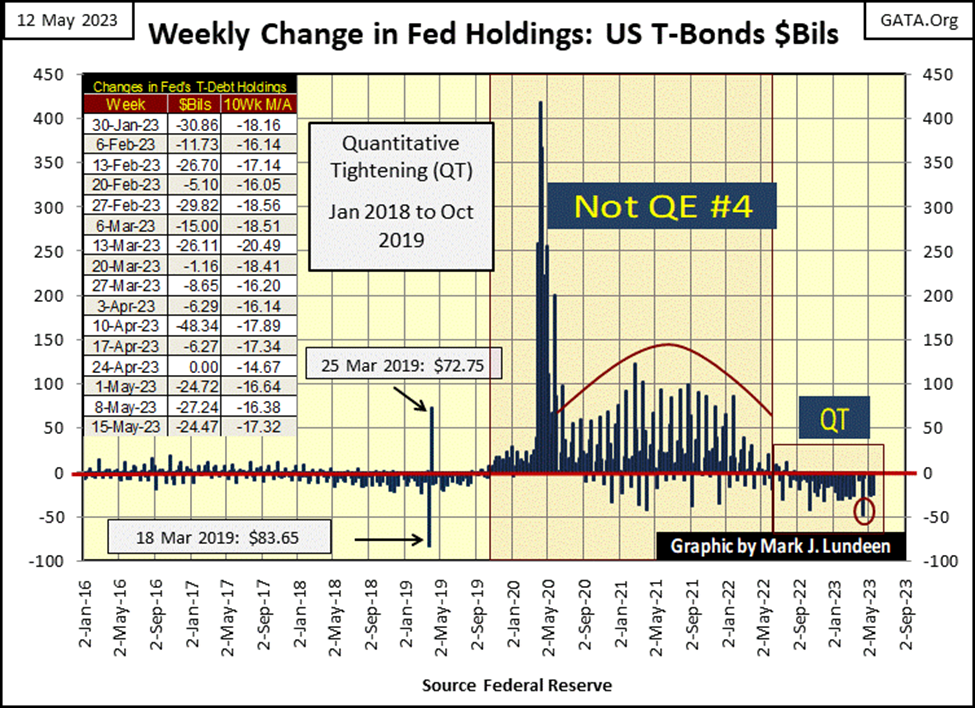
For all the “liquidity” withdrawn from the financial system with Powell’s QT above, with increases in interest rates and bond yields in the past year, I’m surprised we’ve not seen another crash on Wall Street. Give it time, it’s coming.
Sorry for the diversion from the topic at hand, that being which nations own US Treasury bonds; let’s return to this topic.
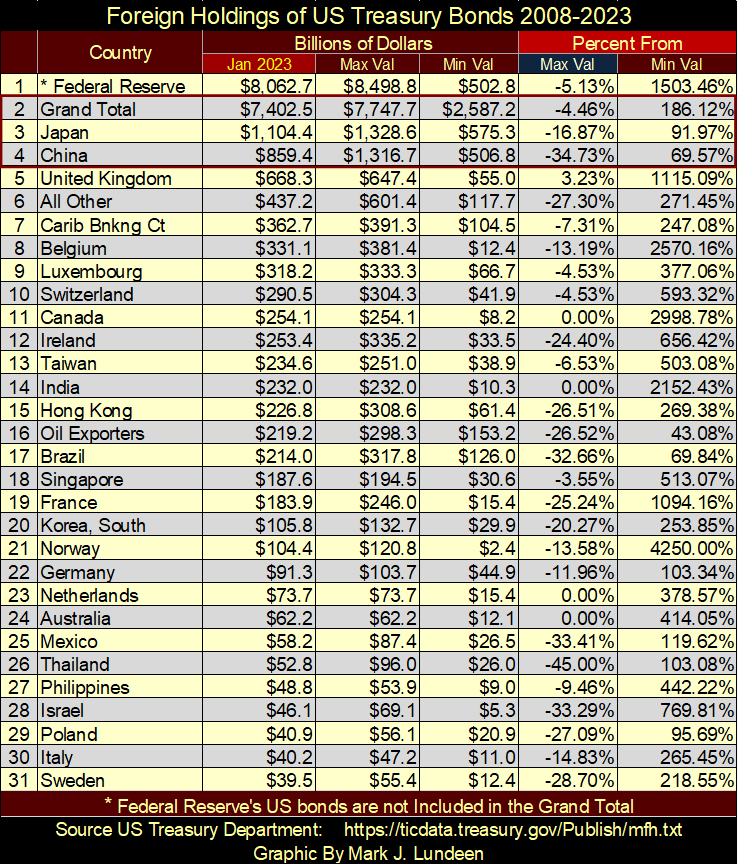
In the table below, I have six columns, the first four are;
- Nation holding US T-debt,
- Holdings in $bils as of January 2023 (latest data),
- Max holdings in $bils (2008 to 2023),
- Min holdings in $bils (2008 to 2023),
The last two columns in the table are percentages of the latest data (January 2023) from the maximum and minimum holdings.
For example, looking at China, China’s latest data shows it owns $859.4 bil of T-debt. Its maximum holdings since May 2008 was $1,316.7 bil, its minimum was $506.8 bil. In the percentage columns, from its maximum holdings China has reduced its holdings of T-debt by 34.73%, but still holds 69.57% more T-debt from its minimum holdings.
Of all the columns seen in the chart below, the most important is the Max Val column under the red Percent From header. There are many nations who have reduced their holdings of US T-debt by double-digit percentages. That can’t be good. And exactly who is buying these many hundreds-of-billions of T-debt sold on the open market? Makes one wonder how have bond yields stabilized since last October?
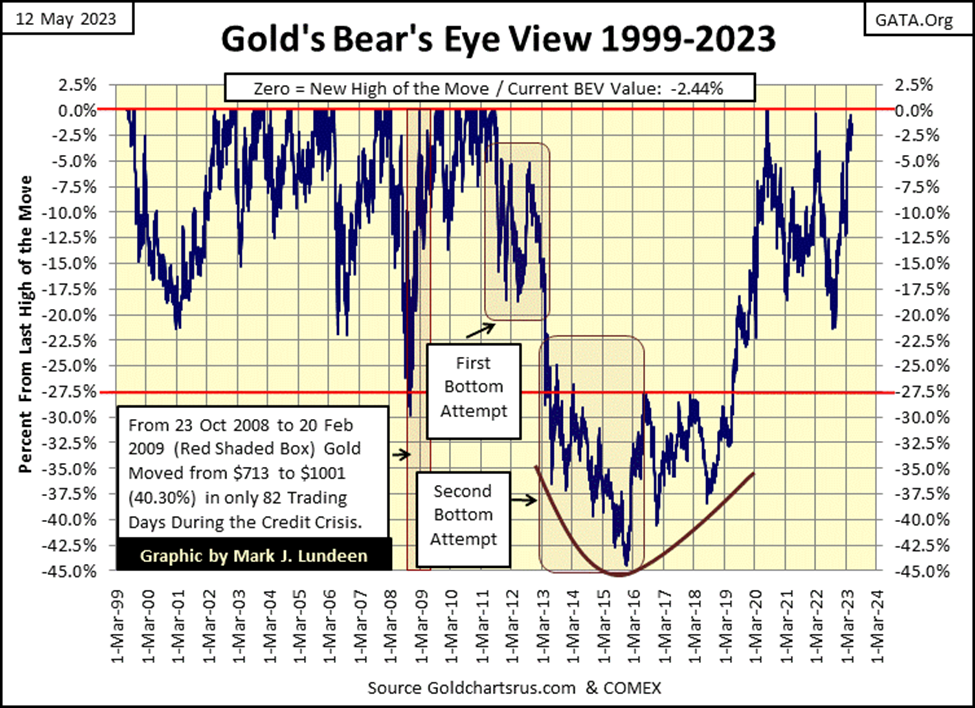
Let’s look at gold’s BEV chart below going back to 1999. Gold closed the week with a BEV of -2.44%, well within scoring position; a BEV value above the -5% line, but below the BEV Zero line, and so it’s been since March 21st. Gold has now closed in scoring position for almost two months, without making a new BEV Zero, a new all-time high. That is very unusual, and damn suspicious!
Let’s face the facts, the mainstream media doesn’t want to address the crisis in banking, especially should gold begin to take flight above its last all-time highs of August 2020. It may result in a few hundred-billion dollars of flight capital from problem banks, to flow towards gold and silver bullion, and the miners of the old monetary metals. That would trigger a bull market in precious metal assets that would be long remembered!
The “policy makers” can’t have that, as at this point gains in gold and silver, are from losses in those things that trade on Wall Street, or flows from deposits in the banking system. So, I suspect we’re seeing some shenanigans by the COMEX goon squad, making sure gold doesn’t break above its highs of August 2020. But this too shall pass.
Gold became overbought this week when its 15-count became a +7, as the Dow Jones became oversold, with a 15-count of -7.
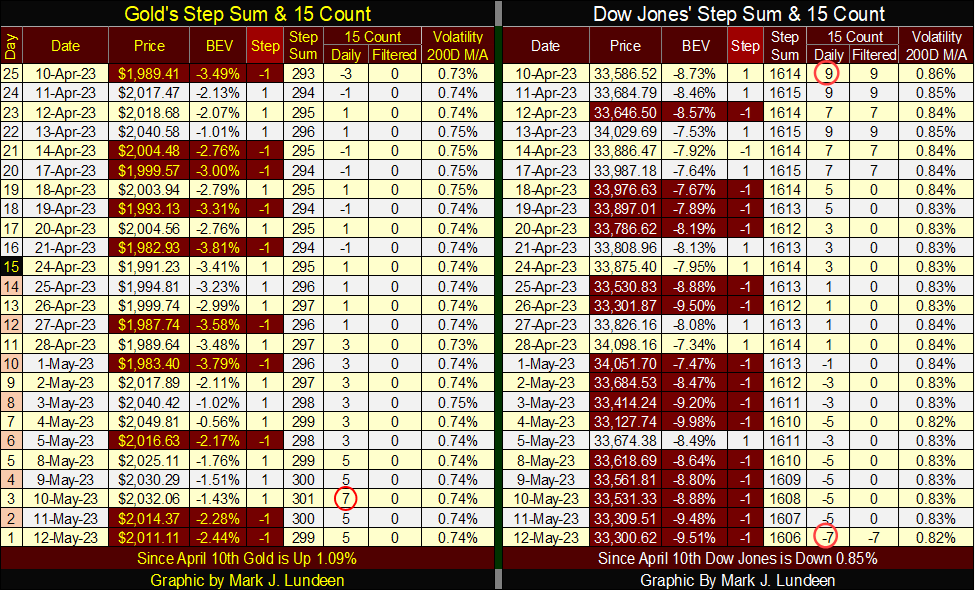
We may say that gold is overbought, as its 15-count increased to a +7. However, since April 10th, the price of gold had increased only 1.09% after all those daily advances seen above. A lot of work for nothing much after the effort seen above.
The Dow Jones’ table is almost a mirror image of gold. On April 10th, its 15-count was a very overbought +9. Markets don’t like being very overbought, and tend to sell off from them. And that is exactly what the Dow Jones did, look at all the daily declines since April 10th. But after all those down days, with the Dow Jones closing the week with a 15-count of -7, its valuation had only gone down by 0.85% in the past five trading weeks.
This is some weird market action.
__
(Featured image by 6493990 via Pixabay)
DISCLAIMER: This article was written by a third party contributor and does not reflect the opinion of Born2Invest, its management, staff or its associates. Please review our disclaimer for more information.
This article may include forward-looking statements. These forward-looking statements generally are identified by the words “believe,” “project,” “estimate,” “become,” “plan,” “will,” and similar expressions. These forward-looking statements involve known and unknown risks as well as uncertainties, including those discussed in the following cautionary statements and elsewhere in this article and on this site. Although the Company may believe that its expectations are based on reasonable assumptions, the actual results that the Company may achieve may differ materially from any forward-looking statements, which reflect the opinions of the management of the Company only as of the date hereof. Additionally, please make sure to read these important disclosures.


Namibia Cannabis Activists Seek Political Path After Legal Setbacks
Ganja Users of Namibia is shifting its cannabis reform campaign from legal challenges to politics by proposing the Ganja Users...

XRP at a Turning Point Amid Price Pressure, Regulation, and Institutional Growth
XRP faces a critical period as price pressure, regulatory uncertainty, and institutional expansion shape its outlook. Analysts debate ambitious targets...


Biodiversity Becomes a Key Driver of Value and Resilience in Real Estate
Biodiversity is becoming central to the real estate sector, driven by regulations like the Biodiversity Net Gain and the demand...


Market Faces Potential Shift as Secular Bull Ages and Gold, Oil Gain Attention
Markets alternate long secular bulls and bears; 1982–2000 bull then 2000–2009 bear. Current bull is 17 years old, raising concerns...

Rising Bond Yields Signal Potential Trouble Beneath a Calm Stock Market
This week’s market was calm, but underlying conditions may be weakening. The Dow Jones has stalled without new highs, while...
 |
|
 |  |
 |
|
-

 Business1 week ago
Dow Jones’ Record Run Faces Early Signs of Potential Shift
-

 Business2 weeks ago
Jobs Cooling Fast as a Cautious Fed Leaves Markets Without a Safety Net
-

 Fintech4 days ago
AI Agents Transform Payments as Visa, Mastercard, and Qonto Tackle Trust, Liability, and Regulation
-

 Cannabis2 weeks ago
Cannabis Regulation in Germany and Switzerland Shows Early Benefits of Legalization Models