Featured
Why 2023 Could Be Worse Than 2022
2022 was not a good year and in looking back and forward, 2023 promises to be another difficult year, possibly even worse than 2022. There are just too many negative issues with the war in Ukraine that could yet escalate, rising interest rates, persistent inflation, domestic political tensions, far too much debt, growing tensions with China, stagflation and climate change disasters. All are expected to continue into 2023.

The year 2022 delivered in spades. Stock markets roiled, bond markets roiled, cryptos collapsed, gold had a great run into March 2022, then it too roiled, oil started out gangbusters and then roiled into year-end, but natural gas never let up and is the big star of 2022. So far, 2022 is shaping up as the worst year for the stock market since 2008. For bonds, this has been the worst year since the 1970s, when another period of rising inflation (and interest rates) devastated bond markets. As the year draws to an end, even gold that was trying to crawl back to break-even has faltered once again.
Our 2022 forecast outlined seven risks as we saw them. In looking them over, it appears we may have pre-empted the prognostications of Dr. Doom (Nouriel Roubini) in his book MegaThreats, Ten Trends that Imperil our Future, And How to Survive Them (2022). Our seven threats were: geopolitical risk, interest rate risk, China slowdown, COVID, domestic politics risk, climate change, and cyberwars. Roubini’s ten threats: debt spirals, demographic decay, monetary addiction, stagflation, currency wars, the decline of world trade, attack of the robots (cyberwars?), rise of China, and climate change.
2022 brought us a string of slow-moving disasters:
- The Russian invasion of Ukraine (geopolitical risk), resulting in soaring oil and gas prices.
- The collapse of cryptocurrency, highlighted by the fall of FTX and its founder Sam Bankman-Fried. The Crypto King went from multi-billionaire and celebrity superstar to being arrested for fraud. A fall from grace also appears to be afflicting Elon Musk, once the world’s richest man. No more as his signature company’s stock, Tesla, has tumbled 55% thus far in 2022 and his signature purchase of Twitter is turning into a soap-opera. Is Twitter still worth $44 billion an amount that even Musk admits was overpaying?
- The near collapse of the U.K. economy, resulting in the resignation of Liz Truss’s short-lived reign as prime minister. In 2022 the U.K. went through three prime ministers.
- Soaring prices and rising interest rates as a result of rising inflation, stemming from the after-effects of the COVID pandemic that resulted in global supply disruptions and exacerbated by the ongoing trade conflicts between the U.S. and China, along with the war in Ukraine.
- Slow-moving climate disasters with one of the hottest years on record, coupled with devastating hurricanes, droughts that have already displaced millions and have resulted in higher food prices, famines, killer heat waves, and massive flooding, highlighted by a third of Pakistan underwater. (climate change)
- Attempted, ill-fated coup d’états in G7 countries, notably in the past year in Canada (February 2022 occupation of Ottawa with a stated goal of forcing the government to be overturned) and Germany (December 2022 attempted putsch) as both followed the aborted coup attempt in the U.S. on January 6, 2021. There was also the assassination of former Japanese PM Shinzo Abe in July (domestic politics risk)
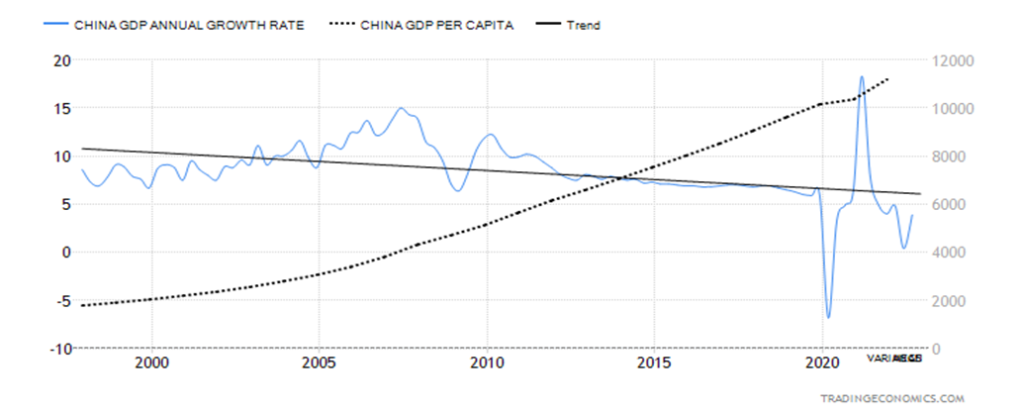
- And finally, China’s slowdown as a result of strict COVID measures putting a damper on China’s growth prospects which in turn impacts the world, given China’s spot as the world’s second largest economy. China also faced unheard of political unrest because of its strict lockdowns because of COVID. (China slowdown)
China’s GDP Growth has been Slowing for 25 Years, but GDP per Capita Keeps on Rising 1997–2022
We can’t ignore geopolitical tensions as the war in Ukraine continues. That could yet morph into a broader war as the West continues to send arms to Ukraine, involving them in the war whether they have boots on the ground or not. The potential for the U.S. to supply patriot missiles is yet another danger spot. A reminder that during both World War I and World War II the U.S. supplying arms to the U.K. led to the U.S. being in the war as Germany tried to cut off supplies. A similar response from Russia today could land us in World War III. Tensions continue between the U.S. and China in the South China Sea and over Taiwan and, as well, tensions continue with Iran and North Korea. None of these tensions are expected to change as we go into 2023 and they could instead deepen and escalate.
Stocks
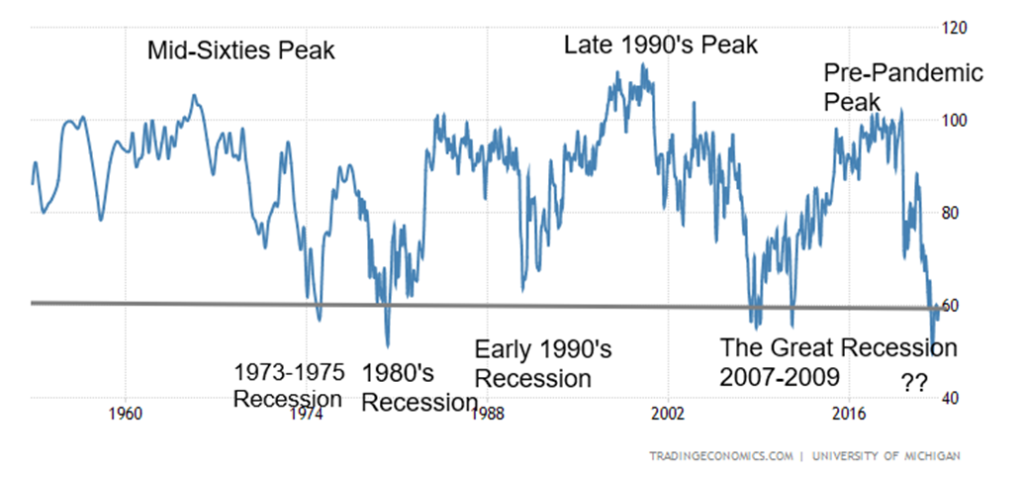
The question is not whether will we have a recession, it is a question of when. We have noted the huge negative spread between the short end of the yield curve and the long end. Those spreads are at levels not seen since the early 1980s, a period that resulted in a steep recession. Some economists believe the recession has already started, even if it is not yet showing up in the job numbers and some manufacturing numbers. But if one based it on consumer sentiment, we are already there with the weakest consumer sentiment seen since the Great Recession and closer to the early 1980s’ recession levels. Will it improve in 2022? Not likely.
Consumer Sentiment 1950–2022
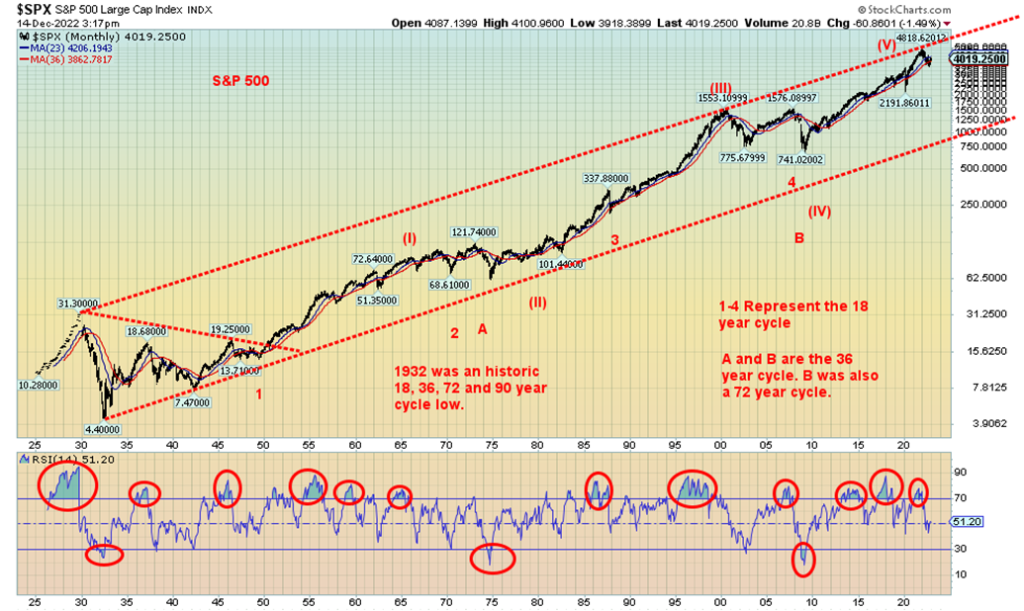
We have noted on a number of occasions the presence of what many cycle analysts denote as an 18-year cycle for stocks (range 13–21 years). Counting from the Great Depression low in 1932, we note four: 1949 (17 years), 1970 (21 years) or 1974 (24 years), 1987 (17 years), and 2009 (21 years). Analysts such as Ray Merriman of MMA Cycles (www.mmacycles.com) note further the presence of 36-, 72-, and 90-year cycles. The 36-year cycle has a range of 30–42 years. Its cycle low was 1932, 1974, and 2009. The 72-year cycle with a range of 73–77 was last seen in 2009 (77 years from 1932). If correct, we are only in the first phase of the next 72-year cycle. Longer term, that’s actually bullish, but not now. The 90-year cycle with a range of 2021–2037 was last seen in 1932 and before that in 1842. The question is, are we in the process of forming the 90-year cycle? Our clue is the next 18-year cycle low, due in 2024–2030. We are, we believe, entering the period of the Kondratiev summer, highlighted by inflation, stagflation, recessions (or worse), weak stock markets, but strong commodity markets.
The top for the current 18-year cycle was most likely the one seen on January 4, 2022. That top could prove as well to be high for the 90-year cycle. The S&P 500 low for the year 2022 took out the low of 2021, telling us that top was significant and that the bull trend in place since the financial crisis low of March 2009 is now over. We look at other types of cycles to see where we stand there.
S&P 500 100 Years 1922–2022
We also note that there are divergences between the major indices. The Dow Jones Industrials (DJI) did break out over a downtrend line and the 200-day MA but the S&P 500 is thus far failing to break above the same downtrend line and faltering near the 200-day MA. Currently, the S&P 500 is trying to find support at the 50-day MA but if it breaks under 3,800 the rebound rally that got underway in September may be over. The Dow Jones Transportations (DJT) is showing the same pattern and the NASDAQ is not even close to it’s resistance lines and 200-day MA. The DJI has been all alone in breaking out with non-confirmations from everyone else.
The decennial or ten-year cycle is well known. Since formal stock markets got underway in 1880, the Stock Trader’s Almanac (www.stocktradersalmanac.com) has noted that the fifth and eighth years tend to be strong while the first, seventh, and zero years are weak. Our chart below starts at 1830. 2023 is the third year of the cycle with a record of 9 up years and 10 down years. The chart uses the Dow Jones Industrials (DJI) as the measuring stick. For years ending in 3, the last major losing year was 1973. 1853, 1873, 1893, 1903, 1913, and 1973 all saw double-digit losses of over 10%. Note the big losing years all occurred before the Great Depression, with only 1973 standing out after. Since then, there have been four consecutive winning years ending in 3 with both 2003 and 2013 seeing 25% + gains.
It is hard to place a huge emphasis on the decennial cycle as it doesn’t really give us a clue as to what 2023 might bring. A more substantial record is seen using the presidential cycle. 2023 is the third year of the presidential cycle. Historically, it is the strongest year of the four years with the post-election year being the weakest. Since 1833, the presidential third year has seen 35 up years and only 12 down years. Standing out on the losing side were double-digit losses in 1903 (McKinley/Roosevelt), 1907 (Roosevelt), and 1931 (Hoover).
Since then, there have been only small losses in 1939 (Roosevelt) and 2015 (Obama). All other third years saw gains, including a 22.3% gain in 2019 (Trump). According to the presidential cycle, 2023 should be a good year. But with so many forces against the market this time around, the odds would appear to favor that 2023 could be the first down year since 2015. That could happen only if some key things changed, such as a conclusion to the war in Ukraine. The likelihood of that happening, however, appears extremely remote.
10-Year Stock Market Cycle
Annual % Change in the Dow Jones Industrials Average*
Year of Decade
–
| Decades | 1st | 2nd | 3rd | 4th | 5th | 6th | 7th | 8th | 9th | 10th |
| 1831–40 | -0.9 | 13.0 | 3.1 | -11.7 | -11.5 | 1.6 | -12.3 | 5.5 | ||
| 1841–50 | -13.3 | -18.1 | 45.0 | 15.5 | 8.1 | -14.5 | 1.2 | -3.6 | – | 18.7 |
| 1851–60 | -3.2 | 19.6 | -12.7 | -30.2 | 1.5 | 4.4 | -31.0 | 14.3 | -10.7 | 14.0 |
| 1861–70 | -1.8 | 55.4 | 38.0 | 6.4 | -8.5 | 3.6 | 1.6 | 10.8 | 1.7 | 5.6 |
| 1871–80 | 7.3 | 6.8 | -12.7 | 2.8 | -4.1 | -17.9 | -9.4 | 6.1 | 43.0 | 18.7 |
| 1881–90 | 3.0 | -2.9 | -6.5 | -18.8 | 20.1 | 12.4 | -8.4 | 4.8 | 5.5 | -14.1 |
| 1891–00 | 17.6 | -6.6 | -24.6 | -0.6 | 2.3 | -1.7 | 21.3 | 22.5 | 9.2 | 7.0 |
| 1901–10 | -8.7 | -0.4 | -23.6 | 41.7 | 38.2 | -1.9 | -37.7 | 46.6 | 15.0 | -17.9 |
| 1911–20 | 0.4 | 7.6 | -10.3 | -5.4 | 81.7 | -4.2 | -21.7 | 10.5 | 30.5 | -32.9 |
| 1921–30 | 12.7 | 21.7 | -3.3 | 26.2 | 30.0 | 0.3 | 28.8 | 48.2 | -17.2 | -33.8 |
| 1931–40 | -52.7 | -23.1 | 66.7 | 4.1 | 38.5 | 24.8 | -32.8 | 28.1 | -2.9 | -12.7 |
| 1941–50 | -15.4 | 7.6 | 13.8 | 12.1 | 26.6 | -8.1 | 2.2 | -2.1 | 12.9 | 17.6 |
| 1951–60 | 14.4 | 8.4 | -3.8 | 44.0 | 20.8 | 2.3 | -12.8 | 34.0 | 16.4 | -9.3 |
| 1961–70 | 18.7 | -10.8 | 17.0 | 14.6 | 10.9 | -18.9 | 15.2 | 4.3 | -15.2 | 4.8 |
| 1971–80 | 6.1 | 14.6 | -16.6 | -27.6 | 38.3 | 17.9 | -17.3 | -3.1 | 4.2 | 14.9 |
| 1981–90 | -9.2 | 19.6 | 20.3 | -3.7 | 27.7 | 22.6 | 2.3 | 11.8 | 27.0 | -4.3 |
| 1991–00 | 20.3 | 4.2 | 13.7 | 2.1 | 33.5 | 26.0 | 22.6 | 16.1 | 25.2 | -6.2 |
| 2001–10 | -7.1 | -16.8 | 25.3 | 3.1 | -0.6 | 16.3 | 6.4 | -33.8 | 18.8 | 11.0 |
| 2011–20 | 5.5 | 7.3 | 26.5 | 7.5 | -2.2 | 13.4 | 25.1 | -5.6 | 22.3 | 7.2 |
| 2021–30 | 18.7 | -9.4* | ||||||||
| 11 up 8 dn | 11 up 8 dn | 9 up 10 dn | 13 up 6 dn | 15 up 4 dn | 11 up 8 dn | 10 up 9 dn | 14 up 5 dn | 13 up 5 dn 1 flat | 11 up 8 dn |
* To date
As to the year just ending, 2022 has been the worst year ending in 2 since 2002. Besides 2002, the years 1842 and 1932 were not very good, either. With the DJI currently falling, the key area to watch is 32,000. A break
below that level could be the start of another powerful leg to the downside, although we continue to view this for the moment as a correction to the run-up from the October low to the recent December high.
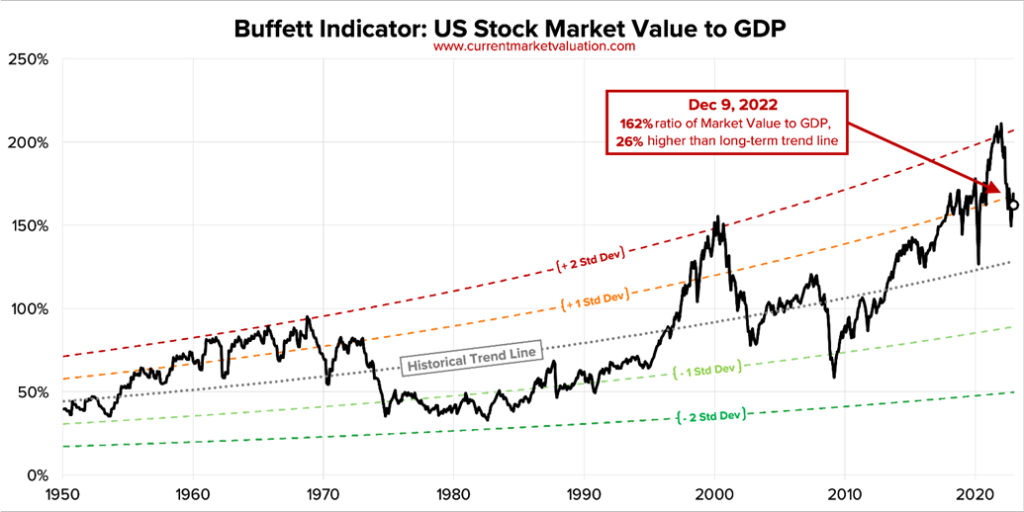
A measure of the value of the stock market is seen in what is known as the Buffett Indicator, named after billionaire Warren Buffett. This simple indicator is a ratio of the U.S. stock market value divided by GDP. Buffett has called this indicator “the best single measure of where valuations stand at any given moment,” even if he has walked that back bit, agreeing there are other indicators as well. But it remains a very interesting indicator. As noted, the indicator at 162% is still 26% above its long-term trend line. As we always say, everything eventually returns to the mean. That suggests we could still have a lot further to fall.
One area of considerable concern is real estate. Here in Canada, housing prices have already fallen on average 12% from their highs. There are predictions that ultimately the housing market could fall by 30%. Many are finding themselves unable to keep up with higher mortgage payments, given hikes in mortgage rates, and numerous early buyers are being asked for higher down payments which they don’t have. Early investors in unbuilt housing are also finding themselves in trouble. While the sub-prime mortgage market isn’t what it was during the housing bubble of the early 2000s, there are enough problems that a housing crash almost appears to be inevitable. New and existing home sales are falling as are prices.
But it is in the commercial real estate market that real problems could develop. With many office towers still sitting relatively empty as workers continue to work remotely, it is sparking concerns that we could see a commercial real estate collapse. It is, of course, not the first time, but nonetheless, it does translate into falling prices and falling construction of new buildings. The TSX Real Estate sub-index has fallen 24% thus far in 2022 while the S&P 500 Real Estate Index is down 28%.
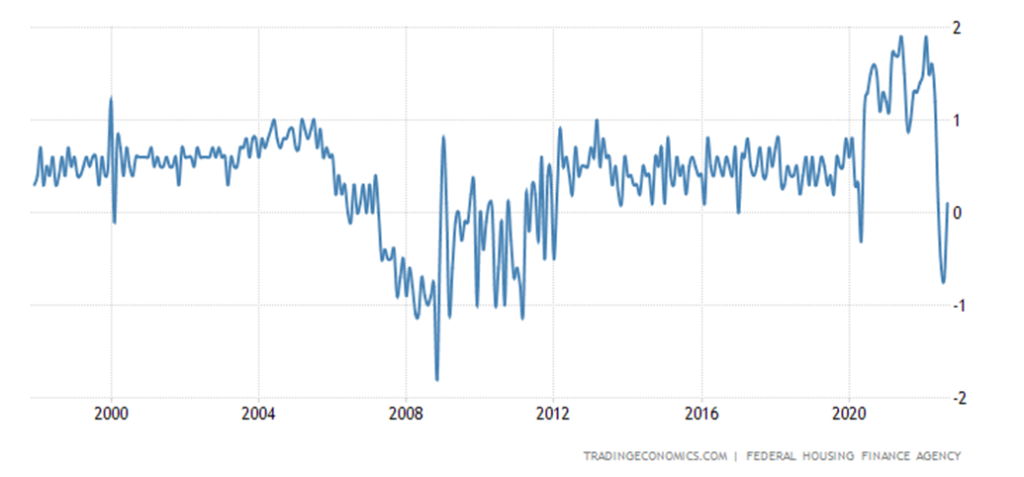
The U.S. House Price Index month over month (m-o-m), shown below, appears to be just starting its decline. The index reached higher levels than it did during the early 2000s’ housing bubble. The big move came after the pandemic. The Case-Shiller home price index has been falling now for five consecutive months. The index, however, is down only about 4% from its high in June 2022. Construction spending has been on the decline since January 2022.
U.S. House Price Index 1997–2022 M-O-M
Bonds
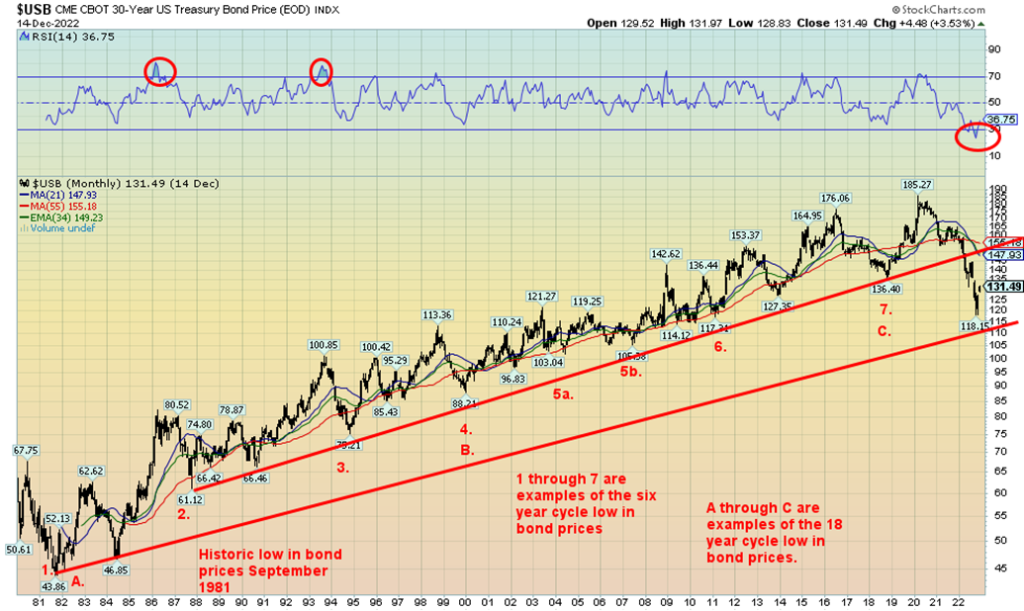
If anyone thought that bonds might be a safe haven in 2022, they were sadly mistaken. The bond market has suffered its worst setback since the late 1970s. Our long-term chart of the U.S. 30-year bond below shows that it has broken the long uptrend that got underway with the low in 1987. The 30-year found support near the uptrend line from 1981. The long bond fell a sharp 36% this past year (price). Yields rose from the opening level of 1.90% to a high of 4.40% in October before finding some bids to take it back near 3.50%. Our six-year cycle low is not really due until 2024 but that can range from 2023–2025. With the long bond breaking its long-term support, the 1981–2021 bond bull is officially over. Have we now entered a long-term bear market for bonds similar to what we saw during the 1970s? With our cycle low most likely not yet in, we could see the 30-year exceed that 4.40% high sometime in 2023. Price-wise, a breakdown under 110 for the 30-year (USB) could prove to be quite negative.
30-Year U.S. Treasury Bond 1980–2022
The world is laden with debt—over $300 trillion of it. During the Great Recession of 2007–2009, global debt was only $140 trillion. Encouraged by ultra-low interest rates and a belief that the Fed had their back, corporations, sovereigns, and consumers gorged on debt over the past dozen years. And that high level of debt doesn’t account for the huge amount of debt in currency swaps, as noted by the Bank for International Settlements (BIS) in a recent article. The BIS estimates that could add an additional $80 trillion of debt. Total U.S. debt (government, corporations, consumers) went from $50.9 trillion in 2008 to $93.6 trillion today, a gain of 83.9%. A large portion of that debt was the U.S. Federal Government which dealt with the aftermath of the financial crisis of 2008 and the 2020 pandemic. U.S. Government debt, the largest in the world, rose to $31.4 trillion from $11.0 trillion in 2008, a gain of 185%. In the U.S., total debt to GDP is now at 363% vs. 358% in 2008. Other G7 countries such as the U.K. and Japan have total debt-to-GDP ratios over 600%.
Problems are beginning to surface, particularly in sovereign debt. A sovereign debt crisis could still explode in 2023. Russia has been artificially put into default by the U.S. But others such as Venezuela, Argentina, Afghanistan, Pakistan, Sri Lanka, Ukraine, Belarus, Middle Eastern countries including Libya, Iraq, Syria, Lebanon, Yemen, and in Africa Sudan, Zambia, Zimbabwe, Egypt, Tunisia, Kenya, Ethiopia, and Ghana are either in default or close to it. In Latin America, El Salvador and Ecuador lead the list after Argentina and Venezuela. None of this includes the collapsing property market in China or the stress on property loans (mortgages) in North America (Canada and U.S.) as debt default looms for corporations and consumers alike. What hasn’t happened is a major bankruptcy such as a Lehman Brothers moment that could trigger even more defaults, spreading into the $1–2 quadrillion derivatives market (face value, not actual risk). We all remember AIG and its near collapse at the height of the 2008 financial crisis with its mountain of Credit Default Swaps (CDS). More recently there has been trouble surrounding the giant Swiss bank Credit Suisse. The risk is clearly there. Huge funds such as Blackstone have closed off withdrawals from real estate funds, fearing a major liquidity crisis. Blackrock, the world’s largest fund with AUM upwards of $10 trillion is facing its third consecutive month of withdrawals. We believe it is a question of when a major bankruptcy could occur, not if this could happen, which in turn could trigger a global liquidity crisis. Do the central banks of the world have the wherewithal to bail out the world once again? We suspect not. Loans/deposits would instead be turned into equity.
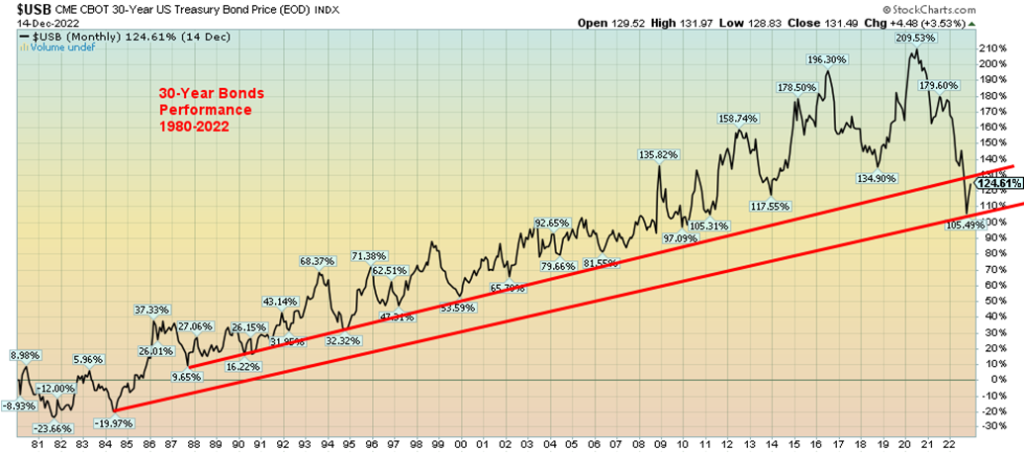
U.S. 30-Year Bonds Performance 1980–2022
It is rather interesting that GaveKal, an institutional economic research firm headed by Charles Gave has noted that the real risk in the bond market is, as we have noted above, in the public sector (sovereigns) and not necessarily in the private sector. As we have also noted, GaveKal points out that record ultra-low interest rates over the past dozen years have led to massive borrowings, not necessarily for productive purposes but for purposes of speculation and asset purchases, including stock buybacks. This suggests to GaveKal that the coming crisis will be not be a deflationary depression as we saw in the 1930s but an inflationary depression (think stagflation on steroids). Inflation can actually wipe away a lot of debt. One doesn’t have to default but instead inflation cheapens one’s debt. That’s good for the Western economies, but it does not necessarily save the long list of developing countries noted above. Many of them will default or are in default already. And that is a global financial problem.
GaveKal have noted that the assets to own are shares of public multinational companies that produce essentials in economies and sell them around the world. Gave said that platform companies, those companies who focus on high-end design and marketing in major Western markets while outsourcing manufacturing to low-cost countries will do poorly. Gave also noted that real estate will underperform.
Gold and the U.S. Dollar
Surprisingly, or maybe not, GaveKal did not mention gold, an asset that has been shown to perform during periods of severe economic stress, geopolitical risks, and in periods of either inflation, deflation, or stagflation. The stagflationary 1970s is a prime example of when gold was a major performer, gaining almost 2,400% from 1970 to 1980. Gold cannot be destroyed and does not tarnish. Gold also has no liability, unlike stocks, bonds, and real estate. It is also more transparent than crypto, although that hasn’t stopped scams that can occur when the gold bars you bought turn out to be tungsten, not gold.
Gold bugs may be frustrated that gold does not yet appear to be responding to all of the geopolitical and economic problems. Instead, gold has continued to trade in what many believe is a huge cup and handle formation.
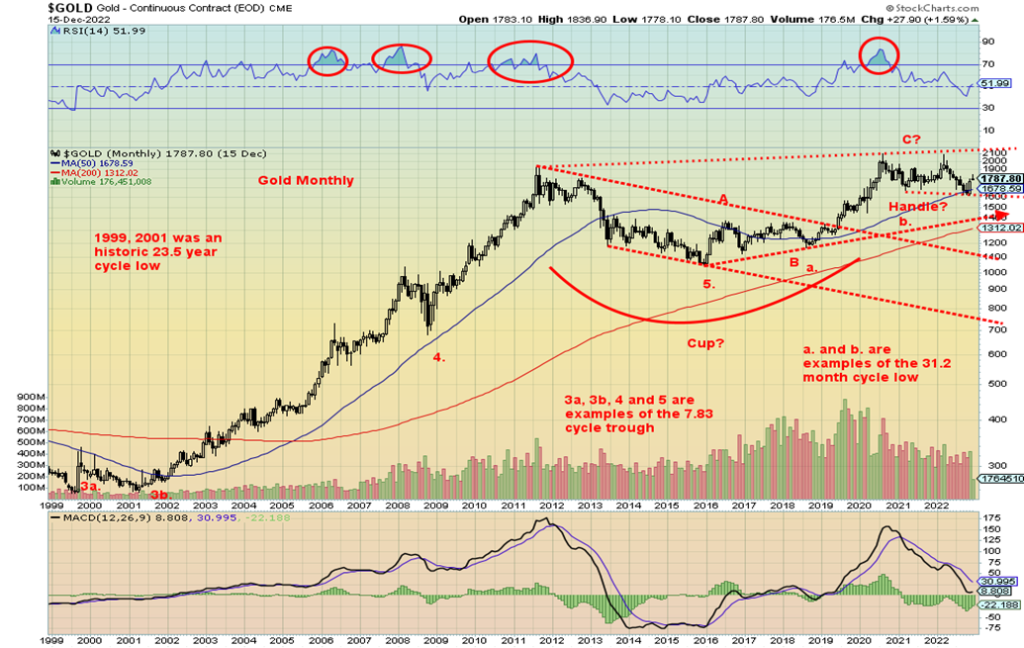
If the cup and handle pattern is correct, then gold should break out to new all-time highs above $2,100 and target up to at least $3,000. However, we are concerned that the major cycle lows are not as yet in. The recent lows were not met with panic although sentiment was quite low. If the current rally attempt should fail to break out to new highs, then we could yet face a swift collapse that could take us down to long-term support lines near $1,300 to $1,400. Nothing should be taken for granted, despite the uber-bullishness of many.
While we show it, gold’s decennial cycle is not definitive. The last year ending in 3 was 2013 and it was a disaster year for gold bugs. But then 1973 was a banner year for gold. Overall, we’ve failed to find a consistent pattern in gold’s decennial cycle. However, it is worth nothing. There are still a couple of weeks left in the month so gold could still crawl back to a small gain on the year. But right now, it is headed for a small loss. We show the 10-year decennial cycle for gold below.
10-Year Gold Cycle
Annual % Change in Gold
Year of Decade
| Decades | 1st | 2nd | 3rd | 4th | 5th | 6th | 7th | 8th | 9th | 10th |
| 1961–70 | -0.5 | 10.7 | 6.2 | -8.9 | ||||||
| 1971–80 | 16.5 | 48.9 | 75.6 | 60.6 | -23.3 | -3.8 | 23.4 | 36.5 | 134.8 | 10.9 |
| 1981–90 | -32.5 | 12.7 | -14.4 | -20.0 | 6.9 | 23.1 | 20.1 | -15.7 | -1.8 | -1.6 |
| 1991–00 | -10.6 | -5.9 | 17.6 | -1.9 | 1.0 | -4.9 | -21.5 | -0.2 | 0.1 | -6.0 |
| 2001–10 | 2.6 | 24.8 | flat | 25.6 | 18.2 | 22.8 | 31.4 | 5.8 | 23.9 | 29.8 |
| 2011–20 | 10.2 | 7.0 | -28.2 | -1.5 | -10.4 | 8.6 | 13.7 | -2.1 | 18.9 | 24.4 |
| 2021–30 | -3.5 | -1.6* | ||||||||
| 3 up 3 dn | 4 up 1 dn | 2 up 2 dn | 2 up 3 dn | 3 up 2 dn | 3 up 2 dn | 4 up 2 dn | 3 up 3 dn | 5 up 1 dn | 3 up 3 dn |
We have in the past noted gold’s cycles. The longest, according to Ray Merriman of MMA Cycles (www.mmacycles.com), is 23.5 years. He believes that was seen with the low in 1976 and again with the double bottom in 1999 and 2001. Gold does not have a long history of trading freely, so this cycle is hard to pinpoint. We prefer the 1999 low as it was 23 years after 1976. But the 2001 low was also within range. Irrespective of this, it pegs the next one to occur anywhere centered around 2022–2024 +/- 4 years. We cannot say with any clarity that the low is in. The sub-division of the 23.5-year cycle is 7.83 years +/- 8 months and this is a little clearer with lows from 1976 seen in 1985, 1993, 1999/2001, 2008, and 2015. That pegs the next low to be somewhere between February 2023 and June 2024. Despite recent signs that gold could rise from current levels, we cannot say the 7.83-year cycle low is in unless we see new all-time times on this move.
The 7.83-year cycle can break down into two cycles of about four years or three cycles of 31.3 months. The current 7.83-year cycle saw lows in September 2018 and again more recently in October 2022. The March 2020 collapse might have also been a four-year cycle low, given it was 51 months from the December 2015 low. So, what we are currently witnessing may not be the start of a new up-wave for gold but merely the rise for the third and final phase of the 7.83-year cycle. That tells us once the next top is in, we could still collapse to
potential targets as low as $1,200 with major support as noted between $1,300 to $1,400. In the interim, a rally could take us back to $2,000, but first we have to clear significant resistance at $1,825/$1,875. If that fails, then we have already topped. A breakdown under $1,700 would be a negative signal that we have most likely topped and are now headed for our historic 23.5-year, 7.83-year cycle lows.
US$ Index 1973–2022
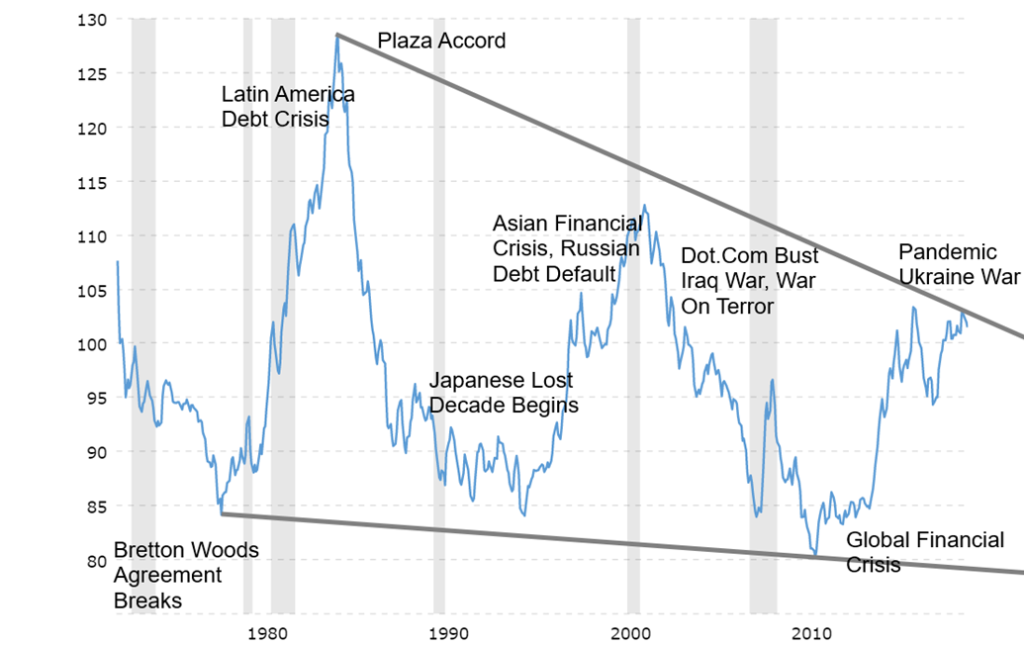
Gold tends to seesaw with the US$ Index. The 1970s was very positive for gold after the breakdown of the Bretton Woods agreement when president Nixon ended the convertibility of gold in August 1971. Gold topped in 1980 and for the next few years gold collapsed into the 1985 low that largely coincided with the Plaza Accord to deal with the then overvalued U.S. dollar. Gold fell sharply again into lows in 1993, then bounced around for the next several years before beginning a multi-year rally in 2001. That coincided with the events of the early 2000s such as the dot.com bust and 9/11, followed by the war on terror and invasion of Iraq. Gold topped in 2011 following the 2008 financial crisis, then fell sharply into the 2015 low. Since then, gold has struggled to rise despite run-ups in 2020 and again in 2022. The events of the global financial crisis and the pandemic coupled later with problems in the EU, Russia, and China helped spark a run into U.S dollars. A rising U.S. dollar is not good for gold nor are rising interest rates.
There are now threats to the U.S. dollar. The global dominance of the U.S. and the U.S. dollar was highlighted when the U.S. effectively banned several Russian banks from SWIFT, the global payments system. Previously, some Iranian banks had also been banned. Russia and China view this as effectively a threat, given the U.S.’s dominance in global financial institutions. It is their aim to create their own version of SWIFT, the IMF, and World Bank. Many countries, seeing how easily Russia and Iran were banned, also have issues with global U.S. hegemony and would be willing to join a new system. China and Saudi Arabia are talking of paying for oil transactions in yuan rather than dollars. This would be another direct attack on the dominance of the U.S. dollar and could in effect end the petro-dollar that has been in place since the Arab oil embargo of 1973.
Since then, Russia has hinted at demanding gold as payment for their oil, again overriding the U.S. dollar. Challenges to the dominance of the U.S. dollar as the world’s reserve currency would not go unanswered. Ask Saddam Hussein of Iraq or Muammar Gaddafi of Libya. Iraq was demanding euros for its oil rather than dollars and Libya was trying to create a pan-African cartel using the Arab gold dinar as currency. Both were a challenge to the supremacy of the U.S. petrodollar.
Central banks have been adding to their gold reserves, particularly the central banks of China and Russia. Central banks have been adding to their gold reserves now for fourteen consecutive years, following 20 years of declining reserves. Total CB gold reserves are now at their highest level since the 1980s.
Historically, currency wars have evolved into real wars. The currency wars of the late 19th and early 20th century where Germany was challenging the global hegemony of the United Kingdom and the pound sterling led directly to World War I. When it was over, the U.K. was no longer in a position to dominate and the U.S. dollar slowly became the world’s reserve currency, later enshrined in the Bretton Woods agreement of 1944 where the U.S. dollar was convertible to gold at $35/ounce. Now U.S. dollar dominance is being challenged. However, these things don’t play out overnight and do take time. As we have noted, a reserve currency does not last forever (https://www.youtube.com/watch?v=P5RiDEhjebM).
Gold will rise again. But until we determine these important cycle lows, expect gold to continue trading as it recently has with ups and downs and a risk that a downside collapse could still take place. Currently gold is struggling to break above the 200-day MA. A failure here and a breakdown under $1,700/$1,720 would be negative. To confirm a new upcycle, gold would need to break out over the 2020/2022 highs, just under $2,100.
Oil and Gas
WTI oil, we believe, is in the process of embarking on a new long-term uptrend. Our chart below of WTI oil shows that oil made important, possibly 18-year cycle lows in 1985, 2001, and 2020. 2020 may have marked a generational low for oil prices when it briefly turned negative at the height of the pandemic. The odds of ever seeing that again are virtually zero. Since then, oil has been facing headwinds with the Russia/Ukraine war, drawdowns of oil stocks, and, sanctions on numerous oil-producing countries such as Russia, Libya, Iran, and Venezuela. Russia is/was the world’s third-largest oil producer. Venezuela has the world’s largest reserves followed by Saudi Arabia, Canada, and Iran. But Venezuelan and Canadian oil are also among the world’s dirtiest oil. Saudi Arabia has been turning away from the West and Iran faces sanctions. In terms of demand, the U.S. is the largest consumer followed by China. As well, many countries such as Iraq and Syria are producing far below capacity as the countries largely lie in ruins and are dealing with insurgencies.
It is safe to say that, despite the ongoing shift to renewables, the demand for oil is not about to go away. But finding new sources is not easy as all the easy oil has been found. That leaves oil that’s in areas that are hard to find or difficult to get at, such as the environmentally-sensitive far North, under the sea, or in places that are very expensive to extract from, such as shale oil or tar sands oil.
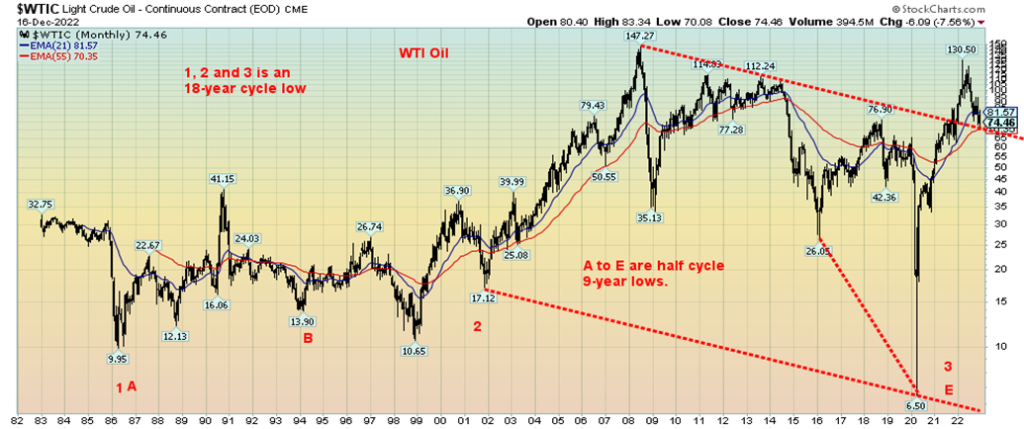
Above, our two charts show first WTI oil from 1982 to 2022. As noted on the chart, the 2020 low was most likely a historical, 8-year cycle low. Oil prices have broken the downtrend line from the 2008 high and are currently testing that breakout line. Once oil prices regain back above major resistance at $94 to $96, a new up leg should be underway. Technically, the chart looks very good for higher oil prices going forward. Risks remain in Russia/Ukraine and the Middle East as events there could blow prices up once again.
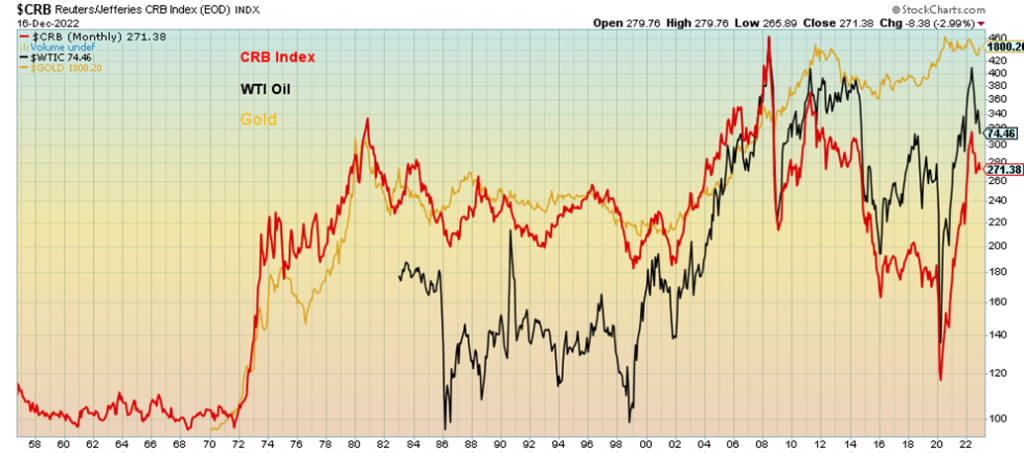
The second chart shows the CRB Commodity Index against both oil and gold. The CRB Index is a commodity index of 19 commodities made up of energy (crude oil, gas, heating oil, gasoline), agriculture (cocoa, coffee, corn, cotton, hogs, cattle, orange juice, soybeans, sugar, wheat), and metals/precious metals (aluminum, copper, gold, nickel, silver). It is probably no surprise that the CRB’s rises and falls are somewhat dependent on the price of oil and gold. Oil appears to be the closest fit.
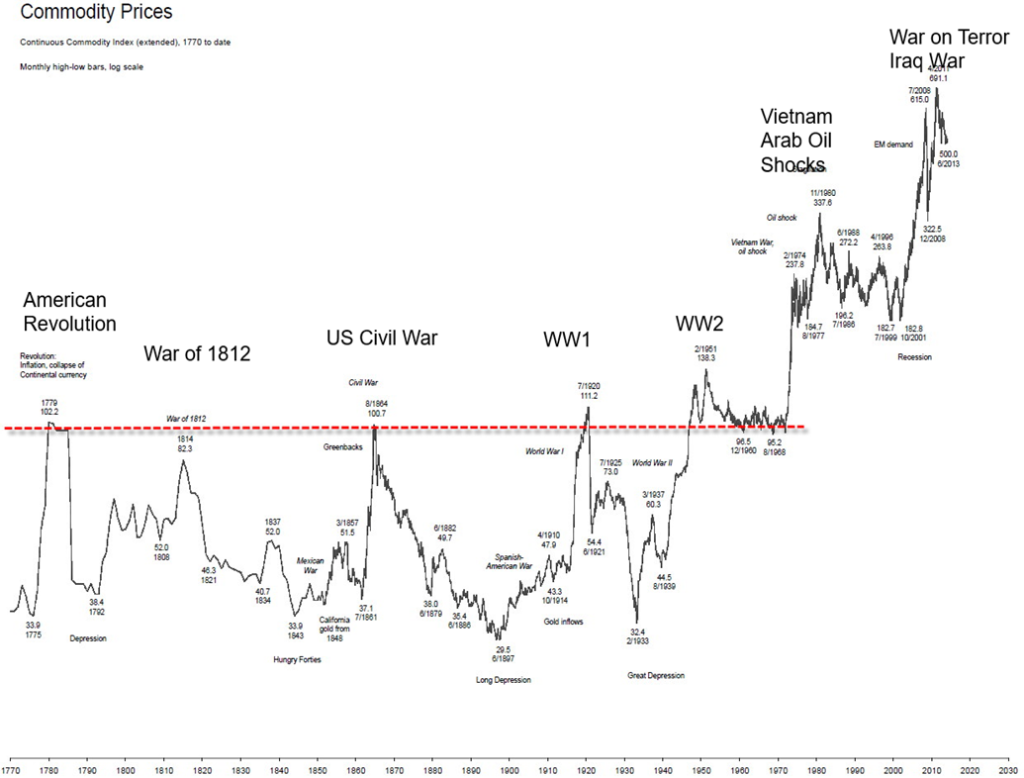
The above long-term chart of commodity prices since 1770 also highlights the role of war in the rise of commodity prices. All the commodity spikes were accompanied by war from the American Revolution through to the present Russia/Ukraine war that could still turn into World War III. The current commodity cycle is in a corrective mode. Another significant leg up could soon be underway with oil leading the way.
Conclusions
If you thought 2022 was bad, get ready for 2023. Bear markets such as we are witnessing are not just a one-year affair. They tend to be historic bears. While the average bear market is only just over a year, it is skewed with ultra-short bears such as the 40-day pandemic bear of March 2020. Since 1900 there have been 38 bear markets with DJI losses over 15%. Of that total, 11 or 29% have lasted just about two years or longer. The longest was the 1939–1942 bear lasting over 2.6 years. Currently, we are only about one year into this bear and it shows no signs of being over. Surprisingly, the Great Recession bear was only 1.4 years and the Great Depression bear lasted 2.4 years. But what they lost in length they made up in depth as the DJI fell 89% during the Great Depression and 54% during the Great Recession.
The Fed is keeping the pedal to the metal even as they have eased off on 75 bp hikes to 50 bp hikes. They should be at 5%+ by February following the 50 bp hike this past week. We are just starting to see the possible effects of layoffs and a slowing of the economy. Expect that to rise as we go into 2023. The major issues of 2022 are still around. Expect more wild weather, along with rising costs of dealing with these natural disasters. The burden is also falling disproportionately on developing countries which is driving the desire for people get out and move north to the developed countries. There is a growing divide between the developing countries and the developed world and it is creating considerable tension. The developing countries are more inclined to side with China and Russia as well as they view them as standing up to the dominance of the U.S. and the G7. But Western countries are not immune from the natural disasters. The Colorado River system in the U.S. is on the verge of collapse and could negatively impact millions as water tables recede.
Geopolitical and domestic political concerns remain high. There is no military solution to the war in Ukraine, which is expected to escalate, drawing in others. Tensions between the U.S. and China, including military tensions are not receding. Given coup attempts in three G7 countries over the past couple of years, domestic political tensions will continue to smolder and could erupt into violence. The massive amount of debt is not going anywhere and the risk of a major debt default keeps on rising. Aging demographics are working against the G7 countries and even China. Volatility will continue. Defensive measures remain paramount.
We are reminded of our old Boy Scout motto—be prepared.
“The only function of economic forecasting is to make astrology look respectable.”
—John Kenneth Galbraith, Canadian-American economist, diplomat, public official, intellectual, author of The New Industrial State (1967) + others, U.S Ambassador to India 1961–1963, professor of economics at Harvard University, Princeton University, and University of California Berkley; 1908–2006
Copyright David Chapman, 2
Markets & Trends
| % Gains (Losses) Trends | ||||||||
| Close Dec 31/21 | Close Dec16/22 | Week | YTD | Daily (Short Term) | Weekly (Intermediate) | Monthly (Long Term) | ||
| Stock Market Indices | ||||||||
| `S&P 500 | 4,766.18 | 3,852.36 | (2.1)% | (19.2)% | down | down (weak) | neutral | |
| Dow Jones Industrials | 36,333.30 | 32,920.46 | (1.7)% | (9.4)% | down (weak) | up | up | |
| Dow Jones Transport | 16,478.26 | 13,738.04 | (0.2)% | (16.6)% | down (weak) | neutral | up (weak) | |
| NASDAQ | 15,644.97 | 10,705.41 | (2.7)% | (31.6)% | down | down | down (weak) | |
| S&P/TSX Composite | 21,222.84 | 19,443.28 | (2.5)% | (8.4)% | down | neutral | up | |
| S&P/TSX Venture (CDNX) | 939.18 | 576.26 | (0.2)% | (38.6)% | down | down | down | |
| S&P 600 (small) | 1,401.71 | 1,154.54 | (2.7)% | (17.6)% | down | down (weak) | neutral | |
| MSCI World Index | 2,354.17 | 1,983.30 | (0.2)% | (15.8)% | up | neutral | down | |
| Bitcoin | 47,907.71 | 16,960.99 | (1.2)% | (64.6)% | down | down | down | |
| Gold Mining Stock Indices | ||||||||
| Gold Bugs Index (HUI) | 258.87 | 221.96 | (2.5)% | (14.3)% | up (weak) | neutral | down | |
| TSX Gold Index (TGD) | 292.16 | 274.44 | (1.2)% | (6.1)% | up | neutral | down | |
| % | ||||||||
| U.S. 10-Year Treasury Bond yield | 1.52% | 3.48% | (3.1)% | 129.0% | ||||
| Cdn. 10-Year Bond CGB yield | 1.43% | 2.82% | (2.4)% | 97.2% | ||||
| Recession Watch Spreads | ||||||||
| U.S. 2-year 10-year Treasury spread | 0.79% | (0.70)% | 6.8% | (188.6)% | ||||
| Cdn 2-year 10-year CGB spread | 0.48% | (0.85)% | 11.5% | (277.1)% | ||||
| Currencies | ||||||||
| US$ Index | 95.59 | 104.66 | (0.1)% | 9.5% | down | neutral | up | |
| Canadian $ | .7905 | 0.7311 | (0.4)% | (7.5)% | down | down | down | |
| Euro | 113.74 | 105.86 | 0.5% | (6.9)% | up | neutral | down | |
| Swiss Franc | 109.77 | 107.05 | 0.1% | (2.5)% | up | up | down | |
| British Pound | 135.45 | 121.54 | (0.8)% | (10.3)% | up | neutral | down | |
| Japanese Yen | 86.85 | 73.19 | flat | (15.7)% | up | neutral | down | |
| Precious Metals | ||||||||
| Gold | 1,828.60 | 1,800.20 | (0.6)% | (1.6)% | up | neutral | neutral | |
| Silver | 23.35 | 23.33 | (1.6)% | (0.1)% | up | up (weak) | neutral | |
| Platinum | 966.20 | 1,000.00 | (3.5)% | 3.5% | up | up | up (weak) | |
| Base Metals | ||||||||
| Palladium | 1,912.10 | 1,706.60 (new lows) | (13.3)% | (10.8)% | down | down | down | |
| Copper | 4.46 | 3.76 | (3.1)% | (15.8)% | up (weak) | neutral | neutral | |
| Energy | ||||||||
| WTI Oil | 75.21 | 74.46 | 4.8% | (1.0)% | down | down | up | |
| Nat Gas | 3.73 | 6.60 | 5.6% | 76.9% | up (weak) | down (weak) | up | |
New highs/lows refer to new 52-week highs/lows and, in some cases, all-time highs.
__
(Featured image by Peng Wei via Unsplash)
DISCLAIMER: This article was written by a third party contributor and does not reflect the opinion of Born2Invest, its management, staff or its associates. Please review our disclaimer for more information.
This article may include forward-looking statements. These forward-looking statements generally are identified by the words “believe,” “project,” “estimate,” “become,” “plan,” “will,” and similar expressions. These forward-looking statements involve known and unknown risks as well as uncertainties, including those discussed in the following cautionary statements and elsewhere in this article and on this site. Although the Company may believe that its expectations are based on reasonable assumptions, the actual results that the Company may achieve may differ materially from any forward-looking statements, which reflect the opinions of the management of the Company only as of the date hereof. Additionally, please make sure to read these important disclosures.
David Chapman is not a registered advisory service and is not an exempt market dealer (EMD) nor a licensed financial advisor. He does not and cannot give individualised market advice. David Chapman has worked in the financial industry for over 40 years including large financial corporations, banks, and investment dealers. The information in this newsletter is intended only for informational and educational purposes. It should not be construed as an offer, a solicitation of an offer or sale of any security. Every effort is made to provide accurate and complete information. However, we cannot guarantee that there will be no errors. We make no claims, promises or guarantees about the accuracy, completeness, or adequacy of the contents of this commentary and expressly disclaim liability for errors and omissions in the contents of this commentary. David Chapman will always use his best efforts to ensure the accuracy and timeliness of all information. The reader assumes all risk when trading in securities and David Chapman advises consulting a licensed professional financial advisor or portfolio manager such as Enriched Investing Incorporated before proceeding with any trade or idea presented in this newsletter. David Chapman may own shares in companies mentioned in this newsletter. Before making an investment, prospective investors should review each security’s offering documents which summarize the objectives, fees, expenses and associated risks. David Chapman shares his ideas and opinions for informational and educational purposes only and expects the reader to perform due diligence before considering a position in any security. That includes consulting with your own licensed professional financial advisor such as Enriched Investing Incorporated. Performance is not guaranteed, values change frequently, and past performance may not be repeated.


Ecobnb Turns Sustainable Tourism Into Measurable Impact
Ecobnb’s sustainable tourism platform generated significant environmental and social impact in 2025, avoiding 58,207 kg of CO₂ and adding 583...


Sugar Markets Balance Biofuel Demand and Global Supply
Sugar markets in New York and London were mostly unchanged as the Iran conflict renewed interest in biofuels. Drought concerns...


The $40 Trillion Trap: Disinflation Is Not Deliverance
U.S. debt has reached $40 trillion, with $24 billion weekly interest, while deficits accelerate. Despite disinflation in CPI, from cooling...


FinTech Matures as AI and Infrastructure Drive the Next Growth Phase
Fintech markets are entering a mature phase, shifting from rapid growth to consolidation, specialization, and sustainable business models. Zurich and...


Bitcoin, and Ethereum Rise, While Cardano Enters Transition
Bitcoin and Ethereum posted modest weekend gains, supported by ETF inflows. A new proposal may protect Bitcoin from quantum threats....
 |
|
 |  |
 |
|
-

 Impact Investing2 weeks ago
Milione Secures €80M EIB Financing to Drive Venice Airport’s Green Transformation
-

 Biotech5 days ago
Legend Biotech: Growth Driven by CAR-T Innovation and Carvykti Expansion
-

 Impact Investing2 weeks ago
ECB Adds Climate Risk Factor to Collateral Rules
-

 Biotech7 days ago
Alzheimer’s Study Reveals Immune Pathway Behind Women’s Higher Vulnerability and Potential New Treatment Approach