Featured
Why Interest Yields Were Higher and Markets Lower this Past Week
It was a volatile week but markets finished the week down small from the previous week. The big news was the U.S. jobs report that came in better than expected. Continued fears about inflation coupled with the stronger jobs report sent interest yields higher and markets lower. The jobs report is the subject of this week’s Chart of the week.

It came as no surprise that the Bank of Canada (BofC) hiked its key interest rate by 50 bp on June 1 to 1.5%. This was widely expected. The Bank also signaled that it will hike interest rates further in upcoming meetings to bring down the rate of inflation. They have a long way to go. The last official inflation rate was at 6.8%, the highest level since January 1991, leaving the spread at negative 5.3%. Nonetheless, the rate hike will reverberate through the banking system and, with the Canadian 10-year Government of Canada bond (CGB) inching back over 3.00%, it could have an immediate impact on all sorts of interest rates, especially mortgage rates. Canadian banks immediately raised their prime lending rate by 50 bps as well to 3.7%. That has an impact on many loans and mortgages, particularly variable rate loans and mortgages.
Later this month the Fed is also expected to hike the Fed rate 50 bp. Both the BofC and the Fed have indicated they won’t be finished with these rate hikes and both are expected to hike at least another 50 bp in July. Some are even expecting the Fed to become more aggressive and hike 75 bp at the June 14/15 meeting.
However, all of this is having a potentially down impact on the economy. The U.S. economy contracted by 1.5% in Q1 2022. That left the year-over-year (y-o-y) growth rate at 3.5% vs. 5.5% in Q4 2021. Canada expanded by 0.8% in Q1 2022 which was also below expectations. The annual y-o-y to Q1 2022 slipped to 2.9% from 3.2% the previous quarter. We are seeing a slowing in housing starts and sales. Housing prices are already beginning to fall, along with sales. Home sales fell 12.6% in April and average selling prices were down by 3%. Whether this turns into a trend remains to be determined. But with more rate hikes planned, the odds are high that sales will continue to falter and prices will fall further. Some are predicting an overall decline of 20% for housing prices in Canada.
Canada BofC Rate, Canada Inflation Rate 1997–2022
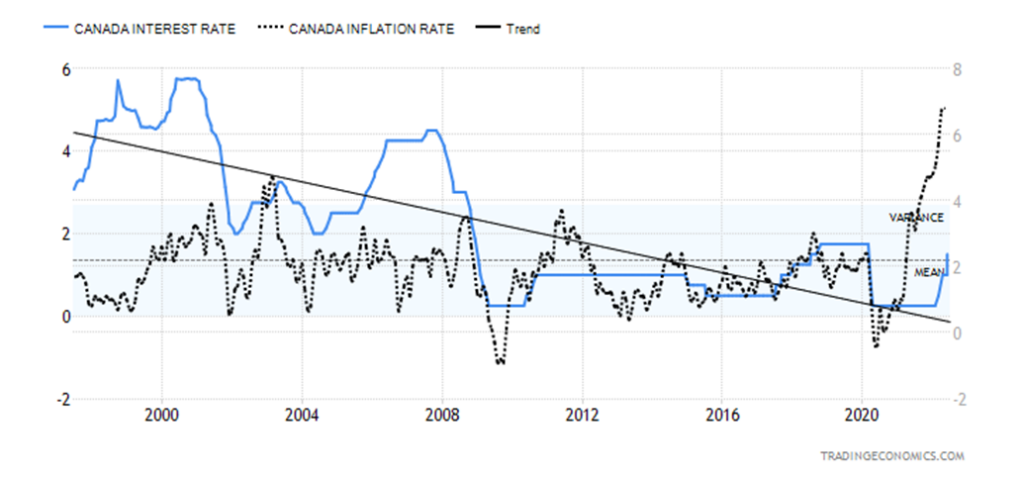
As the chart shows, the BofC rate has a long way to go to catch up to the current rate of inflation. Note how up to 2008 the rate of inflation was mostly below the BofC rate. However, following the 2008 financial crisis and the Great Recession of 2007–2009, the BofC rate has been largely below the rate of inflation, albeit not significantly. Until now, that is. The BofC has indicated they will need to raise rates to 3%. But that would still leave a negative spread if inflation doesn’t come down. In 1980 the Fed hiked rates above the rate of inflation to bring it down. The BofC would have to hike the bank rate to at least 7% to accomplish that. What would that mean for loans and mortgages? A steep recession would likely follow.
However, inflation in Canada is being driven primarily by food and energy and by external factors beyond the control of any one government. The Ukraine/Russia war, the China shutdown (due to the Omicron variant) disruption of many supply chains, the general supply chain disruptions that arose as a result of the pandemic, and the surge in demand following the lifting of mandates have all contributed to inflation. Given supply chain disruptions and other factors, the surge in demand put additional upward pressure on prices and hiring was unable to keep up with the sudden surge in demand.
The result is economic growth is beginning to falter. A number of economic numbers have come in below expectations. Numerous economic pundits, former central bank officials, and prominent CEOs and companies are all predicting a recession. The CEOs include the head of a major U.S. bank and former central bank officials include the former Governor of the BofC. The head of J.P. Morgan Chase, Jamie Dimon, declared that a “hurricane” is coming. We’ll continue to monitor the yield spreads 2–10 and 3M–10 for signs that a recession is imminent. So far, those spreads have remained positive. It is even possible that, given the weak GDP growth numbers in Q1, the recession is already underway. The employment numbers could be a further clue. The other side of this is, that with so many now leaning towards recession, the trade is becoming recession heavy.
U.S. GDP Annual Growth Rate, Canada GDP Annual Growth Rate 1997–2022
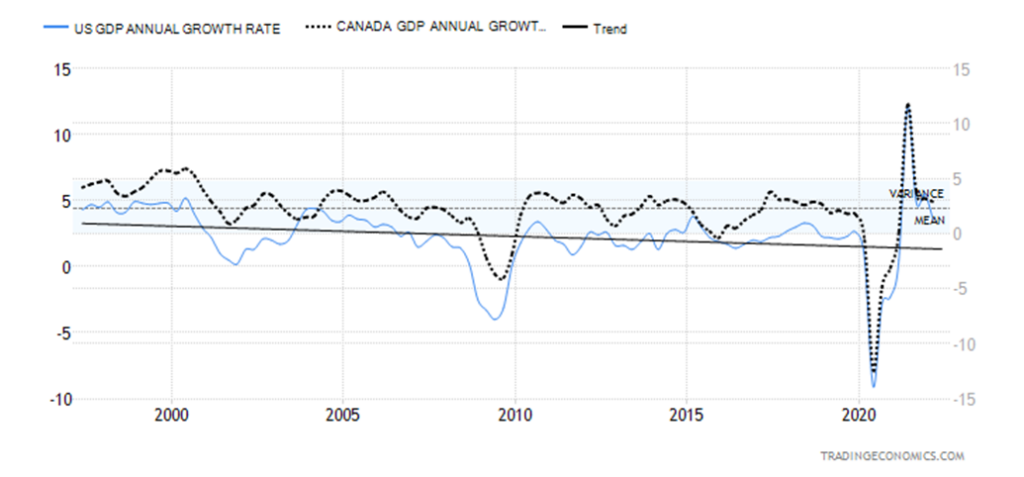
We have noted potential recession signs in the past. When inflation exceeds 5% a recession is sure to follow. As well, with unemployment (U3) in the U.S. down to 3.5%, it is what we call full-employment. Canada’s unemployment rate is the lowest rate on record since 1976. This is regardless of the huge number of job openings and that U.S. employment continues to lag below the levels seen in February 2020 while Canada has long surpassed that level. Since 1950 there have been 11 recorded recessions in the U.S. That works out to one roughly every four and half years. Of the 11 recessions, six recorded negative growth of over 2%. That’s one every eight years. Three recessions saw official unemployment (U3) surge above 10%. The three are the 1981–1982 recession, the Great Recession in 2007–2009, and the pandemic recession in 2020.
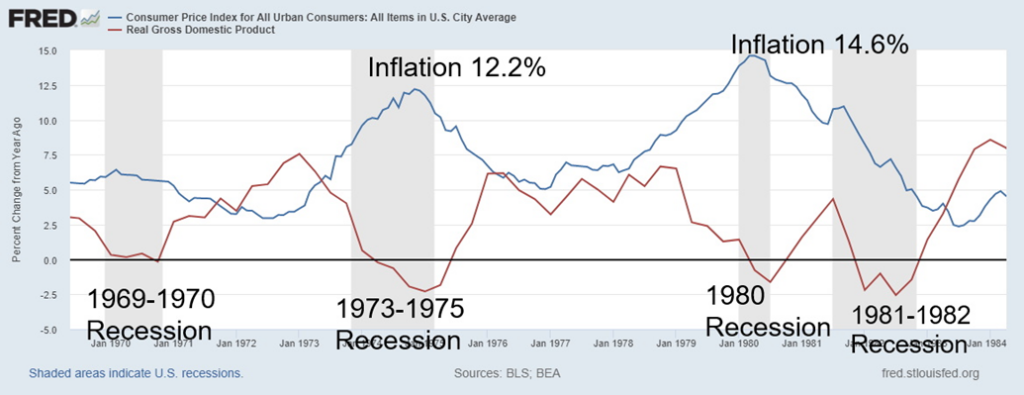
To show how high inflation impacts the economy, our chart below showing U.S. inflation and real GDP growth during the 1970s correlates, at least visually, that high inflation = recession. Everyone thought inflation would fade quickly. Even former Fed Chair and current Treasury Secretary Janet Yellen did a mea culpa, admitting she was wrong about inflation. She wasn’t alone.
But recession doesn’t necessarily mean economic collapse. Energy prices are high, but the economy is lot less dependent on energy than it was in the 1970s. Also, both corporate and individual balance sheets are stronger. Spending may slow during a recession but most things will remain about the same. On the other side, there are also a lot more that are one pay cheque from homelessness and that could be problem. The Fed is belatedly fighting inflation, but compared to the 1970s, it is tackling the issue a lot sooner. During the 1970s the Fed didn’t act until late in the game when double-digit inflation had already been around for most of the decade.
While the Fed is starting QT (quantitative tightening) to roll off its balance, signs that the economy is faltering could quickly put an end to QT and we could then see another round of QE (quantitative easing). What’s worrisome is not so much the high level of government debt but the high level of corporate and household debt, particularly in Canada. During a recession, bankruptcies are sure to rise. But could a major bankruptcy occur? In the U.S., some 57% of corporate debt is rated BBB, the lowest investment grade. In 2007 that number was 40%. A lot of firms could be pushed into junk bond status during a recession. That in turn could have a negative impact on many pension funds who are buyers of these bonds as they are not allowed to hold below investment grade.
U.S. Inflation, Real GDP Growth 1969–1984
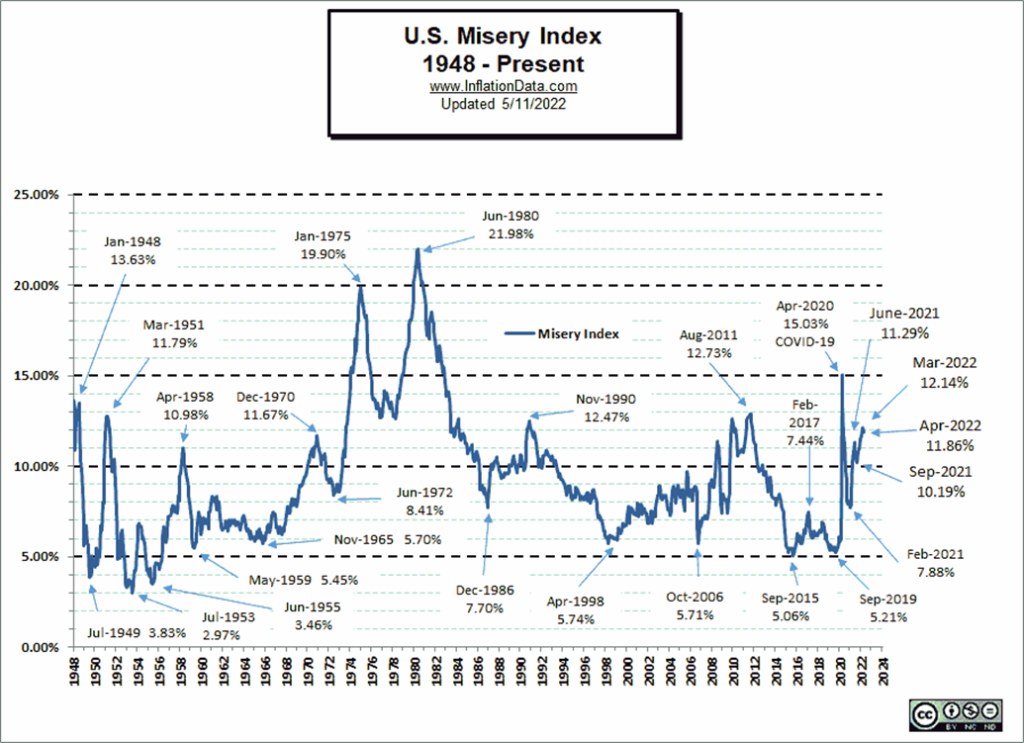
Stagflation is another word that is being tossed around. Stagflation is a combination of the high inflation and stagnant economic growth. As a result, it is no surprise that the “Misery Index” is rising. The Misery Index is a combination of employment and inflation. How to deal with stagflation? Stimulating economic growth is the main tool, but that most likely requires a lot more QE—which is what got us into this in the first place, as monetary growth is a contributor to inflation. Another would be to bring down oil prices. But that would require bringing peace to the Ukraine/Russia conflict, persuading OPEC countries to pump more oil, and lifting sanctions on Russia, Iran, and others. None of that is about to happen. Pressure on the home front might help as support for the war in Ukraine is beginning to wane as consumers become discouraged with the high cost of fuel at the gas pump.
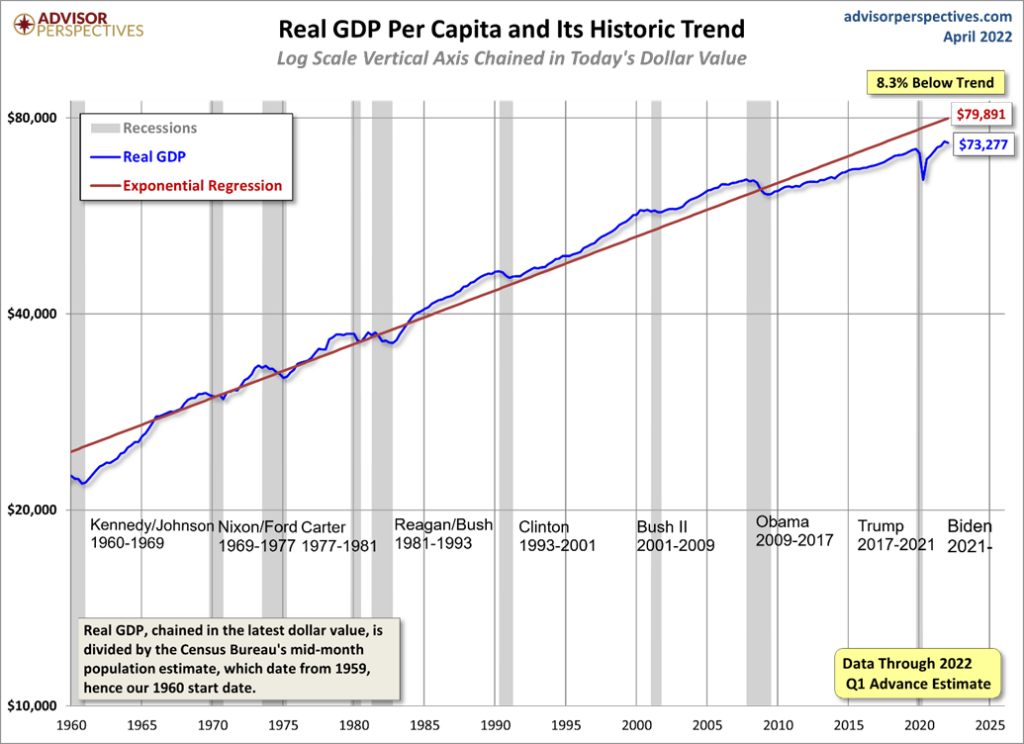
It is interesting to note that the U.S. economy has been underperforming its long-term mean. Below is a chart from Advisor Perspectives (www.advisorperspecties.com) that shows the performance of real GDP (GDP adjusted for inflation) vs. an exponential regression line (the line that best fits the data over a period and shows the long-term trend). The U.S. economy has been underperforming since the Great Recession of 2007–2009. In April 2022 real GDP lies 8.3% below the trend. In May it is widening further. As we tip over into a recession, or at least a slowdown, the differential is liable to widen further. But a recession may not be the
cure-all for inflation. As long as the war persists, energy prices could remain high for an extended period and go even higher. And energy plays a big role in the economy. even if it is less than what it was in the 1970s.
The combination of high inflation and low or stagnant economic growth is precisely the recipe that did-in the 1970s. Not that this one will be same, but there are similarities. The Fed is starting to try to quell inflation a lot sooner than it did back in the 1970s. But will it succeed? Especially if one of the main factors behind inflation, energy prices or specifically oil prices, is not something the Fed can control. Nor can the Fed control the supply disruptions that are causing shortages. Nor can the Fed fill all the open job positions that may be going unfilled because there are fewer people in the workforce (see labour force participation rate), people remain nervous about COVID, others have taken more responsibility for having to care for kids or aging parents, or people won’t or can’t move to where the jobs are.
One encouraging sign for bulls is during the inflationary 1970s while the stock market faltered, commodity prices soared. Gold soared 1,191% from the start of 1969 to the end of 1982. The S&P 500, on the other hand, gained only 35%. The CPI was up 174%, the CRB Index gained 132% while bonds, represented here by the U.S. 30-year treasury bond (TNX), lost 40.5% before coupons. We show a chart below. Inflation/stagflation periods are characterized by stocks and bonds being weak, while commodities and gold are strong.
The current inflationary period is just over one year old. We are only now starting to see signs of a potential softening for the economy. It’s still early. The worst may be yet to come.
Performance Selected Assets 1969–1982
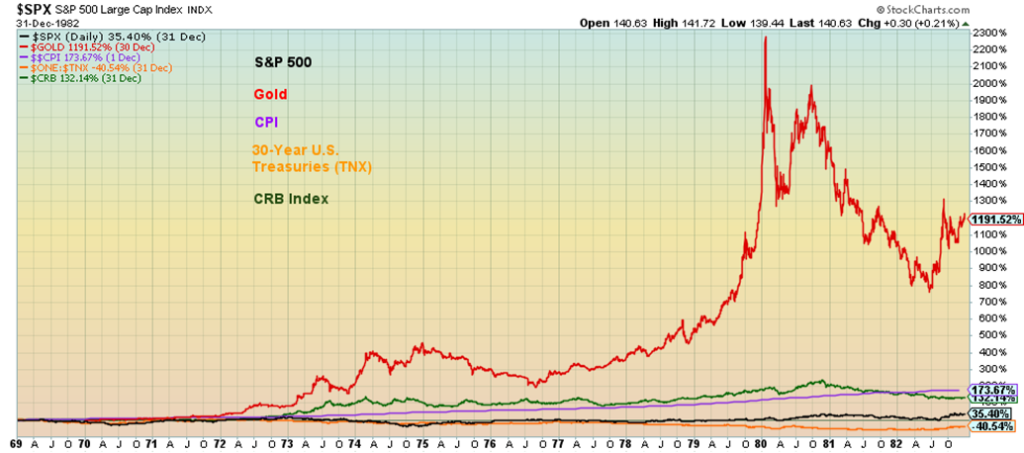
Chart of the Week
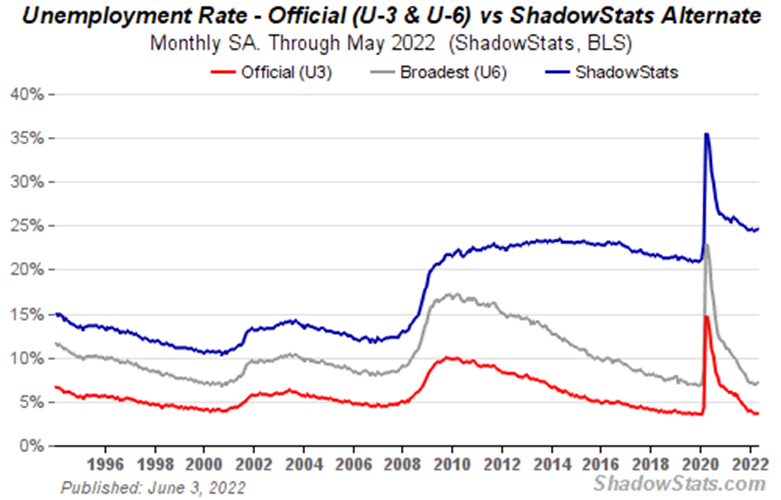
Despite rising inflation, war (over there), supply disruptions, and almost daily mass shootings, the U.S. added 390,000 jobs in May. That was above the expected 325,000 but still the lowest gain since last April 2021. Despite the gain, the U.S. economy is still short some 822,000 jobs, below February 2020. The other positive aspect of the job gains is that those with full-time jobs jumped 733,000 in May vs. a decline of 325,000 part-time jobs. Still, the most notable job gains were in leisure and hospitality (84,000), professional and business services (75,000), transportation and warehousing (47,000), and manufacturing (18,000). Surprisingly, retail fell 61,000.
The unemployment rate (U3) was unchanged at 3.6% while the U6 unemployment rate (U3 plus marginally attached, plus employed part-time for economic reasons) rose to 7.1% from 7.0%. In February 2020 the rate was 7% as well while the U3 rate was 3.5%. The Shadow Stats (www.shadowstats.com) rate (U6 plus long-term unemployed over one year, discouraged workers, and those defined out of the workforce in a 1994 revision) was 24.6% vs. 24.5% in May and 21.3% in February 2020. Even as the official unemployment rate stays steady, the U6 and Shadow Stats rate rise. A reflection on the labor force participation rate (LFPR). The LFPR rate rose to 62.3% from 62.2% but that remains down from February 2020 when it was 63.4%. The LFPR peaked at 67.3% back in 2000. A lower LFPR translates into a lower unemployment rate. In 2000, when the LFPR was 67.3%, the unemployment rate (U3) was 4%. The actual labor force was some 22 million lower.
The employment-population ratio was largely unchanged at 60.1% vs. 60.0%. In February 2020 it was 61.2% again, reflecting the fact that more people were engaged in employment than is the current case. Not in labor force slipped to 99,521 thousand from 100,100 thousand. It was 95,393 thousand back in February 2020. Of that total, some 25.2 million are disabled and 56.5 million are retired.
Average Weekly, Hourly Earnings vs. CPI 2007–2022
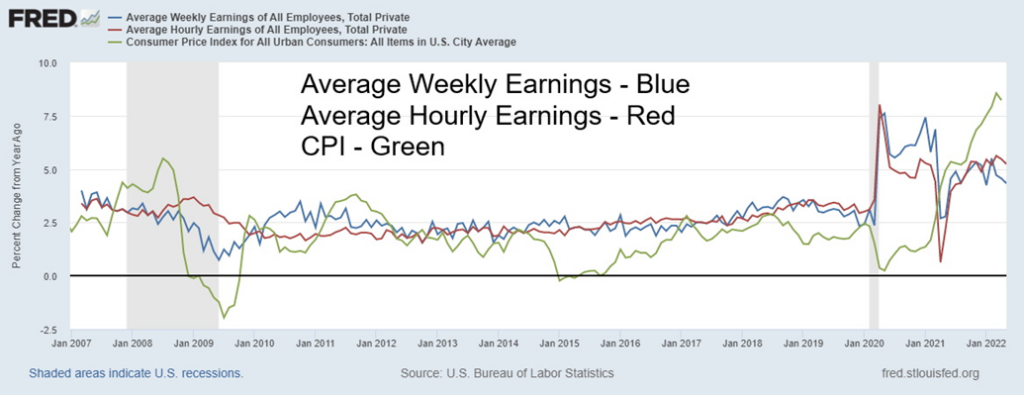
Where it is interesting is that average hourly earnings rose 0.3% in May and are up 5.2% y-o-y. Average weekly earnings were also up 0.3% in May but are up only 4.3% y-o-y. The CPI on the other hand is up 8.2%. Wages are still not keeping up with inflation and that could be a problem down the road. On the other hand, if more people poured into the labour market, that could in turn have a depressant effect on wages.
We are not sure what’s next. We are even hearing of layoffs in particular coming from Tesla’s Elon Musk how 10,000 workers are to be let go. Shadow Stats John Williams estimates that the economy is short some 6.9 million jobs from where it should be if the pandemic had not struck. This was assuming that trends in place prior to the pandemic had remained in place. We noted that the U.S. economy was still short over 800,000 jobs from the pre-pandemic level. And now the Fed and the BofC are hiking interest rates to tackle inflation. What impact it has on the economy is still to be determined but it is normally not positive. However, it is a laggard and the impact may not show up immediately but several months from now. It was concerning to see both the U6 unemployment rate and the Shadow Stats unemployment rate rise even as the officially reported U3 rate remained steady.
On the surface the pundits, politicians and some economists will tout these job numbers. But it’s built on a sand not rock.
Markets & Trends
| % Gains (Losses) Trends | ||||||||
| Close Dec 31/21 | Close Jun 3/22 | Week | YTD | Daily (Short Term) | Weekly (Intermediate) | Monthly (Long Term) | ||
| Stock Market Indices | ||||||||
| S&P 500 | 4,766.18 | 4,108.54 | (1.2)% | (13.8)% | down (weak) | down | up | |
| Dow Jones Industrials | 36,333.30 | 32,899.70 | (0.9)% | (9.5)% | neutral | down | up | |
| Dow Jones Transports | 16,478.26 | 14,444.84 | flat | (12.3)% | neutral | down | up | |
| NASDAQ | 15,644.97 | 12,012.73 | (1.0)% | (23.2)% | down (weak) | down | neutral | |
| S&P/TSX Composite | 21,222.84 | 20,790.73 | 0.2% | (2.0)% | neutral | down | up | |
| S&P/TSX Venture (CDNX) | 939.18 | 720.11 | (0.6)% | (23.3)% | down | down | neutral | |
| S&P 600 | 1,401.71 | 1,243.51 | (0.4) | (11.3)% | neutral | down | up (weak) | |
| MSCI World Index | 2,354.17 | 2,081.37 | 1.4% | (11.6)% | neutral) | down | neutral | |
| NYSE Bitcoin Index | 47,907.71 | 29,449.40 | 1.7% | (38.5)% | down | down | up (weak) | |
| Gold Mining Stock Indices | ||||||||
| Gold Bugs Index (HUI) | 258.87 | 262.25 | 0.7% | 1.3% | down (weak) | neutral | neutral | |
| TSX Gold Index (TGD) | 292.16 | 298.92 | (1.3)% | 2.3% | down | neutral | up (weak) | |
| Fixed Income Yields/Spreads | ||||||||
| U.S. 10-Year Treasury Bond yield | 1.52% | 2.94% | 7.3% | 93.4% | ||||
| Cdn. 10-Year Bond CGB yield | 1.43% | 3.07% | 10.0% | 114.7% | ||||
| Recession Watch Spreads | ||||||||
| U.S. 2-year 10-year Treasury spread | 0.79% | 0.28% | 12.0% | (64.6)% | ||||
| Cdn 2-year 10-year CGB spread | 0.48% | 0.16% | (33.3)% | (66.7)% | ||||
| Currencies | ||||||||
| US$ Index | 95.59 | 102.16 | 0.5% | 6.9% | neutral | up | up | |
| Canadian $ | .7905 | 0.7945 | 1.1% | 0.5% | up | neutral | neutral | |
| Euro | 113.74 | 107.20 | (0.1)% | (5.6)% | down (weak) | down | down | |
| Swiss Franc | 109.77 | 103.87 | (0.6)% | (5.4)% | neutral | down | down | |
| British Pound | 135.45 | 124.93 | (1.1)% | (7.8)% | down (weak) | down | down | |
| Japanese Yen | 86.85 | 76.44 | (2.9)% | (12.0)% | neutral | down | down | |
| Precious Metals | ||||||||
| Gold | 1,828.60 | 1,850.20 | (0.4)% | 1.2% | down (weak) | neutral | up | |
| Silver | 23.35 | 21.91 | (0.9)% | (6.2)% | down | down | neutral | |
| Platinum | 966.20 | 1,016.40 | 7.8% | 5.2% | up | down | neutral | |
| Base Metals | ||||||||
| Palladium | 1,912.10 | 1,985.90 | (3.4)% | 3.9% | down | down | neutral | |
| Copper | 4.46 | 4.47 | 3.8% | 0.1% | up (weak) | down | up | |
| Energy | ||||||||
| WTI Oil | 75.21 | 118.87 | 3.3% | 58.1% | up | up | up | |
| Natural Gas | 3.73 | 8.52 | (2.4)% | 128.4% | up | up | up | |
New highs/lows refer to new 52-week highs/lows and, in some cases, all-time highs.
It was a bit of a crazy up and down week, but in the end, the bears won and the markets generally closed lower. The S&P 500 fell 1.2%, the Dow Jones Industrials (DJI) was off 0.9%, the Dow Jones Transportations (DJT) were flat, the NASDAQ lost 1.0%, while the S&P 600 small-cap was down 0.4%. In Canada, the TSX eked out a gain of 0.2%, while the TSX Venture Exchange (CDNX) was off 0.6%. In the EU, the London FTSE was down 0.7%, the Paris CAC 40 was down 0.5%, and the German DAX was flat. Asia fared much better with China’s Shanghai Index (SSEC) up 2.1%, thanks to lifting some of the extreme lockdowns, and the Tokyo Nikkei Dow (TKN) gained 3.7%. The MSCI World Index was up 1.4% while Bitcoin continued to slosh around near $30,000, up 1.7%. There is really not a lot to say about this week.
Markets would have gained, but then came the better-than-expected job numbers and down we went as rate hikes again took center stage. And we say that noting that these rate hikes are probably built into the market. The better-than-expected job numbers were in some respects a disappointment for the market that was hoping for weaker numbers so that the Fed might be persuaded to soften its stance towards higher interest rates. But the market can’t have it both ways. Give it time. Higher rates could well tip the economy into recession. As we have noted, the Fed is late to the game in hiking rates but then compared to how the Fed reacted in the 1970s, this time they are early. Losers on the week were technology, consumer discretionary, communications, and financials. Energy was a big winner. But that is kind of negative for the market as rising energy prices could also contribute to tipping the economy over.
Not much to say about indicators this past week. The put/call ratio jumped back to 0.77 this past week, which is below 0.80 but up from the previous week. The advance/decline was rising in tandem with the market and there were no significant divergences at the recent market lows. On the other hand, we did not sharp divergences between the VIX Volatility indicator and the S&P 500 at the recent market lows. The market is now tuning itself to going down, which means we will probably rally instead. There was little from the other indicators. Bull/bear indicators are off their extremes mostly in neutral territory now.
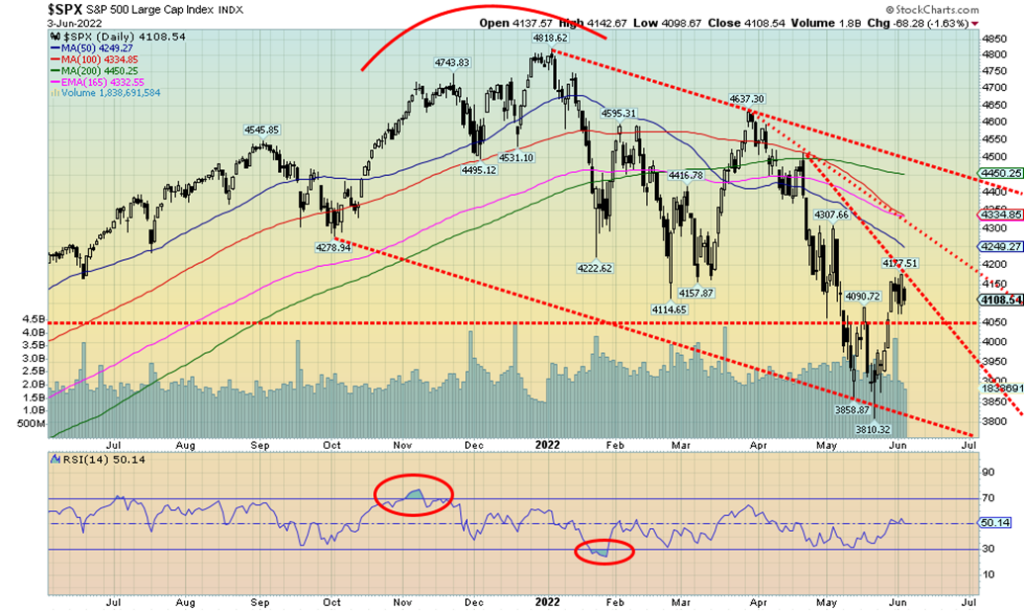
We believe we have a summer rally underway but we most likely will not see new highs. It could set us up nicely for a fall crash. That happened in 2008. There is resistance here now at 4,180, then up to 4,300. Above 4,350 we could move higher towards 4,500. Above 4,500 we will have broken the downtrend from the January 4 top. But it might take another month to reach those levels. First support is at 4,100 but below 4,050 we could fall further. The bottom looks like what we call a spike and that’s why we believe we are now embarking on the summer rally. Right now, we’d have to fall back below 3,900 to suggest to us that new lows are possible.
Markets are caught right now, worried about higher rates and the high inflation but thinking that higher rates and energy prices could eventually translate into an economic slowdown. Or worse, as Jamie Dimon says—a “hurricane.” He could well be right and that won’t be pretty for the stock market. Another bright spot is that corporations continue to buy back their shares. But we consider that short-term positive and longer-term negative. The consolidation could continue this coming week before we break higher.
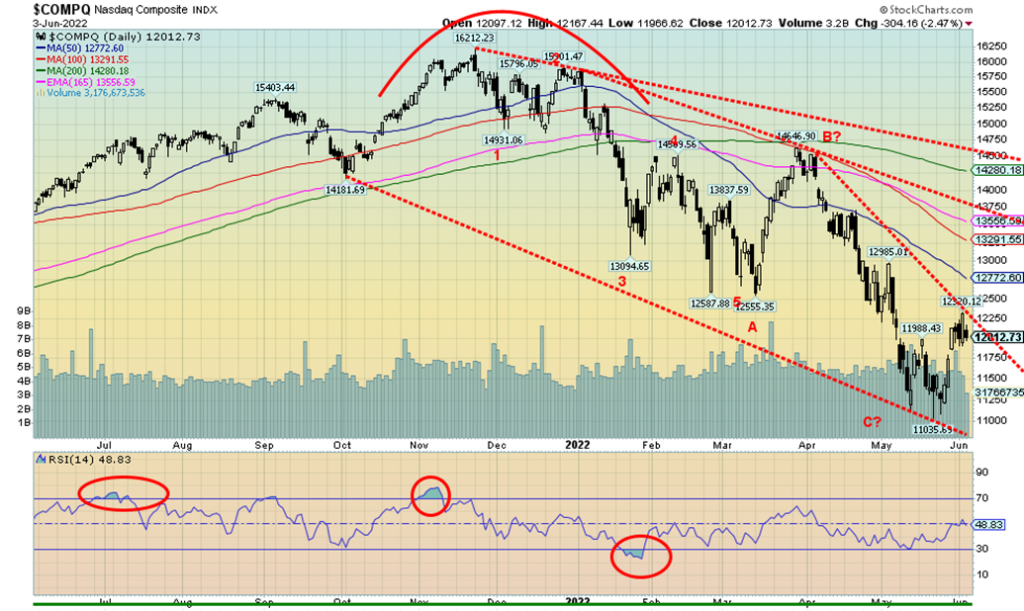
The NASDAQ, like everyone else, put in a wild week but closed largely unchanged, losing 1.0%. The FAANGs were, no surprise, mixed. Meta lost 2.2%, Apple was down 2.8%, Amazon jumped 6.2%, Netflix was up about 2.0%, Google +1.5%, Microsoft down 1.2%, Tesla, the big loser, off 7.4% (Musk should keep his trap shut but he can’t), Twitter down 0.1%, Baidu +3.1%, Alibaba -0.3%, and Nvidia -0.6%. The expectation now is that we saw a short-term high. Small gap to fill around 11,750. So maybe it’ll pull back to that level. Only below 11,350 could we think about new lows. We doubt we will pull back that far. Breakout comes above 12,500, but to get a real breakout we need to regain above 13,750 and then above 14,500. Those will no doubt be resistance zones. Earlier resistance can be seen at 12,800 and then up 13,500. We believe this is the start of a summer rally, but it’ll be choppy and we should not make new highs.
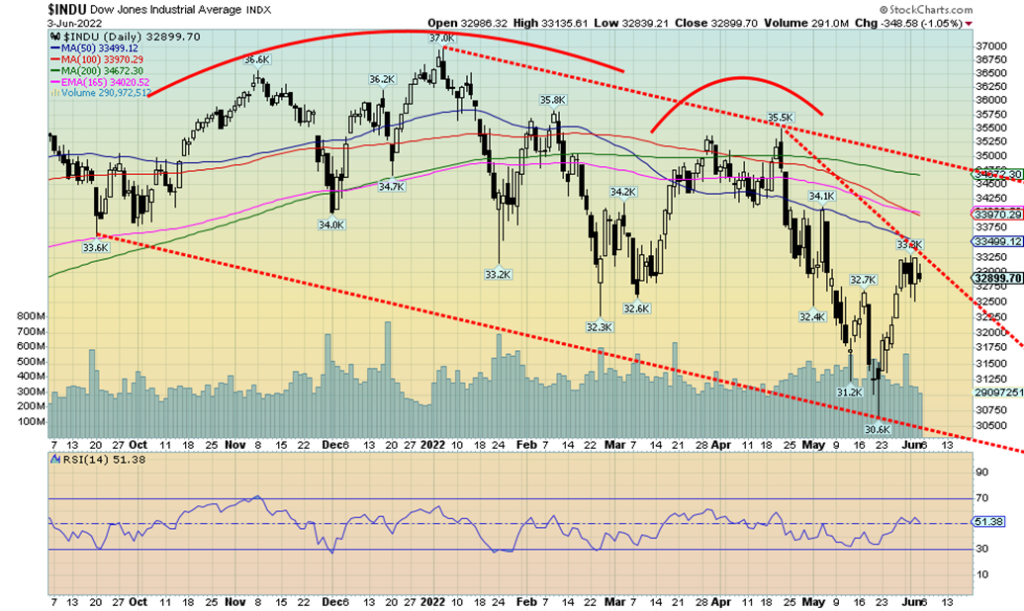
The Dow Jones Industrials (DJI) fell 0.9% this past week, leaving the index just under resistance near 33,400 and 33,500. As with the other indices, the DJI appears to be consolidating its recent gains. We break out over 33,500 but fail if we were to go back under 31,300. The recent low appears to be a spike and, even if we were to pull back further now, it would likely only be a correction to the recent up leg. The first breakdown could occur at 32,500 but, as noted, we’d probably need to see us fall under 31,300 to tell us we are headed for new lows. We doubt that will happen. So, overall, we view this consolidation just as correction to the recent up leg. Once it is complete, we will head higher. We’d need to get over 35,000 to end the downtrend. That’s just above the current 200-day MA at 34,670. The summer rally is, we believe, on.
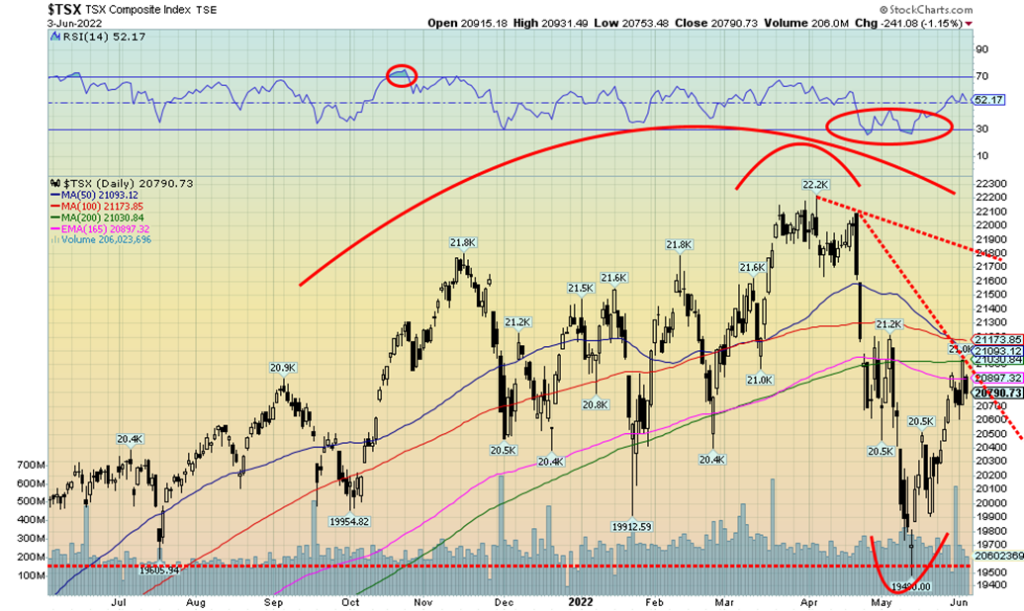
The TSX eked out a gain of 0.2% this past week. Despite the sharp ups and downs, the market largely wound up where it left off last week. We ran smack into the resistance of the 200-day MA this past week. We need to clear above 21,200 to convince us we are indeed going higher. Nine of the 14 sub-indices were down on the week, but for most the move was small. The only stand-out was Health Care (THC) that continues to take hit after hit after hit down to new lows off 6.1%. To the upside the Energy (TEN) jumped 1.5% to new 52-week highs. Metals & Mining (TGM) was up 1.1%. Otherwise, not a lot to say as everyone seemed to mark time. The TSX Venture Exchange (CDNX) was down 0.6%. Both the TSX and the CDNX appear to be trying to move higher but both have run into a resistance zone. As noted, the TSX needs to get over 21,200 to convince we could test up to 21,800 and major resistance. A break now below 20,600 would be short-term negative but we would need to collapse back below 19,800 to suggest new lows. The spike low in May appears to be just that—a spike low followed immediately by the start of a rally.
10-year Treasury Bond/Canadian 10-year Government Bond (CGB)
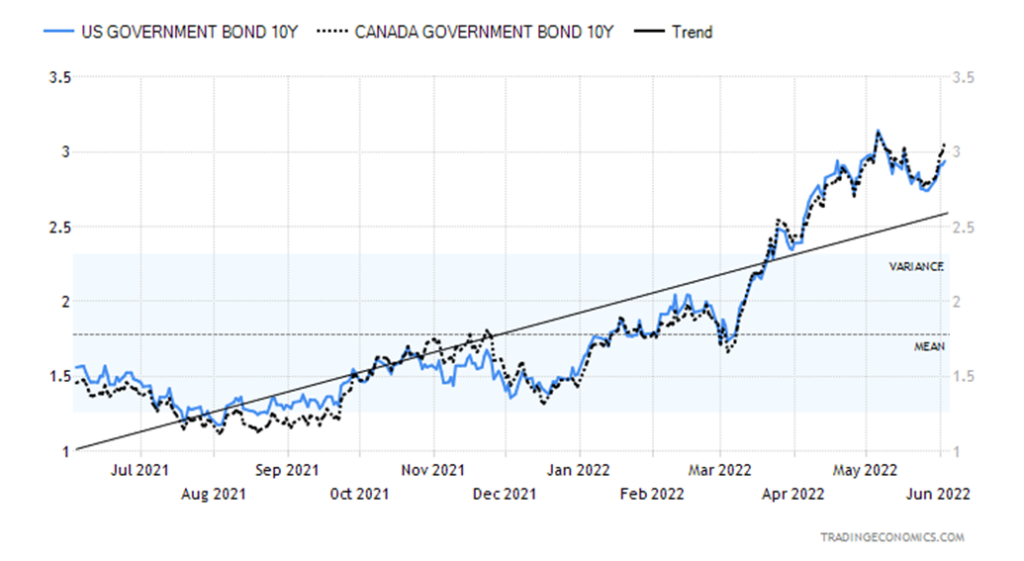
Bond yields moved higher again this past week, especially on the heels of the somewhat higher than expected nonfarm payrolls. The translation was the economy is still doing well and the Fed will have to hike interest rates higher to combat inflation. The U.S. 10-year treasury note jumped to 2.94% this past week from 2.74%. In Canada, the BofC hiked the bank rate 50 bp as was widely expected. It now sits at 1.5%, still well below the rate of inflation. The Canadian 10-year Government of Canada (CGB) was up to 3.07% from 2.79%. The high so far was seen on May 6 at 3.26%. Canada reported Q1 GDP growth this past week. It came in at up 0.8%, below the expected 1.4%. Year-over-year Canada’s GDP growth was up 3.1%, again a disappointment as they expected 5.6%. Yet the bond yields were pushed higher only because of the expected bank rate hikes. The BofC, like the Fed, is targeting to hike rates to 3–3.5%, but they have mused about needing even higher rates. With the Canadian housing market starting to waver, that could push more over the edge and we could see a rise in defaults in the mortgage market.
There is no slowdown yet in the U.S. housing market as the Case-Shiller y-o-y house price rose 21.2%. That was above the expected 20.5%. The Chicago PMI, one of the more closely watched PMIs, came in at 60.3 above the expected 57. That’s another sign the U.S. economy is performing somewhat better than expected. Even the Conference Board’s consumer confidence index was higher than expected at 106.4 vs. the expected 104 but below last month’s 108.6. The CB confidence index is not to be confused with the Michigan Sentiment Index. Jolts job openings are high at 11.4 million and quits were high again for April at 4.4 million. The job opening numbers are off their recent record high but still higher than ever seen before. The quits are also high, just off from the record high of over 4.5 million. If there was a downside surprise this past week it was the ADP employment report that came in at 128,000 below the expected 205,000 and March’s 202,000. That report did not appear to be reflected in the nonfarm payrolls. Numbers to watch for this week are the Balance of Trade on Tuesday and the CPI next Friday. It is expected to be unchanged at 8.3%. Canada releases its jobs report also on Friday. The expectation is of a small gain of 11,000 and the unemployment rate to remain steady at 5.2%.
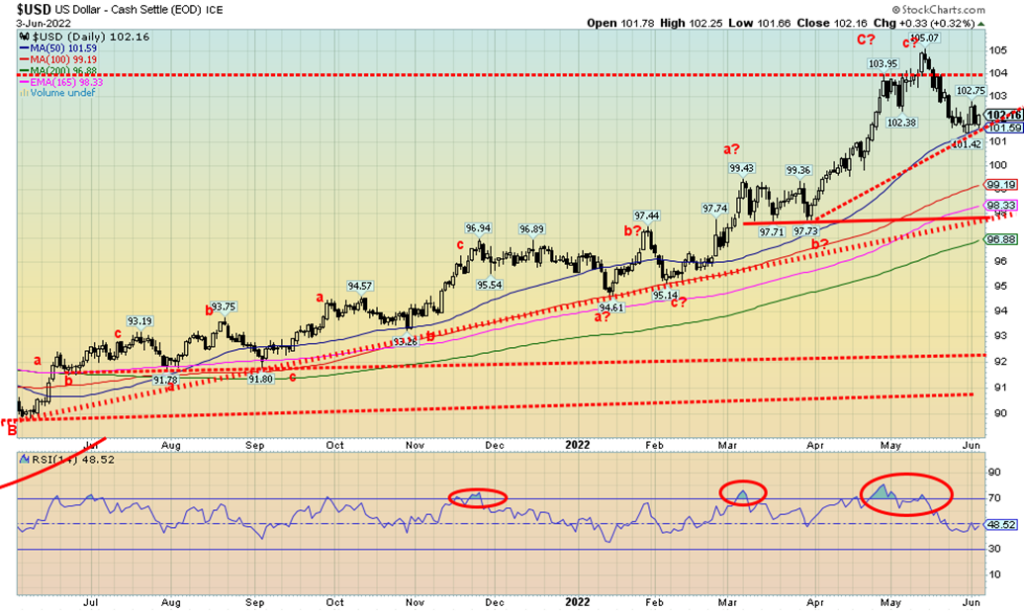
The US$ Index, like everything else this week, had a couple of sharp up and down days. On the week, it wound up gaining about 0.5%. The euro was off a tiny 0.1%, the Swiss franc down 0.6%, the pound sterling off 1.1%, and the Japanese yen getting the worst, down 2.9%. The Canadian dollar, thanks to higher oil prices, jumped 1.1%. The US$ Index found support at the rising 50-day MA so a break now under the recent low at 101.42 could send the index tumbling towards better support at 99/100. Only back above 104 would we consider the US$ Index headed for new highs above 105. The US$ Index is pretty neutral here so we have to watch which way it breaks. The US$ Index could consolidate further here and rise as high as 103.50 and it would still be in a downtrend. But above 104 it could break out and challenge the highs. Right now, we are going on the assumption we have made at least a temporary high. We’d have to break down below 99 to start having us think that a bigger bear move was coming for the US$ Index.
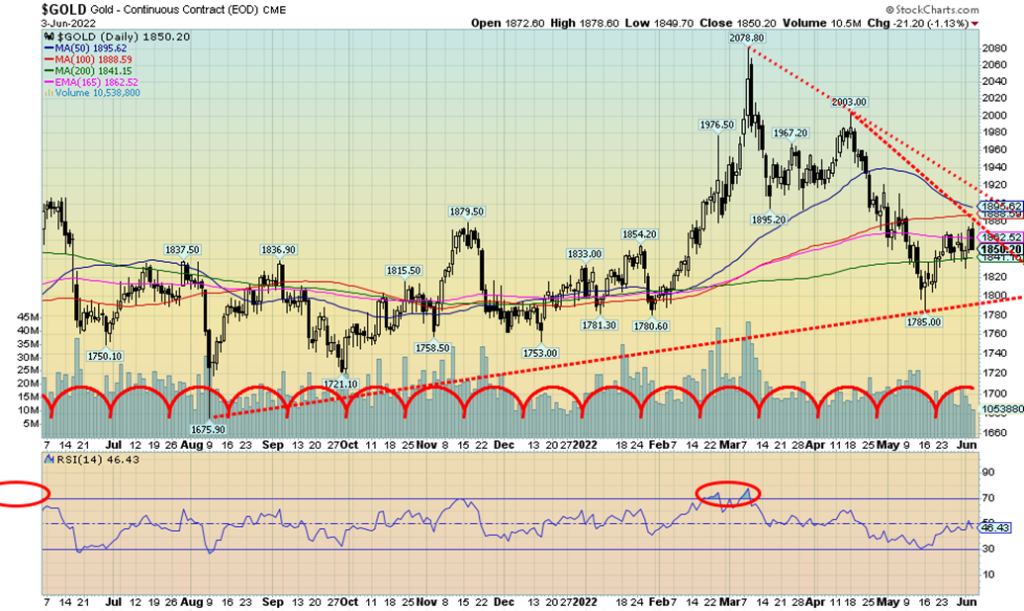
Gold spent a confusing week with a few sharp ups and downs. The sharp ups were spurred on by weaker economic data and the sharp downs by stronger economic data. Gold is just confused. The US$ Index managed to make a small gain this past week so that pressured gold a bit as well. On the week, gold was down a small 0.4%, silver lost 0.9%, but platinum surprised with a solid 7.8% gain. Palladium lost 3.4% while copper prices jumped 3.8%. Gold sometimes follows copper so that is a positive. Gold was pushed back by Friday because of the somewhat stronger-than-expected employment numbers. As well, the 10-year yields backed and fears of interest rate hikes crept in once again. The interest rate hikes of at least 50 bp in June and July are already built in to the market. It was noted that if the inflation numbers continue high into the summer, then another 50 bp in September is probably in the works. The Fed wants to get up around 3.5% from the current 1.0%. So quite a way to go. And even then, that would leave the negative spread at 4.7% if inflation didn’t come down. Still very high. We are reminded that Volcker raised the Fed rate above the rate of inflation to bring it down. The steepest recession since the Great Depression followed.
The Fed also starts QT this month so we are not sure how that might impact gold. We ran into resistance around $1,860 which was an expected resistance point. But we quickly found support at $1,840 and there is further support down to $1,830. Below $1,820 would be more problematic as we’d have to re-focus on the recent low of $1,785. While the CFTC issued the COT reports this week, our usual source doesn’t appear to have updated their numbers. May have been because of the holiday and we’ll see it Monday. The trouble with the CFTC reports is that they are a bit of jungle to navigate so we had to get out our calculator and calculate the new COTs. The gold commercial COT (bullion companies and banks) came in at 29% vs. 28% the previous week. The good news was long open interest jumped almost 5,000 contracts while short open interest fell about 7,000 contracts. We have to view this as somewhat positive. The large speculators COT (hedge funds, managed futures, etc.) was at 74% unchanged on the week. However, long open interest fell over 12,000 contracts while short open interest was also down, off about 1,500 contracts.
Gold still has a lot of work to do. $1,860 is a bit of resistance, but above $1,880 we should make a try at $1,900/$1,920. Only above $1,920 do we consider the recent low at $1,785 confirmed. We are super cautious about this rally which could once again carry gold to $2,000. The reason is, we believe we have now moved into the downside of the current 31.3-month cycle (last seen March 2021), the downside of the 7.8-year cycle (last seen December 2015), and the 23.5/25-year cycle (last seen April 2001). The final low may not come until later this year (December?) or even into 2023 (June?). We did not like the recent failure at $2,078 in March that failed the $2,089 high of August 2020. That strongly hints to us that the current cycles may have topped. But that might not stop a rally that could carry into the summer or fall. However, those highs now are extremely important and failure to take them out would signal we could be in front of a much bigger drop. What’s key going forward could be the US$ Index which may have made at least a temporary top.
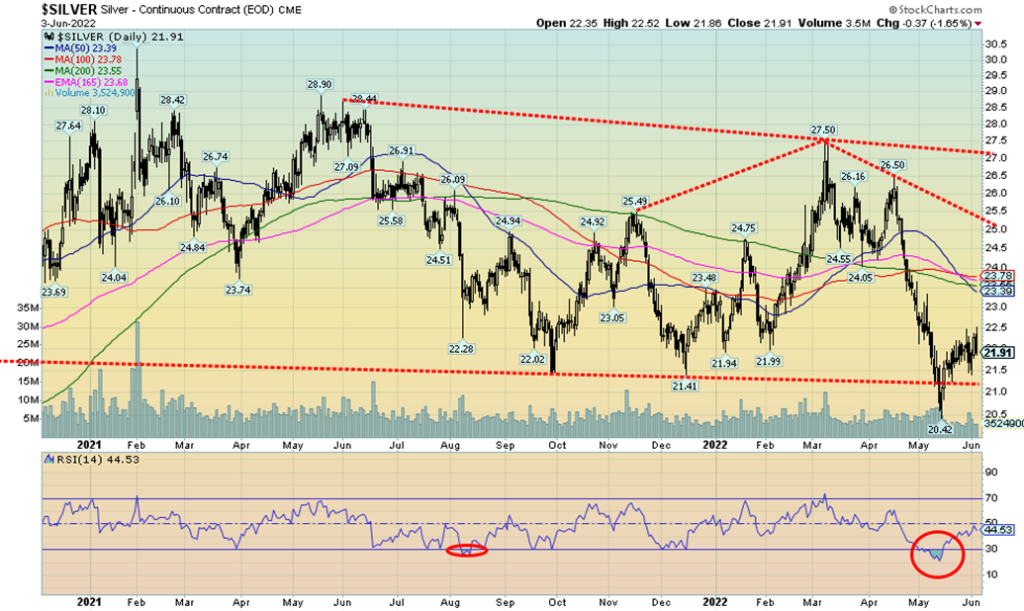
Silver prices consolidated this past week, losing a small 0.9%. Like gold, our usual source for the COT reports hasn’t filed. So again, we got out our calculator to find the percentages. The silver commercial COT slipped slightly to 41% from 42% while the large speculators COT was steady at 57%. Not much movement. There was little movement in long or short positions. Overall, the COTs remain positive for silver. Not much to report here otherwise. Silver, like gold, spiked lower initially but recovered by the week’s end. The collapse to new lows at $20.42 appears to have been an exhaustion spike. So, our expectation here is that any pullback should hold at least above $21.50. The entire pattern since that spike high in February 2021 at $30.35 could be construed as some sort of descending triangle pattern. Lower highs, relatively flat lows except for that recent spike lower. That spike to $20.42 was new lows for silver and, tellingly, gold did not make new lows with silver. But what’s key to going higher is that silver must rebound and take out resistance now near $27. Failure to do so could set up another lower high and then another break of $21 could then target silver down towards $11. Perish the thought. But on this rally rebound we need to take out resistance at $23.50/$24 first then above $25 and finally above $27 to convince us we are indeed going higher.
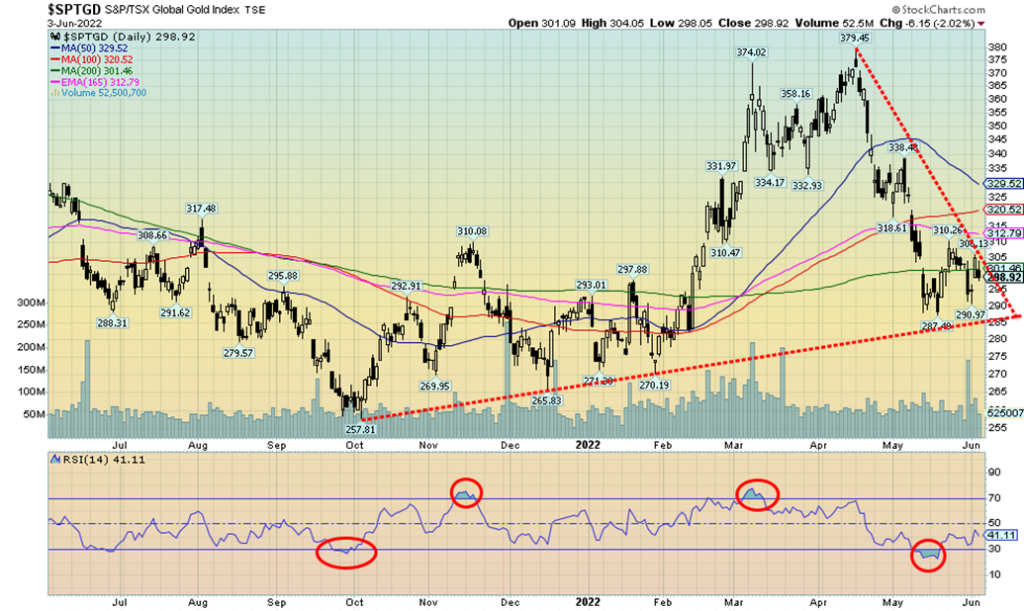
Despite a bit of a volatile week the gold stocks managed small gains, but the results were decidedly mixed. The TSX Gold Index (TGD) actually fell 1.3% but the Gold Bugs Index (HUI) was up 0.7%. It was no surprise to see individual stocks with some up and some down on the week. The big news on the week was the Gold Fields (GFI) takeover of Yámana Gold (AUY, YRI) in a $6.7 billion deal. Yámana finished the week up 8.8%, but Gold Fields was punished, down 20.5%. That didn’t help the indices. Nonetheless, that instantly spurred thoughts of more merger/takeovers to come. They’ll happen. The challenge is always trying to identify who. The mid-sized and junior producers are always potential targets. Gold companies have had a decent year with costs steady but energy rising and the price good, delivering decent profits and spinning off cash flow. Identify the ones spinning off good cash flow that could be potential takeovers.
Technically we made a knee jerk reaction, down this past week taking the TGD back to 290 but we rebounded and closed at or around that 200-day MA which TGD is trying to hold. Obviously, it’s important to hold this line. TGD would break out again over 308, but a serious break out would not come until over 330. The swift decline this week to 290 was close to the last low of 287 that in turn held an uptrend line from the October 2021 low. Does it qualify as a higher low? Looks okay so far. The 287 low in turn was a higher low as well. Despite the recent swift collapse from the April high of 379 overall, a slow-moving uptrend appears to be in place. The current depressed price is, we believe, an opportunity. As well, gold stocks continue to trade at exceptionally cheap levels compared to the price of gold/silver. The Gold/HUI ratio is at 7.06, still in very high territory that suggests gold is expensive and the gold stocks cheap.
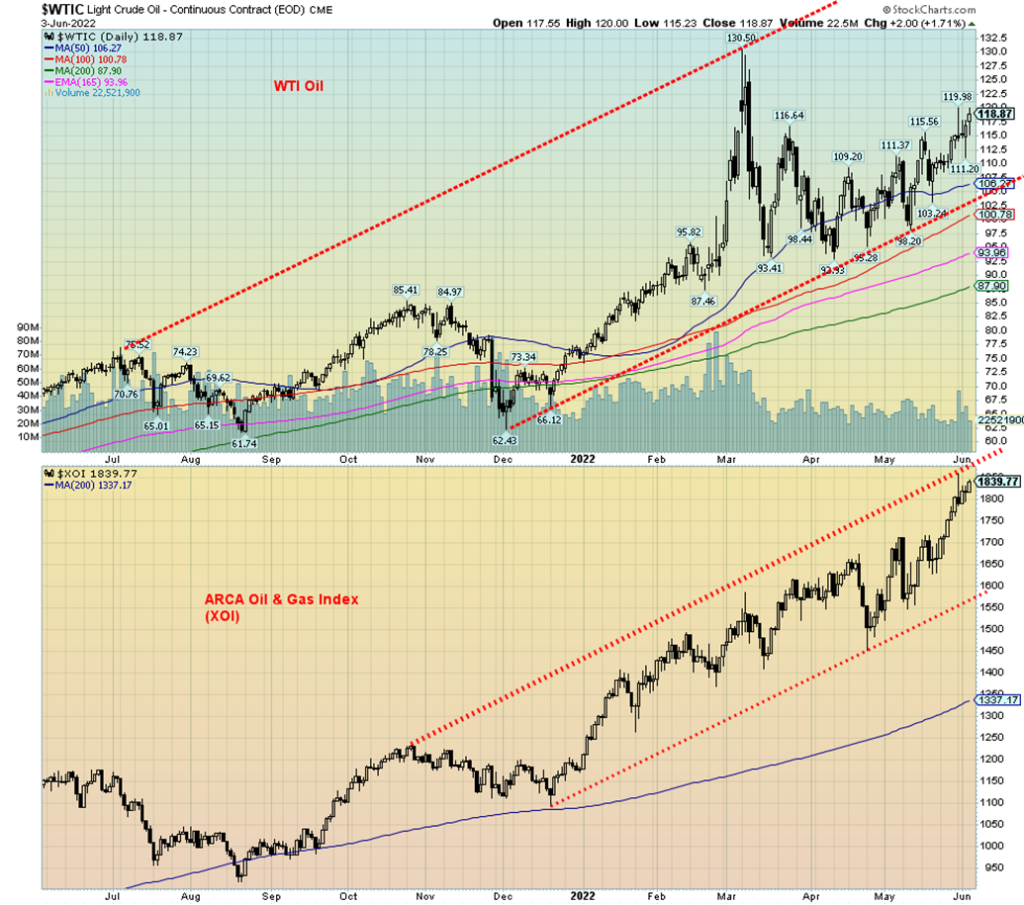
OPEC couldn’t do it. EU banning Russian oil escalated it. And U.S. inventories keep on falling. The result: WTI oil jumped $3.80 or 3.3% this past week to its highest level since March 9. Brent crude jumped 4.4%. Natural gas (NG) consolidated and was off a small 2.4%.
It was a tumultuous week in the oil market. OPEC agreed to raise their output by 680 thousand barrels through July/August. The market seemed to yawn. The market paid more attention to another decline in U.S. inventories, even though it was only about 5 million barrels. But they also reacted to the EU banning of Russian oil, even if most of the impact won’t hit for months. The EU also banned providing insurance to Russian oil cargoes. Irrespective of this, Russia is finding increased sales in India and China and some elsewhere in Asia to offset any loss of EU business. The bigger problem is for the EU to find replacements. That’s not a given.
High oil prices, along with high commodity prices are a boon for Russia as their coffers are overflowing. But with imports down sharply and their inability to obtain badly needed tech chips and other imports their economy is still suffering. Despite coffers overflowing the U.S. continues to block Russia from paying their debt when they could do so easily. An artificial default.
Technically, WTI oil broke over resistance at $115/$116. It still needs to clear over $122 to tell us that new highs above $130.50 are possible. On the other side, a break below $111 could send prices falling further to $106 or even $101. Below $100 the current uptrend would be over.
NG, after hitting a high on May 26 at $9.45, has backed off and is trying to consolidate. As long as it remains above $7.30 and especially above $6.50 the uptrend is intact. There were negative divergences seen at the recent high where NG made new highs but the indicators failed to make new highs. It’s a sign that momentum is stalling and we could be subject to a pullback.
Oil stocks continued their recent uptrends as the ARCA Oil & Gas Index (XOI) jumped 1.9% this past week while the TSX Energy Index (TEN) was up 1.5%. Both indices made fresh 52-week highs. They could be subject to a pullback as they are quite overbought and there are negative divergences creeping in. As well, they are up against a rising bull channel. But they could continue to slowly work their way higher.
The energy bull market continues. We see little in the way right now to stop it, but it could be subject to some swings, depending on news.
Copyright David Chapman, 2022
__
(Featured image by Adeolu Eletu via Unsplash)
DISCLAIMER: This article was written by a third party contributor and does not reflect the opinion of Born2Invest, its management, staff or its associates. Please review our disclaimer for more information.
This article may include forward-looking statements. These forward-looking statements generally are identified by the words “believe,” “project,” “estimate,” “become,” “plan,” “will,” and similar expressions. These forward-looking statements involve known and unknown risks as well as uncertainties, including those discussed in the following cautionary statements and elsewhere in this article and on this site. Although the Company may believe that its expectations are based on reasonable assumptions, the actual results that the Company may achieve may differ materially from any forward-looking statements, which reflect the opinions of the management of the Company only as of the date hereof. Additionally, please make sure to read these important disclosures.
David Chapman is not a registered advisory service and is not an exempt market dealer (EMD) nor a licensed financial advisor. He does not and cannot give individualised market advice. David Chapman has worked in the financial industry for over 40 years including large financial corporations, banks, and investment dealers. The information in this newsletter is intended only for informational and educational purposes. It should not be construed as an offer, a solicitation of an offer or sale of any security. Every effort is made to provide accurate and complete information. However, we cannot guarantee that there will be no errors. We make no claims, promises or guarantees about the accuracy, completeness, or adequacy of the contents of this commentary and expressly disclaim liability for errors and omissions in the contents of this commentary. David Chapman will always use his best efforts to ensure the accuracy and timeliness of all information. The reader assumes all risk when trading in securities and David Chapman advises consulting a licensed professional financial advisor or portfolio manager such as Enriched Investing Incorporated before proceeding with any trade or idea presented in this newsletter. David Chapman may own shares in companies mentioned in this newsletter. Before making an investment, prospective investors should review each security’s offering documents which summarize the objectives, fees, expenses and associated risks. David Chapman shares his ideas and opinions for informational and educational purposes only and expects the reader to perform due diligence before considering a position in any security. That includes consulting with your own licensed professional financial advisor such as Enriched Investing Incorporated. Performance is not guaranteed, values change frequently, and past performance may not be repeated.


Tilray Acquires HelloMD to Expand Medical Cannabis Digital Platform
Tilray Brands acquired HelloMD, a digital healthcare and medical cannabis platform, pending court approval on June 29, 2026. The deal...


Spanish Crowdfunding Market Reaches Record €761.6M in 2025, Driven by Real Estate and Crowdlending Growth
Spanish crowdfunding market reaches record €761.6M in 2025, driven by strong real estate dominance and rapid crowdlending growth, while donations...


Swedish fintech Lysa is preparing to enter the European ETF market
Swedish fintech Lysa is entering the European ETF market, registering its first ETF and expanding beyond its robo-advisor model. Managing...


Bitcoin Stalls Near $60K as Strategy Moves, ETFs Outflow, and EU MiCA Rules Take Effect
Bitcoin hovers near $60,000 with ETF outflows, while Strategy boosts reserves, sells BTC, and raises dividends to reassure investors. Ethereum...


Morocco’s Growth Holds at 4.6% as Agriculture Offsets Economic Pressures
Morocco’s economy grew 4.6% in Q1 2026, driven by a strong agricultural rebound offsetting declines in industry. Services expanded moderately...
 |
|
 |  |
 |
|
-

 Cannabis1 week ago
Spain Cannabis Laws: Private Use, Fines, and Grey Areas
-
 Cannabis1 week ago
Tilray (TLRY) Falls as Bearish Momentum Persists Despite Marketing Push
-

 Business1 week ago
Markets Diverge as Oil Falls, Rates Hold, and Inflation Persists
-

 Biotech2 days ago
Abivax Shares Surge as New Trial Data Eases Safety Concerns Over Ulcerative Colitis Drug