Featured
Why Many Expect the BofC to Hike Rates
Is the party over? We muse as the stock markets are off to one of their worst January starts ever. Fear of interest rate hikes, political polarization, war drums beating, the COVID still raging – the beat goes on. We look at a number of things that could be pointing us to a recession. At the top of the list inflation, oil and consumer sentiment.
Are we headed for a recession? There are a number of signs we see suggesting that a recession is on the horizon. No, that is not guaranteed. We can only note what we observe. The question, of course, is timing. The earliest we see a recession getting underway is possibly later this year but more likely 2023.
Two of our prime reasons, we believe, we are headed for a recession are inflation and oil. In our last issue of The Scoop, we noted how every time inflation rose more than 5% on a year-over-year (y-o-y) basis over the past 70 years a recession followed. We are repeating that chart below.
Inflation Year-Over-Year Change: 1948–2022
Some of the recessions coincided with the rise in inflation: 1969–1970, 1973–1975, 1980, 1990–1991, and 2007–2009 as the others saw a delay before the recession hit. As the chart above shows, there were a few misses, but it wasn’t because inflation rose over 5% and no recession followed; it was because inflation did not peak over 5% yet recessions occurred. That was the case with the 1957–1958 recession as well as the 1960–1961 recession. The other big miss was the 2020 pandemic recession. Other factors were at play, primarily monetary tightening as the Fed hiked interest rates. In the case of the 2020 recession, it was because of the lockdowns that threw millions out of work. The worst recession was the 2020 pandemic recession when U.S. GDP contracted 19.2% at its steepest. That was a depression-like number. But because it was so short-lived it never qualified as a depression. Some, however, are calling it a mini-depression.
Inflation fears are rising. Canada just reported the highest inflation number since 1990 at 4.8% y-o-y. EU inflation has hit its highest level since the euro became the currency of the EU in 1999. It was 5.2% y-o-y in November. In the U.K., inflation is at 5.4%, the highest since 1992. In China, inflation seems like an afterthought reported at 1.5% in December. Inflation is being driven by increased demand following the pandemic recession of 2020 plus supply shortages and disruptions caused by the pandemic. Many continue to believe that once the supply issues are resolved inflation will come down. But that time might not be any time soon as the pandemic continues to play havoc.
Inflation is also a function of energy prices. While oil is at the center, we note that prices for fertilizers, agriculture commodities, and metals & minerals have also been rising. All of them are tied intrinsically to energy. But you combine rising prices for commodities with the supply disruptions and bottlenecks and inflation is sure to follow. Workers still fear they will get sick. Many have quit and many have retired rather than continuing to work. Vaccine mandates are playing havoc as many workers refuse to get vaccinated leaving shortages of workers for many occupations. All that feeds into the problem. And with rising inflation comes rising demand from workers for better wages. We haven’t seen this kind of inflation since the 1970s and into the 1980s. That inflation has followed is not a surprise.
But inflation is primarily a monetary phenomenon. One only has to look at the massive expansion of bank credit and currency that has occurred since March 2020. That has fed into the bubbles in the stock market, housing, and more. It has been noted that M2, as an example, is three times higher than it was at the time of the collapse of Lehman Brothers in October 2008. To summarize, M1 is up 1,280%, M2 up 169%, the Fed balance sheet up 388%, and All debt (government, corporate, household) up 57% since October 2008.
M1, M2, Fed Balance Sheet, All Debt 2008–2022 (billions of dollars)
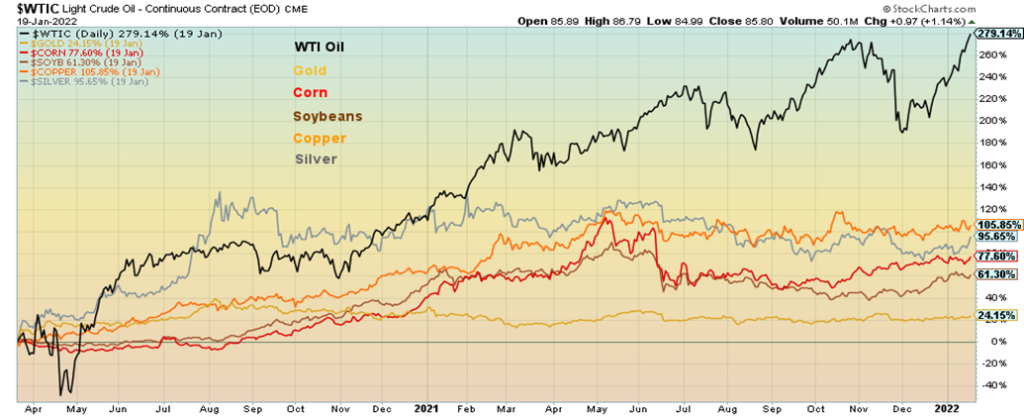
Selected Commodities Performance: March 2020–January 2022
A sharp rise in oil prices has preceded a number of recessions since 1970. The biggest and most obvious was the Arab oil embargo of 1973 that helped trigger the steep 1973–1975 recession. The Iranian hostage crisis of 1979 helped trigger a spike in oil to $40 and contributed significantly to the 1980 recession and then again to the 1981–1982 recession. Oil prices remained high for a time following the Iranian hostage crisis, primarily because of the Iran/Iraq war. The Gulf War of 1990 was a major contributor to the 1990–1991 recession. Surging economic growth helped push prices higher in to 1999 before the 2000–2002 recession. That was
mostly coincidental and not a major contributor. Oil prices started to rise following Gulf War II in 2003, which was the trigger for a sharp rise in oil prices that peaked at a then-record price of $147 in 2008. Again, while it wasn’t the main cause of the 2008 financial collapse it was a significant contributor. We are now in our sixth significant rise in oil prices seen since 1970. Will it help spark or be a major contributor to yet another recession?
Oil prices are currently rising, primarily because of geopolitical tensions plus supply shortages due to low production in countries like Libya and Iran that are under sanctions. The ongoing dispute between the U.S./Russia/Ukraine is significant because Russia is the world’s third largest oil producer, behind the U.S. and Saudi Arabia. The recent attack on the UAE, OPEC’s third largest producer, also shook markets as it potentially signaled an escalation in the war that involves the UAE, Saudi Arabia, Yemen, and the breakaway Houthi regime in Yemen. The Houthis are backed by Iran, also a significant oil producer. The Saudis have been slow to up their production after cutting back in 2020 to help raise the price of the oil. As well, there have been supply disruptions due a shortage of truckers, and also significant outages in production because of hurricanes and other natural disasters.
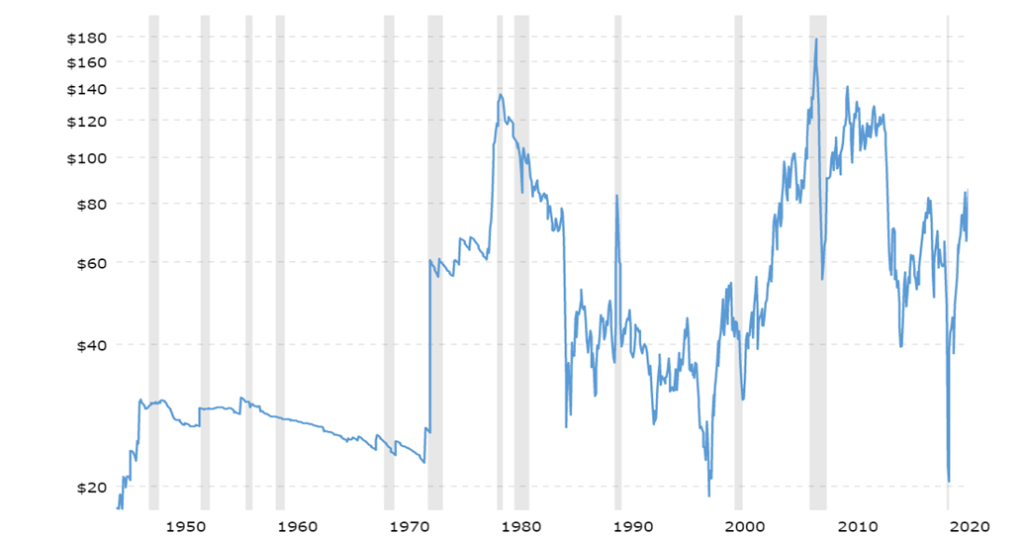
Are oil prices at a level to spark a recession? Certainly not yet. On an inflation-adjusted basis, oil prices remain well below the levels seen in 1979–1980, 2008, and 2011–2014. WTI oil would have to rise to $200 to set new all-time highs on an inflation-adjusted basis. But prices are rising and there are forecasts now of $100 + oil and even higher.
Oil Prices 1946–2022 (Inflation-Adjusted)
However, inflation and oil are not the only warning signs. Consumer confidence has taken a hit. As the chart below shows, every time the Michigan Consumer Sentiment Index fell under 80 it proved to be a prelude to a recession. Some are coincidental as we saw during the pandemic recession of 2020. But others preceded the recession, sometimes by more than a few months. Again, it is a warning sign that could result in a recession.
University of Michigan Consumer Sentiment Index 1978–2022
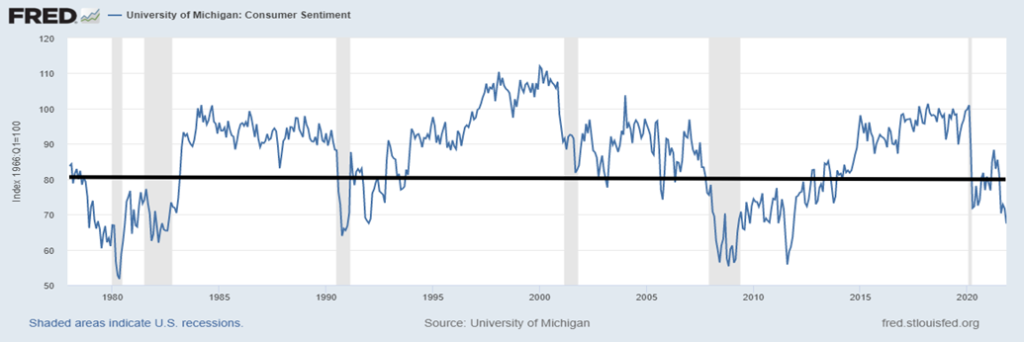
The question begs that if things are so good, why is consumer sentiment falling? And not only falling, but falling low enough to suggest that a recession may be coming. The consumer is clearly worried. Inflation, geopolitical tensions, the political divide in the U.S., unemployment, the pandemic, and more are all concerning.
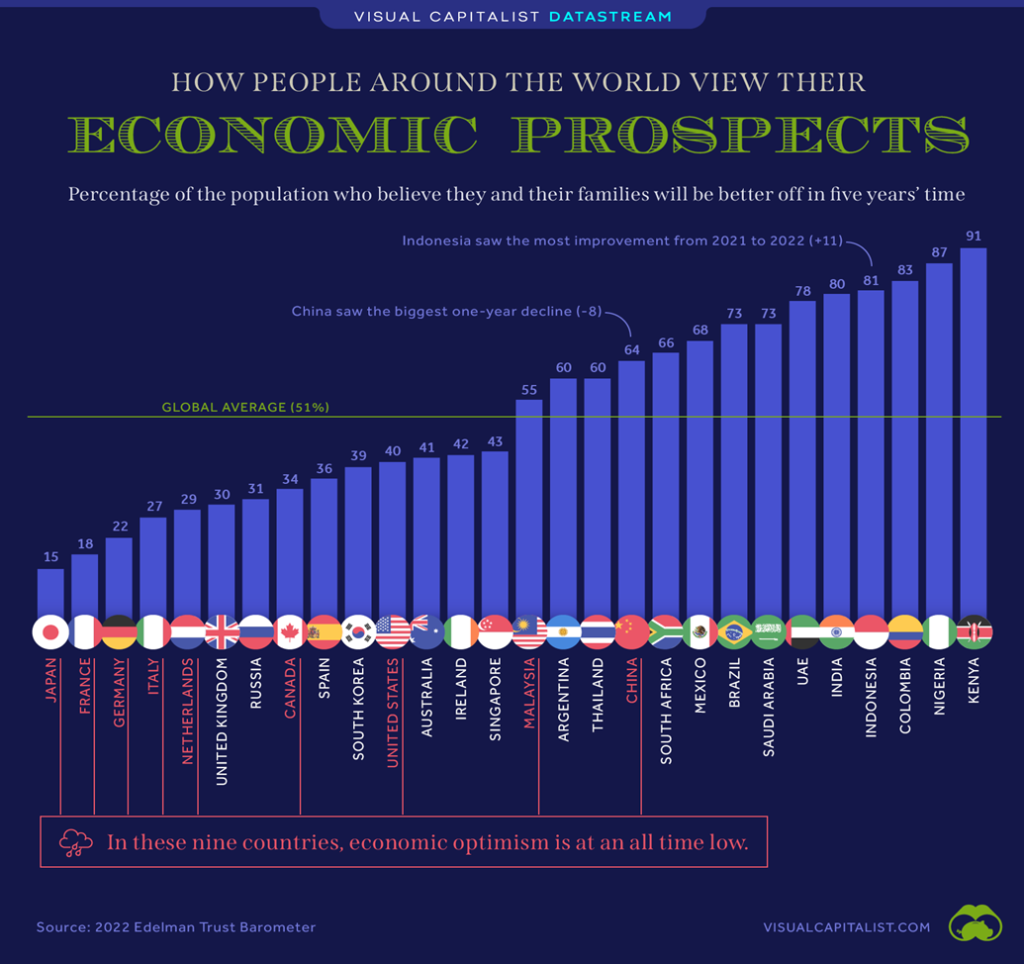
There is some evidence that consumer sentiment is falling throughout the Western economies. This interesting chart from Visual Capitalist (www.visualcapitalist.com) shows how people view their economic prospects going forward. Note that the most pessimistic responses are coming from the G7: the U.S., U.K., France, Germany, Japan, Italy, and Canada. On average their score is only 27%. Compare that with a group made up of three African countries and four Latin American countries—Argentina, Colombia, Brazil, Mexico, South Africa, Nigeria, and Kenya—whose average score is 75%. Are developing countries more optimistic about their economic prospects going forward than the highly developed economies?
There are other signs of a coming recession, but at this time none of them are drawn out sufficiently enough to state with any confidence that a recession is possible. However, they are worth noting.
Interest rates are set to rise. The Fed has already signaled that three interest rate hikes in 2022 are probable as is a fourth. The purpose is to tame inflation. Typically, the Fed is behind the curve. They are too late to lower rates and too late to hike rates. But hiking interest rates is not going to solve supply disruptions, geopolitical
tensions, or the political divide. And there is a danger that they could spark a stock market crash or a housing crash. The yield curve has been narrowing. What that means is that long-term interest rates are rising but short-term interest rates are rising faster. Already our closely watched 2-year—10-year spread has narrowed from 1.59% in March 2021 to 0.79% today. Typically, when the yield curve goes negative, this warns that a recession could soon follow. As we have seen in previous periods of narrowing spreads, the pace at which the yield curve narrows can be rapid. Still, we are a way from turning negative.
This coming week, the FOMC meets on January 25–26. While there is no expectation that the Fed will hike rates at this meeting, pundits will be keying in on clues that the Fed will hike at the March FOMC. But could the FOMC surprise and hike rates? Some are speculating that could well be the case given the Fed wants to move sooner than later. The Bank of Canada is also meeting this coming week and there is some speculation that they will hike rates by 25 bp.
There are economic signs as well of a potentially slowing economy. One to keep an eye on are the Manufacturing indices. This past week alone, the NY Empire State Index (manufacturing in the state of New York) came in at -0.7. The market had expected a reading of 25. That was a significant miss. On the other hand, the Philly Fed (manufacturing in the Philadelphia region) came in at 23.2 above the expected 20. One needs to keep an eye on the ISM Manufacturing Index that come out this coming week. Readings under 50 would suggest a slowdown. Under 45 usually points to a recession.
Could unemployment rise? For the past two weeks, initial claims have exceeded expectations. That points to potential problems for the January employment numbers due out on February 4. Employment has been soft. The U.S. remains short of February 2020 employment levels by over 3 million workers. Quits have been high even as job openings are high but skills don’t match. Labour shortages exist due to fears of COVID or inability to re-enter the workforce because of care of the elderly or children as schools have been spotty in reopening. Many workers have taken permanent retirement rather than return to the labour force. The labour force participation rate is at its lowest level since the 1970s before a large influx of women in the workforce. This in turn lowers the unemployment rate, giving a potentially false picture of the real employment situation. While the headline unemployment rate has fallen, the Shadow Stats unemployment rate that they report every month has fallen less, suggesting there is considerable long-term unemployment in the economy.
Keep an eye on retail sales, particularly car sales. Retail sales fell unexpectedly in December when a rise had been expected. For ex autos the story was the same. While retail sales have been robust, one has to keep in mind that was coming out of the steepest drop in years during the pandemic recession of 2020. Car sales have
probably peaked again back in March 2021. Typically, once they peak sales drop and that is a sign that a recession could be on the horizon.
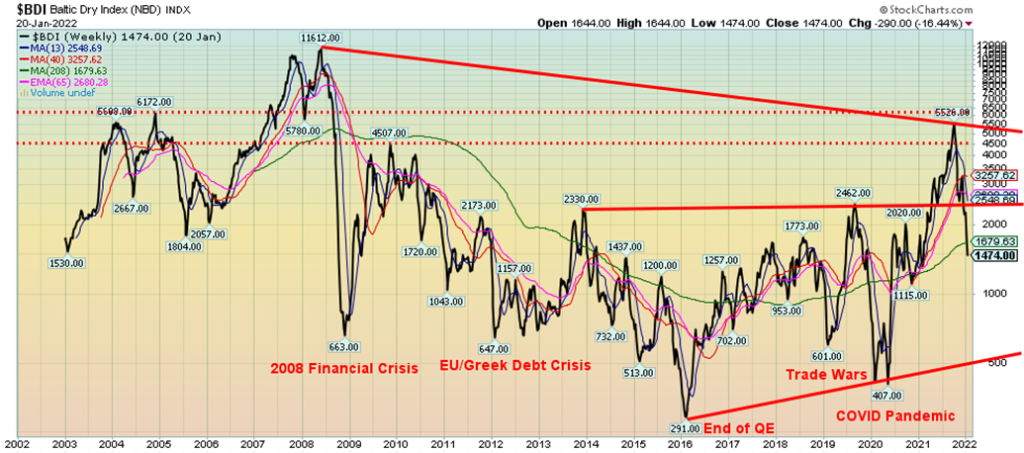
Another concern is the sudden falling Baltic Dry Index (BDI). The BDI is a benchmark for the price of cargo ships to haul iron ore and other “dry” raw materials by sea. The BDI has fallen 73% since peaking in October 2021. The BDI has fallen back under its 4-year MA. This is concerning as BDI lows are often associated with recessions, or at least slowdowns as noted below. We are not showing this, but we have noted that a sharp decline in the BDI has been associated with the stock markets falling with roughly a month’s lag. In other words, the BDI is linked to the performance of the stock market and acts as an early warning sign. Again, this is
not to say the BDI is warning of a recession as the only recessions recorded here were the 2007–2009 and 2020 recessions. The others did, however, see slowdowns. And following a lag, the stock markets followed the BDI down.
The stock market is off to a rough start in January. We previously noted the January barometer that has an incredible 84.5% accuracy ratio since 1950. The saying goes: how goes January is how goes the year. The first five days of January are an early warning sign and the S&P 500 fell about 2% from its highs made on January 4, 2022. Now it is down about 8%. At its worst in this month so far, the NASDAQ was down over 14.0%, putting it firmly in correction territory. January appears to be headed for a down month, so the odds are that 2022 could be a down year. Of course, there are exceptions. Eight of 11 misses from 1950 have occurred since 2000. Is the January barometer becoming irrelevant? The stock market is typically weak into mid-term elections but then rallies hard out of the election. In a deeply divided U.S., the stock markets may be weaker than usual into the mid-terms. We have seen some forecasts calling for a 50% drop in the stock market this year, including from Boston asset manager GMO Jeremy Grantham. As we learned in 2008, these forecasts shouldn’t be ignored.
Negative signs are there, particularly with regard to inflation and oil prices. However, none of the signs are at levels where we can say with absolute certainty that a recession is coming. But that doesn’t mean one shouldn’t heed the warning signs. The warning signs are growing.
Chart of the Week
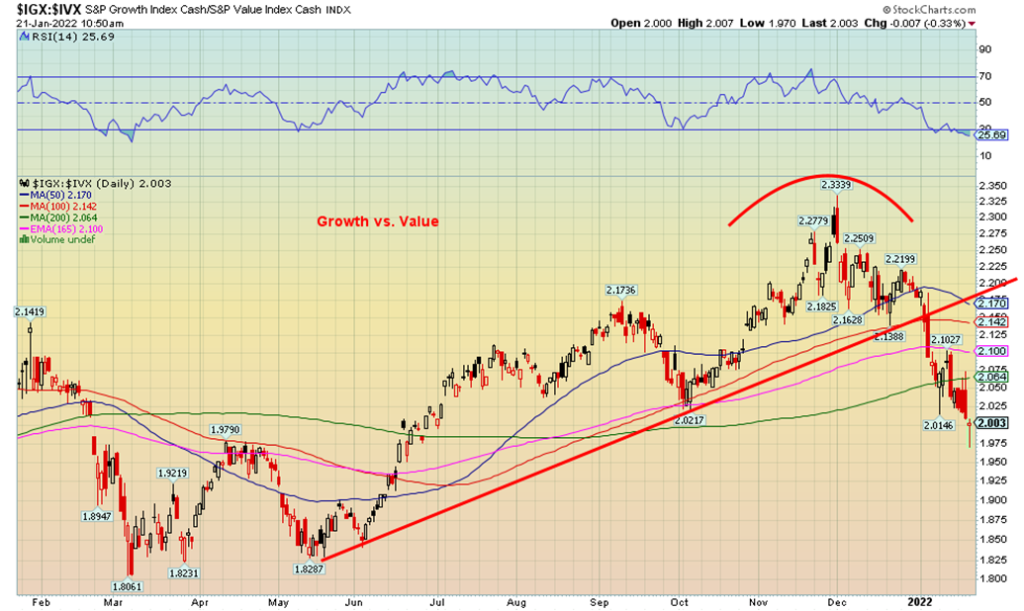
There appears to be a rotation going on between growth stocks and value stocks. The chart above is the S&P Growth Index/S&P Value Index Ratio. The chart broke down in late December and has now broken below the 200-day MA. Yes, the RSI at 26 is getting oversold but things can stay that way for a considerable time. The ratio may have made a small head and shoulders top (difficult to discern) but if that’s correct it had minimum measuring targets down to 1.95. We are getting close, so at minimum a temporary low may soon be at hand.
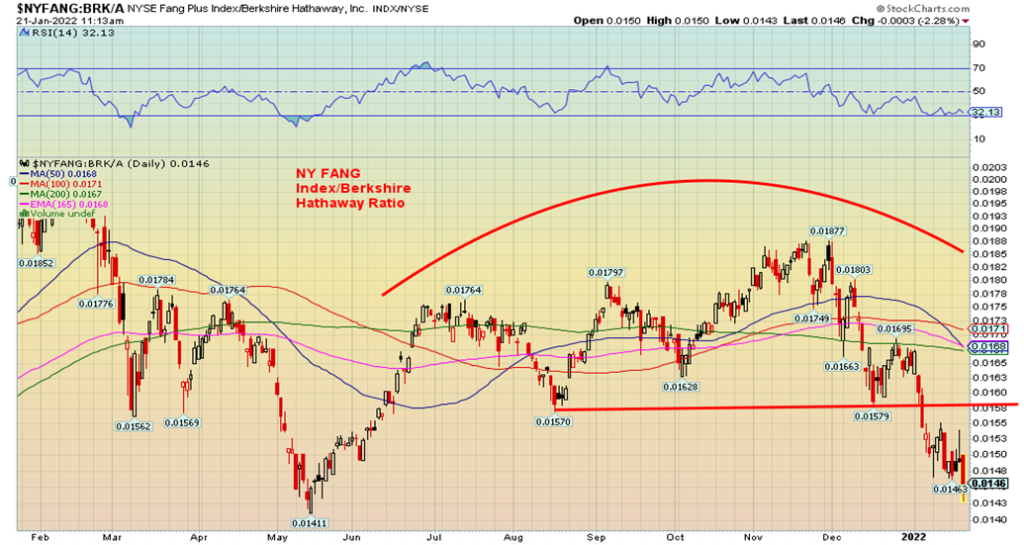
Here’s another way of looking at it. We are also showing a ratio between the NY FANG Index and Berkshire Hathaway, the ultimate value stock. The picture is the same. The ratio has broken down in favour of Berkshire Hathaway.
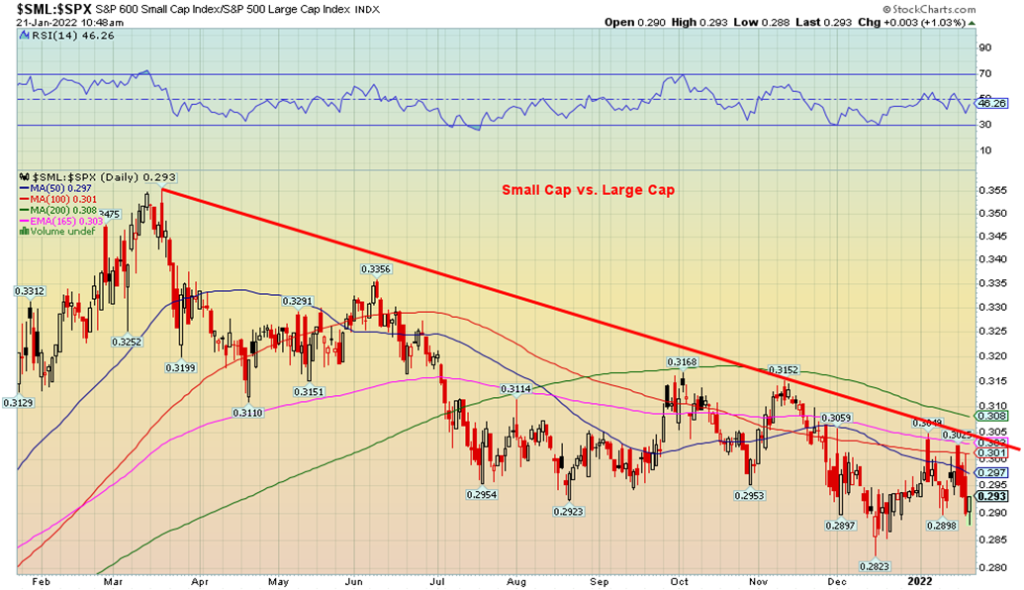
Finally, we are also showing the ratio between the S&P 600 (Small Cap) and the S&P 500 (Large Cap). Small caps have been increasingly under pressure since March 2021.
All of these are further signs of a market breaking down.
MARKETS AND TRENDS
| % Gains (Losses) Trends | ||||||||
| Close Dec 31/21 | Close Jan 21/22 | Week | YTD | Daily (Short Term) | Weekly (Intermediate) | Monthly (Long Term) | ||
| Stock Market Indices | ||||||||
| S&P 500 | 4,766.18 | 4,397.94 | (5.7)% | (7.7)% | down | neutral | up | |
| Dow Jones Industrials | 36,333.30 | 34,265.37 | (4.6)% | (5.7)% | down | down (weak) | up | |
| Dow Jones Transports | 16,478.26 | 15,247.28 | (4.1)% | (7.5)% | down | neutral | up | |
| NASDAQ | 15,644.97 | 13,768.92 | (7.6)% | (12.0)% | down | down | up | |
| S&P/TSX Composite | 21,222.84 | 20,621.39 | (3.5)% | (2.8)% | down | up (weak) | up | |
| S&P/TSX Venture (CDNX) | 939.18 | 856.62 | (5.1)% | (8.8)% | down | down | up | |
| S&P 600 | 1,401.71 | 1,388.27 | (7.6)% | (8.5)% | down | down | up | |
| MSCI World Index | 2,354.17 | 2,344.37 | (1.6)% | (0.4)% | up (weak) | up | up | |
| NYSE Bitcoin Index | 47,907.71 | 38,830.06 | (9.9)% | (18.9)% | down | down | up | |
| Gold Mining Stock Indices | ||||||||
| Gold Bugs Index (HUI) | 258.87 | 256.24 | 1.8% | (1.0)% | up | down (weak) | neutral | |
| TSX Gold Index (TGD) | 292.16 | 286.37 | 2.2% | (2.0)% | up | down (weak) | neutral | |
| Fixed Income Yields/Spreads | ||||||||
| U.S. 10-Year Treasury Bond yield | 1.52% | 1.77% (new highs) | (1.1)% | 16.5% | ||||
| Cdn. 10-Year Bond CGB yield | 1.43% | 1.79% (new highs) | 1.1% | 25.2% | ||||
| Recession Watch Spreads | ||||||||
| U.S. 2-year 10-year Treasury spread | 0.79% | 0.75% | (6.3)% | (5.1)% | ||||
| Cdn 2-year 10-year CGB spread | 0.48% | 0.54% | (10.0)% | 12.5% | ||||
| Currencies | ||||||||
| US$ Index | 95.59 | 95.64 | 0.5% | (0.4)% | down | up | neutral | |
| Canadian $ | .7905 | 0.7952 | (0.1)% | 0.6% | up | neutral | up | |
| Euro | 113.74 | 113.44 | (0.6)% | (0.3)% | up | down | neutral | |
| Swiss Franc | 109.77 | 109.64 | 0.2% | (0.1)% | up | neutral | up | |
| British Pound | 135.45 | 135.58 | (0.9)% | 0.1% | up | neutral | up | |
| Japanese Yen | 86.85 | 88.00 | 0.5% | 1.3% | up | down | down | |
| Precious Metals | ||||||||
| Gold | 1,828.60 | 1,831.80 | 0.8% | 0.2% | up | up | up | |
| Silver | 23.35 | 24.32 | 6.1% | 4.2% | up | down (weak) | up (weak) | |
| Platinum | 966.20 | 1,035.10 | 7.3% | 7.1% | up | down (weak) | up (weak) | |
| Base Metals | ||||||||
| Palladium | 1,912.10 | 2,104.30 | 12.0% | 10.1% | up | down | neutral | |
| Copper | 4.46 | 4.52 | 2.4% | 1.3% | up | up | up | |
| Energy | ||||||||
| WTI Oil | 75.21 | 85.14 | 1.6% | 13.2% | up | up | up | |
| Natural Gas | 3.73 | 3.78 | (11.3)% | 1.3% | down | neutral | up | |
Source: www.stockcharts.com, David Chapman
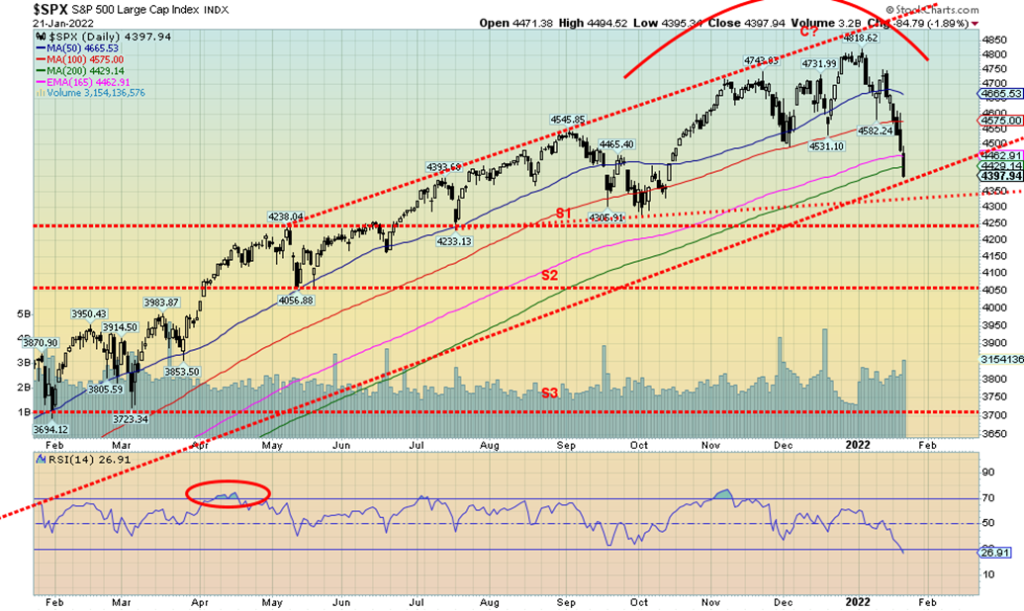
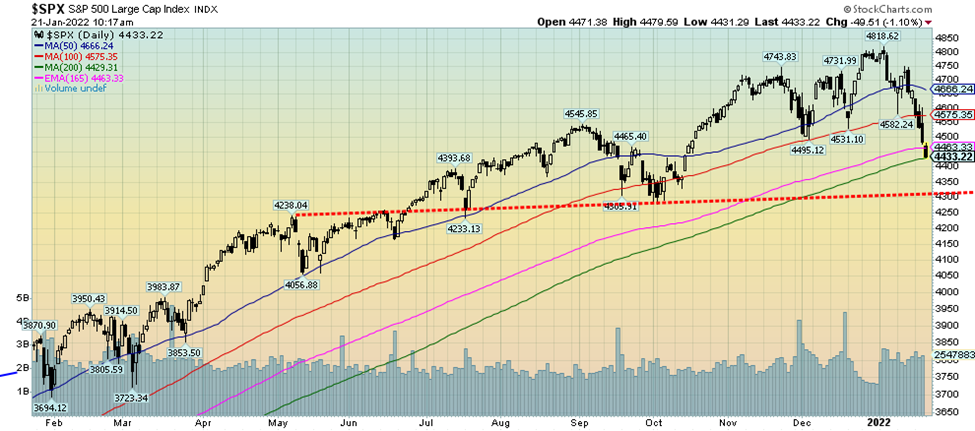
Can we say that the party is over? Of course, we don’t know yet but this past week was probably the worst seen since March 2020. We have previously noted the “Nifty-Fifty” rally of the 1972 that peaked in January 1973. Two years later the market fell 48%. This time we had the “Big Five” tech rally and we topped January 4. Maybe the advice should be don’t look down. You might not see the floor just yet. But here we are, on the cusp of the S&P 500 breaking an uptrend line that we drew from a low in June 2020. We have already broken the uptrend line from the March 2020 low. If we crack that line near 4,300 it will be all over but the crying. Closing at 4,397 on Friday leaves us perilously close. Below 4,300 who knows what stop losses will be triggered.
That said, we could also be getting close to a near-term low. Friday’s RSI is 26.91 entering oversold territory. A big gap down on Monday (see Netflix) could present speculators with a buying opportunity. Just remember it might only be a short-term buying opportunity. The January barometer appears to be kicking in. The S&P 500 is now down 7.7% since the start of the year and down 8.7% from the all-time high set on January 4, 2022.
The worst January ever? January 2009 when the S&P 500 fell 8.6%. But, as everyone will argue, 2009 closed in the black. It was an exception year. January 2020 were also negative, but finished in the black. In fact, they had superb years, as did 2009. The first five-days early warning barometer said it could be a bearish month and year. The January barometer, 84.5% accurate since 1950, is now signaling that 2022 may not be a very good year. Unless it turns into 2009 and 2020. Since 2000 eight of the 11 misses of the January barometer have occurred. Not all were because of down January. But down January’s in 2003, 2009, 2010, 2014, 2016 and 2020 finished as up years. 2001 and 2018 saw up January’s but down years.
Some therefore might dismiss the January adage as an old wives’ tale. But that is the tale of the tape. Also, as we have noted previously, mid-term election years usually see a weak market into the election and then a strong rally afterward. In previous mid-term elections we didn’t have the U.S. on the verge of its own civil war, given the deep polarization in the country. And we didn’t have the threat of war looming and the tensions between the U.S. and Russia. Worse, you could have the spectacle of the previous president being subpoenaed by the January 6 committee or criminally charged by the New York AG’s office in the investigation into the Trump organization. Either one could set off violent protests.
On the week the S&P 500 lost 5.7%, the Dow Jones Industrials (DJI) dropped 4.6%, the Dow Jones Transportations (DJT) was down 4.1%, the NASDAQ was down 7.6% while the S&P 500 Equal Weight Index fell 5.3%. The small cap S&P 600 dropped 7.6% as small caps continued to get hit harder. In Canada, the TSX Composite was down 3.5% while the small cap TSX Venture Exchange (CDNX) was off 5.1%. Bitcoin continued to get killed and the NY Bitcoin Index was down 9.9%, but Bitcoin itself was last down 20.0% on the week.
In the EU, the London FTSE lost 0.8% (a star?), the Paris CAC 40 was down 1.0%, and the German DAX was off 1.8%. In Asia, China’s Shanghai Index (SSEC) was a star. It was flat. But the Tokyo Nikkei Dow (TKN) fell 2.1%. They all might be weaker on Monday as the NY market spills over. The MSCI World Index fell 1.6%.
What to look for? Monday could be messy, especially if we break under 4,300 and register a mini-crash. But oversold indicators suggest we could be nearing at least a temporary low. We might feel a bit better if we can regain 4,500. However, the reality is we need to regain above 4,750 to suggest we are getting out of the woods and could then rally to new highs.
Finally, we note that Boston asset manager of GMO Jeremy Grantham has predicted that the markets will fall 50% going forward. He notes that never have we deviated so far from the long-term trend. And, of course, that we have been in a massive bubble fueled by ultra-low interest rates for lengthy periods and massive liquidity injections through QE and runaway money supply. So again, is the party over?
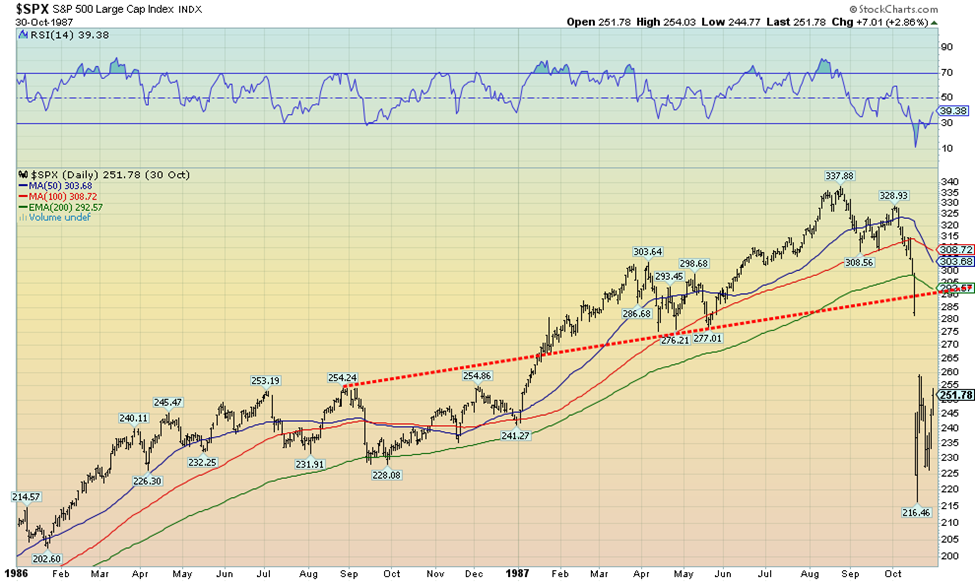
We also muse as to whether the stock market could crash this Monday. We were taken by this comparison between today’s market and the market leading up to the 1987 stock market crash. Yes, a crash may already be under way by the time you receive this. But in the end a crash is usually a buying opportunity. But the charts are eerily similar.
S&P 500 1986-1987
S&P 500 2021-2022
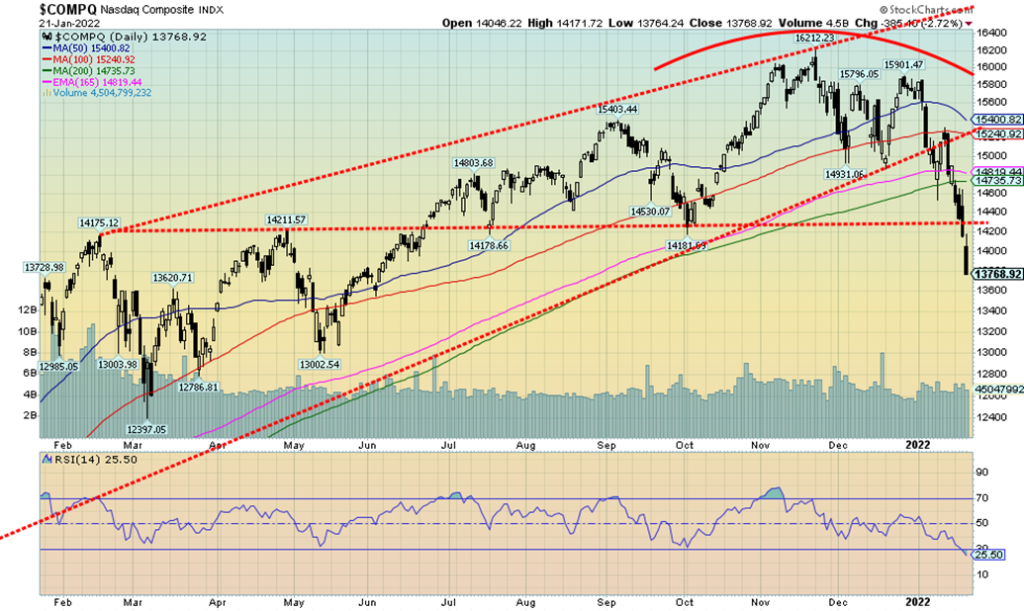
Is the NASDAQ in trouble? This past week the NASDAQ fell 7.6%, the worst decline since 2020. On the month the NASDAQ is now down 12.0% and 15.1% from the all-time high. We are firmly in correction territory and approaching bear market territory. For the record, the worst January ever recorded for the NASDAQ was in January 2008 when it fell 9.9%. We are now exceeding that. We are also firmly under the 200-day MA, another sign we could be entering a bear market. We suppose the good news is that the RSI at 25.50 is into oversold territory. But we may not be over yet. What if we do a Netflix?
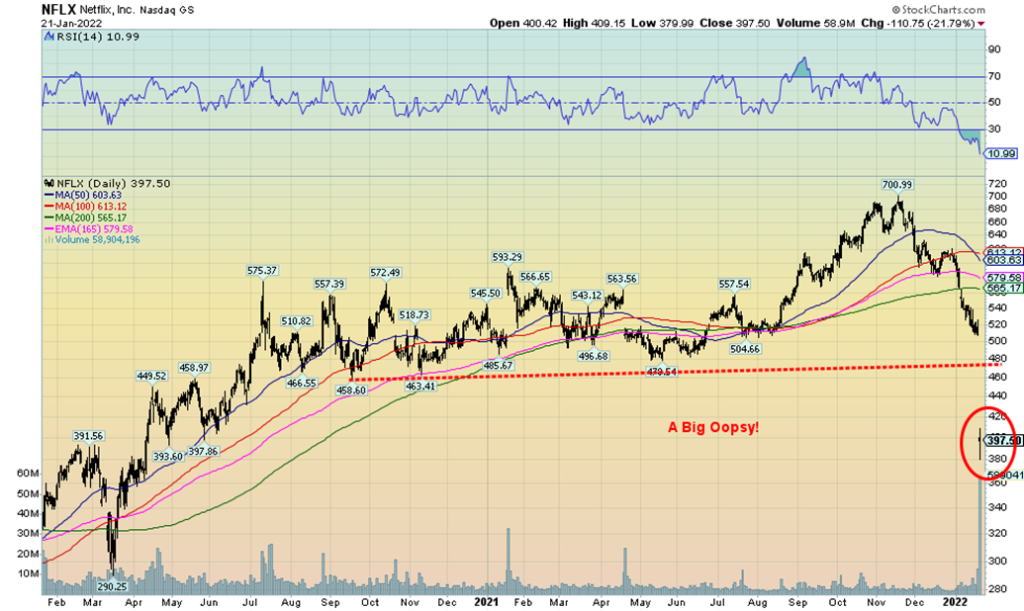
Yes, Netflix who crashed 21.8% on Friday and is down 43% from its all-time high and off 24.4% on the week. Look at that huge gap meltdown below. How do you spell crash? Netflix was just the worst of the FAANGs this past week. Everybody got whacked. Well, almost everybody. Meta (Facebook) was down 8.7%, Apple -6.2%, Amazon -12.0%, Google -6.9%, Microsoft -4.6%, Tesla -10.1%, Twitter -9.4%, Alibaba -6.4%, and Nvidia -13.2%. Was there a winner? Yes, Baidu +1.6%. Shopify, a Canadian star, fell 20.0% on the week. In a week of stars and dogs, only Baidu could be considered a star. Everybody else—dogs!
However, some have been pointing out for months that the market is in a bubble and when the reckoning comes, it could be swift. The question is, are we at a low? Or is there more pain to come? We are on pace for the worst month since March 2020.
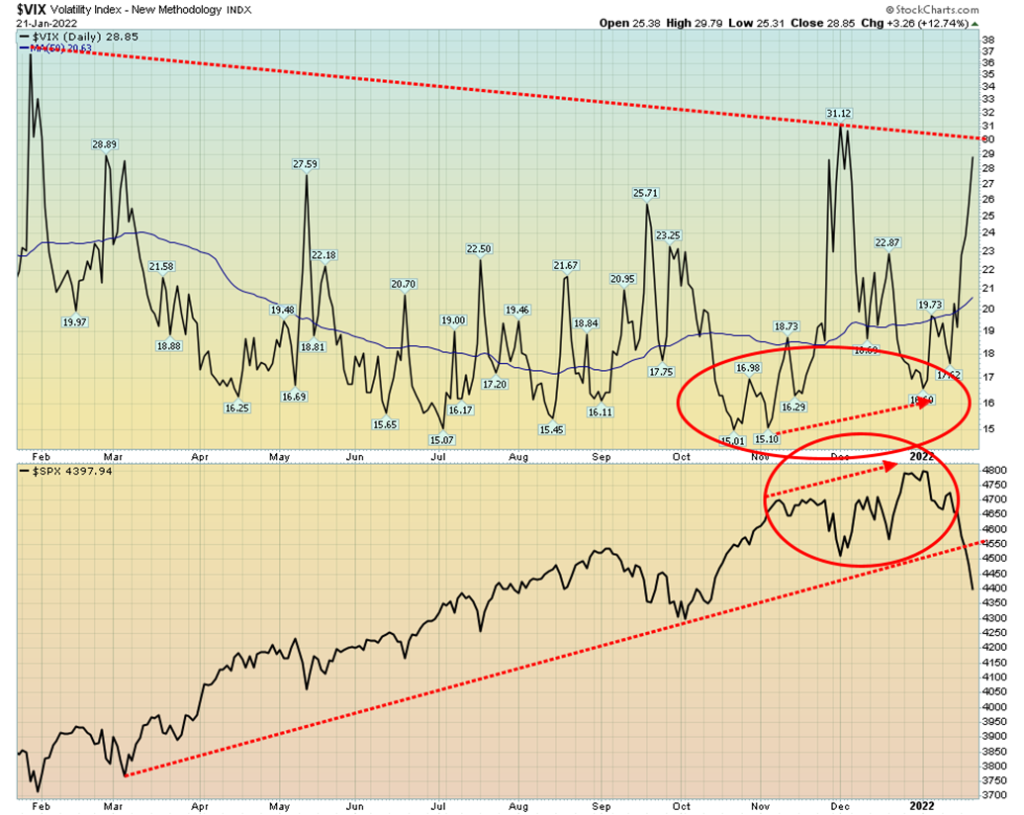
The stock market indicators are turning negative. Here is the VIX Volatility Index that just hit its highest level since December, closing at 28.85. The S&P 500 has broken under support coming up from the February/March 2021 lows. Our expectations are that we will break that downtrend line for the VIX and rise to over 30 before this finished. Since the VIX started to be tracked, the all-time high is 59.89 seen in November 2008. The March 2020 crash saw the VIX rise to 53.54. Note the negative divergences between the VIX and the S&P 500 seen at the market highs in November and again into January. The VIX was rising, even as the S&P 500 was making new all-time highs.
Elsewhere, our ALL-Bears Index has just ticked into ugly territory. The last time we were there was during the March 2020 crash. The CBOE put/call ratio just ticked to 0.82 which also is putting it in high territory that is often associated with lows in the market. The market peaked over 1.0 in December 2018 and again in March 2020. So we are entering the zone where one looks for a low. We have broken the uptrend line from the
March 2020 low as well. The NYSE advance/decline line is making new lows with the S&P 500 so they are in alignment. However, the percentage of stocks trading above their 200-day MA is still at 53% not yet in bear territory. As well the S&P 500 Bullish Percent Index (BPSPX) at 47.20 is still a little too high. Look for readings under 40 to suggest we are nearing a low.
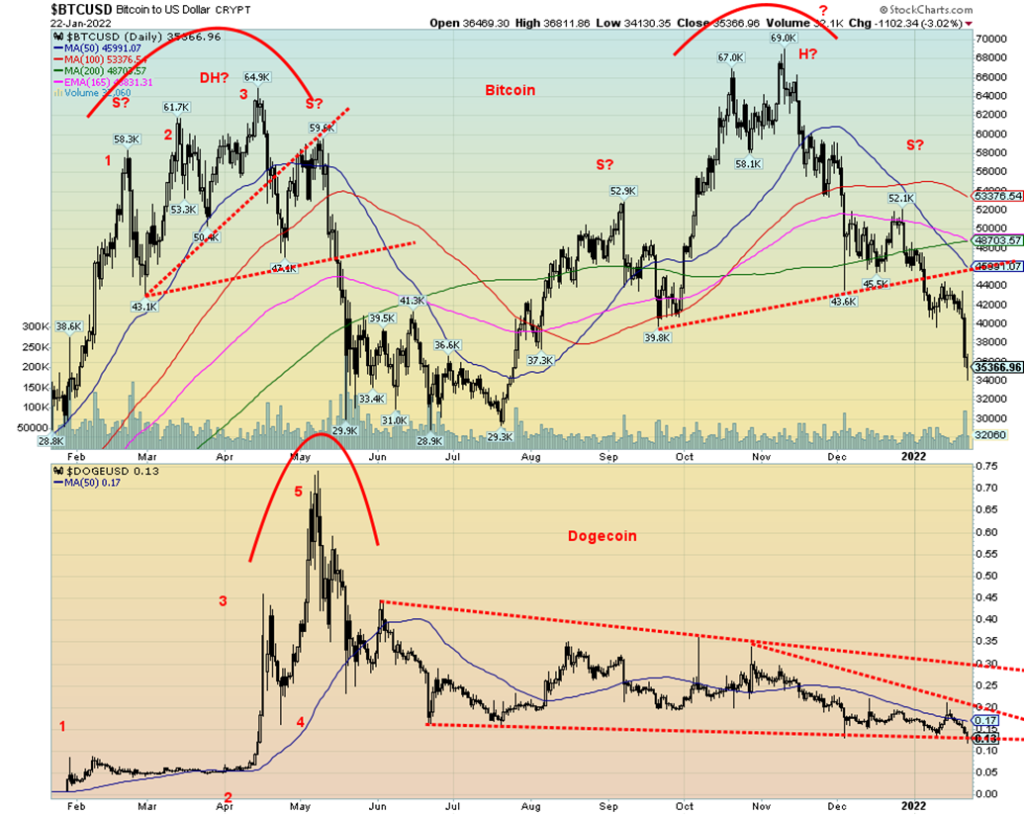
The next Bitcoin crash appears to be underway. The head and shoulders pattern noted here a few weeks back suggested that Bitcoin could collapse to $15,000 once it broke that neckline around $44,500. So far, so good. Bitcoin is down to $35,000 and counting. Roughly $1 trillion has been wiped out of the cryptos over the past few weeks. The entire sector is now down to $1.6 trillion market cap with Bitcoin still leading the way at $671 billion. But at that top back in November Bitcoin had a market cap of $1.3 trillion. How quickly the mighty have fallen. A crash of nearly 50% and counting. Our old favourite, Dogecoin, also appears to be in breakdown mode from a descending triangle. Its target? Back below a penny where it started from in January 2021. Goodbye
cryptos? Okay, they’ll probably survive, but will a universe of over 17 thousand different cryptos on over 450 different exchanges survive? We don’t think so, but time will tell.
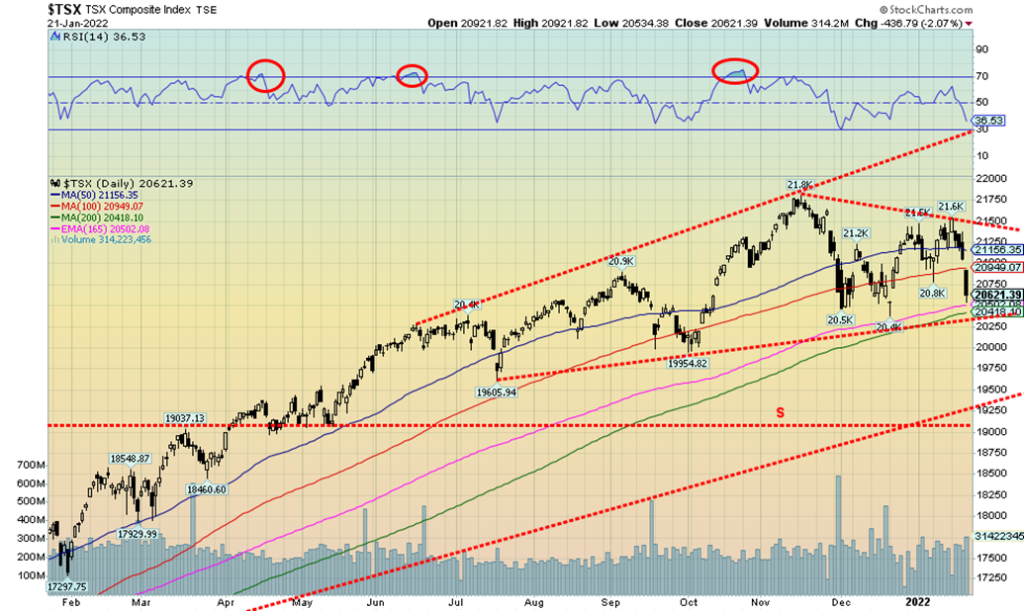
The TSX Composite joined the downer party this past week, but the fall was smaller as the TSX fell only 3.5%. The small cap TSX Venture Exchange (CDNX) didn’t fare as well, falling 5.1%. Leading the way down was Technology (TKK), down 7.7%. Health Care (THC) did worse, down 9.0% while Consumer Discretionary (TCD), obviously worried about a slowdown, was down 6.3%. Significantly, the Financials (TFS) made new all-time highs, then reversed and closed lower by 2.8%. A key reversal for the financials? Energy (TEN) lost 3.7% while Consumer Staples (TCS) fell a surprising 4.6%. But not all was gloom as Gold (TGD) and Utilities (TUT) were the only two gainers, up 2.2% and 0.5% respectively. Friday’s meltdown for the TSX (down 2.1%) saw the index gap lower. So that could be a breakaway gap. Support of the 200-day MA (20,418) and trend line near 20,300 might give some solace that we could rebound. However, if we break down, our next major area of support is not until 19,000–19,250. We didn’t like the key reversal seen for the Financials as it was a key reversal for the S&P 500 that started this decline. Regaining back above 21,500 could end talk of a decline and refocus everyone to the upside once again.
U.S. 10-year Treasury Bond/Canadian 10-year Government Bond (CGB)
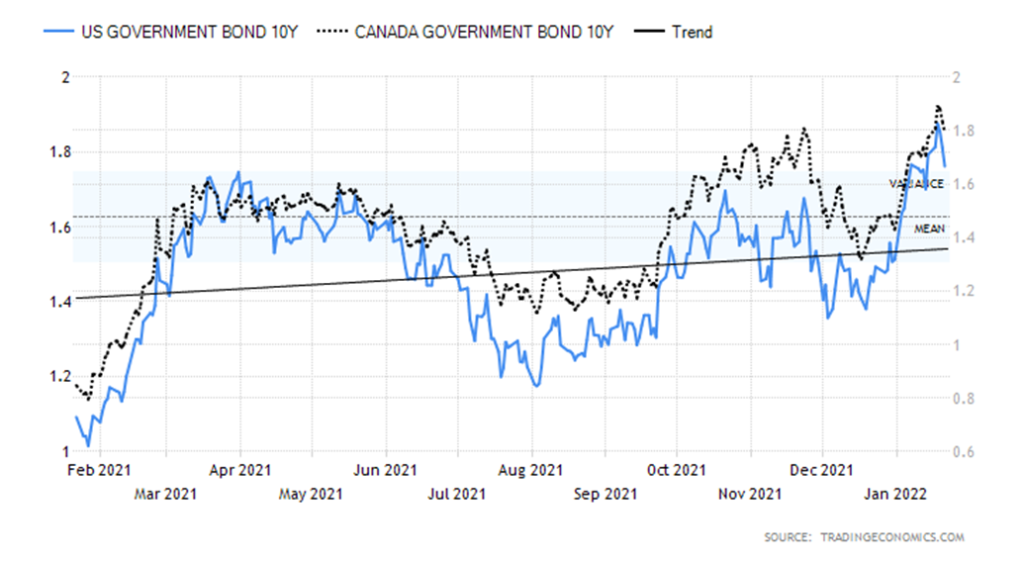
Fear of rising interest rates pushed bond yields higher this past week. But then stock market jitters and crashing tech stocks sent bond yields lower. And then there was fear of the ongoing US/Russia tension over Ukraine, also helping to push bond yields lower on safe-haven buying as funds flee Europe. The U.S. 10-year treasury note hit a high this past week of 1.91% as fears of interest rate hikes ratcheted higher. Then came the tech market swoon and yields fell. Add in US/Russia tensions. The 10-year closed at 1.77%, down from 1.78% the previous week. And the yield curve narrowed further as the 2-year treasury note rose to 1.02%, leaving the 2–10 spread at 0.75%, down from 0.80% the previous week. The 2–10 spread is falling fast but remains a long way from going negative and signaling an impending recession.
With the tech-heavy NASDAQ falling into correction territory, down 10%+, bonds took notice. This past week the reversal from the highs was one of the steepest seen in the past year. Bonds become a safe haven during times of stock market turmoil. But the week’s economic numbers didn’t help. The NY State Empire Manufacturing disappointed, coming in at negative 0.7 when they expected a reading of +25. The Philly Fed did help, coming at 23.2 vs. an expectation of 20. But initial claims were higher at 286,000, well above the expected 220,000. What does that say about the employment numbers due out on February 4? Housing starts were okay at 1.7 million, above the expected 1.65 million and building permits were 1.87 million vs. expected 1.7 million. But existing home sales disappointed at 6.18 million vs. the expected 6.44 million. So, there were some hits and misses.
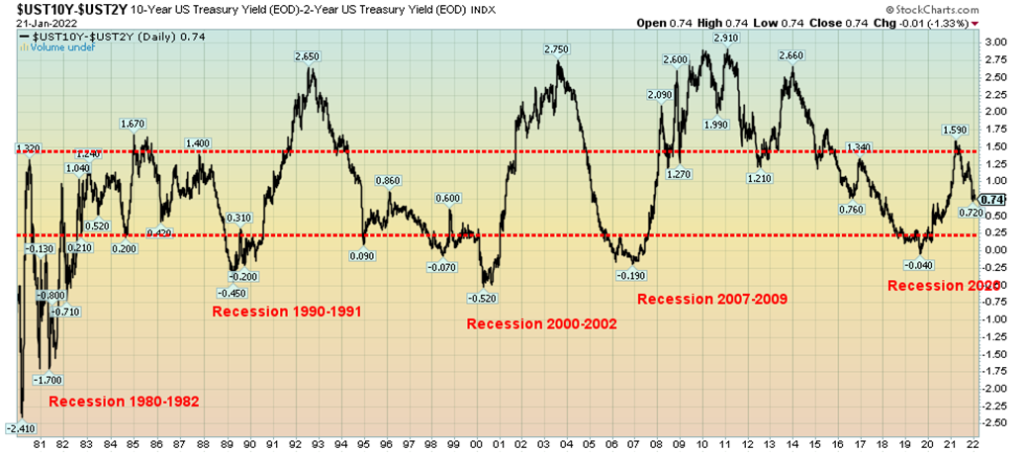
Note the chart on the 2–10 spread. Negative spreads preceded all recessions dating back to 1980. There were some wiggles below zero in 1998, but the yield curve didn’t go more negative until 2000 when tech stocks crashed.
But the story this week was the rumble in the stock market along with increased tensions between the US/Russia. And that has investors scurrying for the safety of bonds—and gold as well as gold gained on the week. So, you could have the specter of rising short yields as fears grow of the Fed hiking rates while long rates fall on stock market and war worries.
Canada yields also rose and fell but not as much. Rates did peak out at 1.93% before settling back to 1.79% a gain of 1.1% on the week. The Canadian 2–10 spread narrowed to 0.54%, down from 0.60% the previous week. The story in Canada is much the same as the U.S. Not helping were housing starts for December coming in at 236,000, below the expected 270,000. Canada’s inflation rate y-o-y was 4.8% as expected. The core inflation rate was 4% y-o-y but above the expected 3.5%. Retail sales for November were +1.1%, but that was below the expected +1.3%.
This week both the FOMC and the Bank of Canada (BofC) meet. No interest rate hikes are expected from the Fed, but now some are expecting them to hike more than 0.25% in March. But as we have noted, could the Fed surprise and unexpectedly hike this week? Some think so. Watch the language for clues on a March rate hike. As to Canada, there is some speculation that the BofC will move and hike interest rates 0.25%.
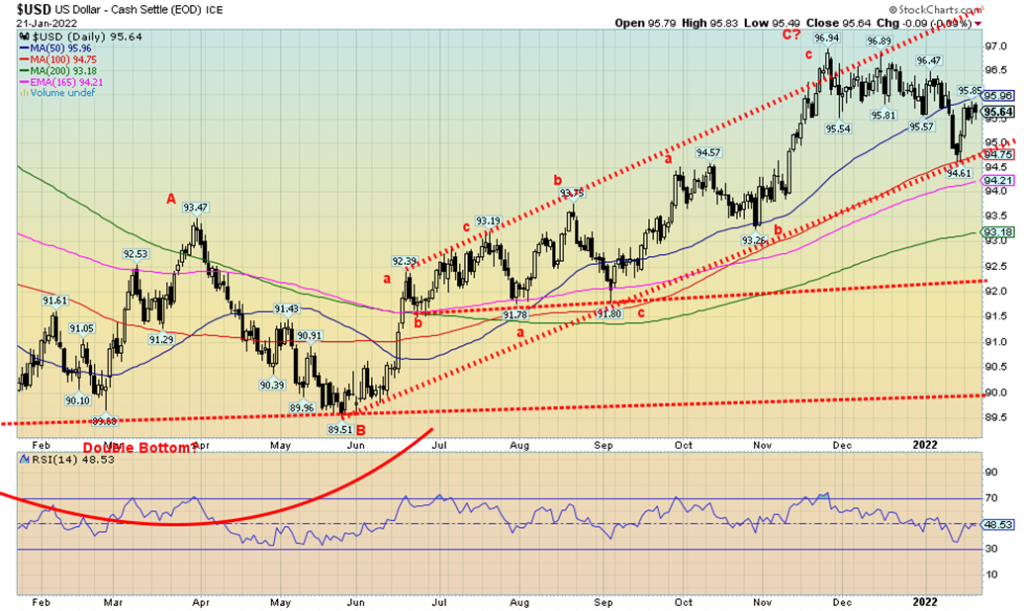
The US$ Index gained 0.5% this past week as geopolitical concerns (Russia/Ukraine, Middle East) drove funds into U.S. dollars as a safe haven. The euro fell 0.6%, the Swiss franc did gain a small 0.2%, while the pound sterling dropped 0.9% as PM Johnson faced a political crisis amid cries to resign over partygate. The Japanese yen also benefited, up 0.5% while the Canadian dollar benefited from oil turmoil and held its own but still fell 0.1%. The US$ Index remains in an uptrend; however, the uptrend is weakening. Another break under 94.75 could spell trouble and a decline to 94 and even down to 93 could be underway. Major long-term support is around 92/92.25. The US$ Index rallied back this week to 50-day MA but failed to cross over. This could be viewed as negative. A drop under 94.75 would end discussions of higher levels at least temporarily. We continue to believe that the US$ Index made a zig-zag move from the May 2021 low near 89.50. The zig-zag appears to be a triple abcabcabc. It’s seen rarely but it is corrective, not the start of a new impulse wave. We await a drop back under 94.75, but regaining 96 would be positive and suggest the US$ Index could have higher potential.
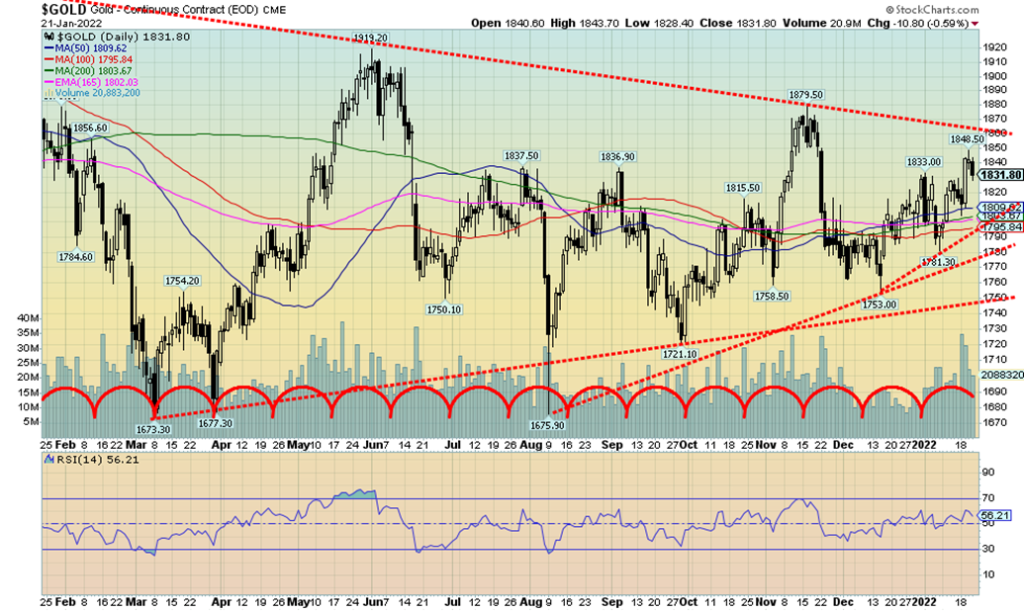
Gold, the safe-haven vehicle, jumped 0.8% this past week, thanks to a big $30 up day on Wednesday. Silver did even better, rising 6.1%. Gold is eyeing the FOMC meetings this week for how the Fed will react to inflation concerns. Will the Fed tighten faster than expected? If so, that could lower the appeal of gold? Some are now expecting the Fed to tighten faster than expected. As well, gold is eyeing the Russia/Ukraine conflict. Geopolitical concerns can drive gold prices.
It was a good rally but gold, like everything else, suffered on Friday, falling a small 0.6%. If the stock market were to crash, we do note that gold outperformed everybody else during the 1987 crash, the 2008 crash, and the 2020 crash. But that’s the commodity gold, not the gold stocks who were amongst the worst performers.
Also rising on the week were platinum, up 7.3% and palladium, up 12.0%. Palladium, in particular, benefited considerably from the Russia/Ukraine conflict as Russia is the world’s largest palladium producer. The U.S. and China are the world’s largest palladium consumers, used primarily in motor vehicles.
Gold is building a nice uptrend line and we successfully broke out over $1,800/$1820/$1,830 resistance this past week, closing at $1,831.80. But more resistance lies ahead at $1,850/$1,860. We consider breaking that zone even more important. We set our sights on the November high of $1,879.50. Taking out that level would confirm the low at $1,721. There would be further resistance at $1,900/$1,920. But until we do, we remain at risk of failure. A break now of $1,795 would spell trouble and a break of $1,780 more trouble. Under $1,750
we would be focused on the potential for new lows below $1,720 and even below $1,675 the August 2021 low. We continue to believe we are in an up phase and we continue to have positive seasonals at least into February. We believe our 31-month cycle low was seen with the double bottom in March and August 2021 near $1,675. But our concern is the potential for an aborted rally that fails to make new highs. That’s why as the first rung that needs to be taken out is the November high of $1,879.50. That would be a good start.
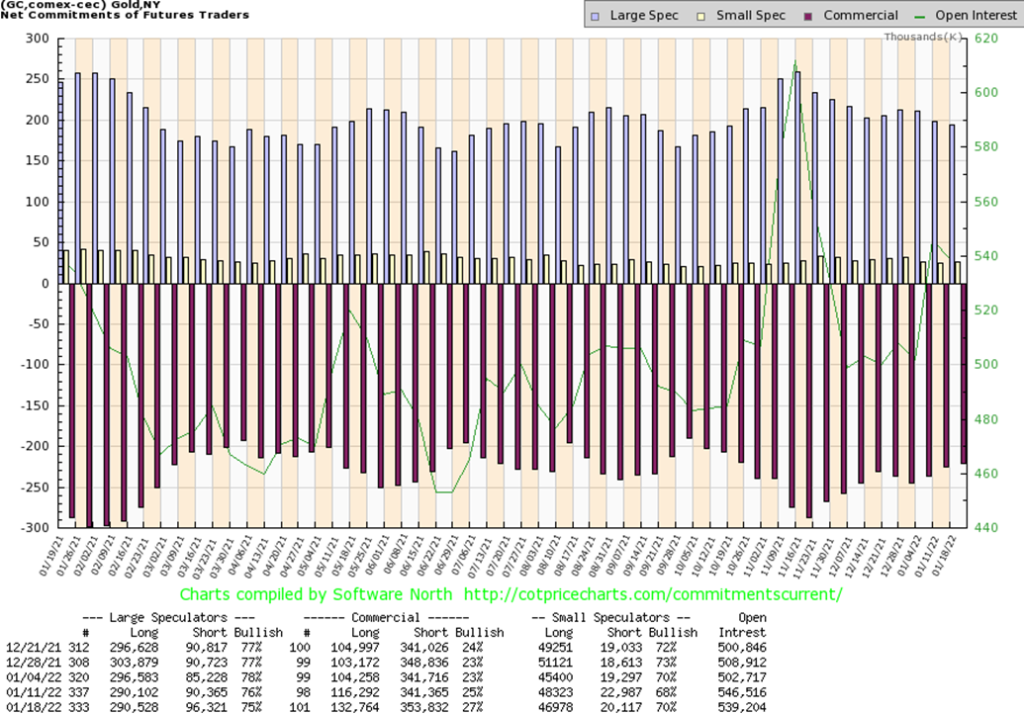
The gold commercial COT (bullion companies and banks) improved nicely to 27% this past from 25%. Long open interest jumped over 16,000 contracts even as short open interest rose over 12,000 contracts. The large speculators COT (hedge funds, managed futures, etc.) slipped to 75% from 76% as they added to short positions by about 6,000 contracts. Overall open interest fell this past week about 7,000 contracts on an up week. That suggests long covering as the markets rose. Nonetheless, we view the improvement in the commercial COT as at least mildly bullish.
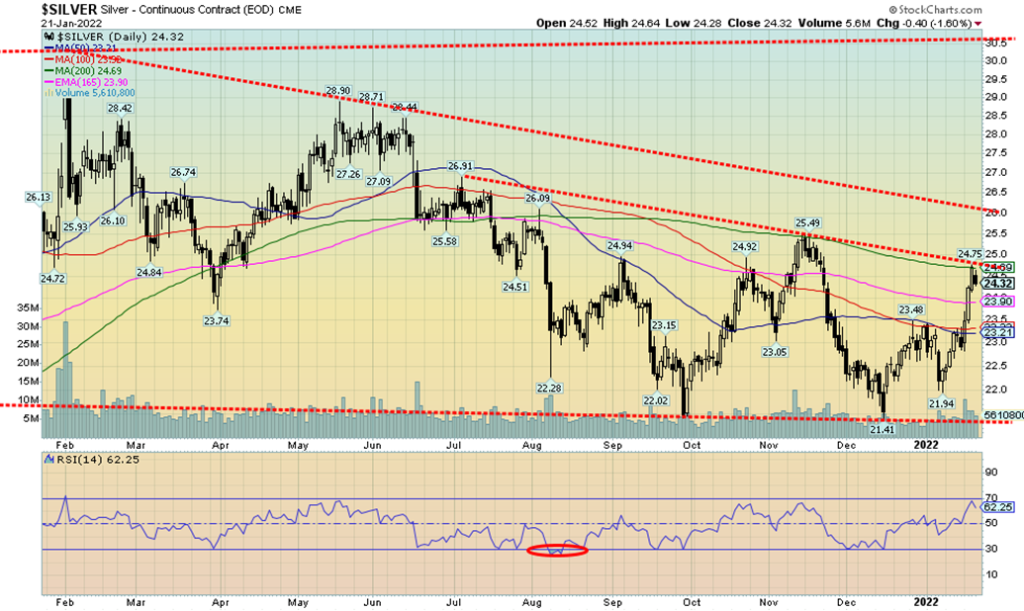
Silver prices enjoyed a good week, closing over $24 and gaining 6.1%. The rally, as good as it was, still left silver short of its November high of $25.49. That level now becomes key. Failure to take that out level could translate into silver falling. A breakdown then under $23 would be seen as negative and under $22.75 we could be set up for a test of the December low of $21.41. A breakdown under $21 could set up a decline to $17. So, a breakout over $25 and the November high is essential if we are to go higher to $26. Over $26 things are looking up and resistance wouldn’t be seen again until we reach $28/$29. Silver is a key component in computers and the burgeoning clean fuel industry so the demand is definitely there. Add in the medical industry and you have built-in firm demand. This past week for silver was the best since May 2021. The silver chart is somewhat ambiguous here as we could interpret it as either a top or a bottom. Hence, we await resolution with either a breakout or a failure: breakout over $25.50, breakdown under $23. We favour the breakout but admit we can’t ignore the breakdown.
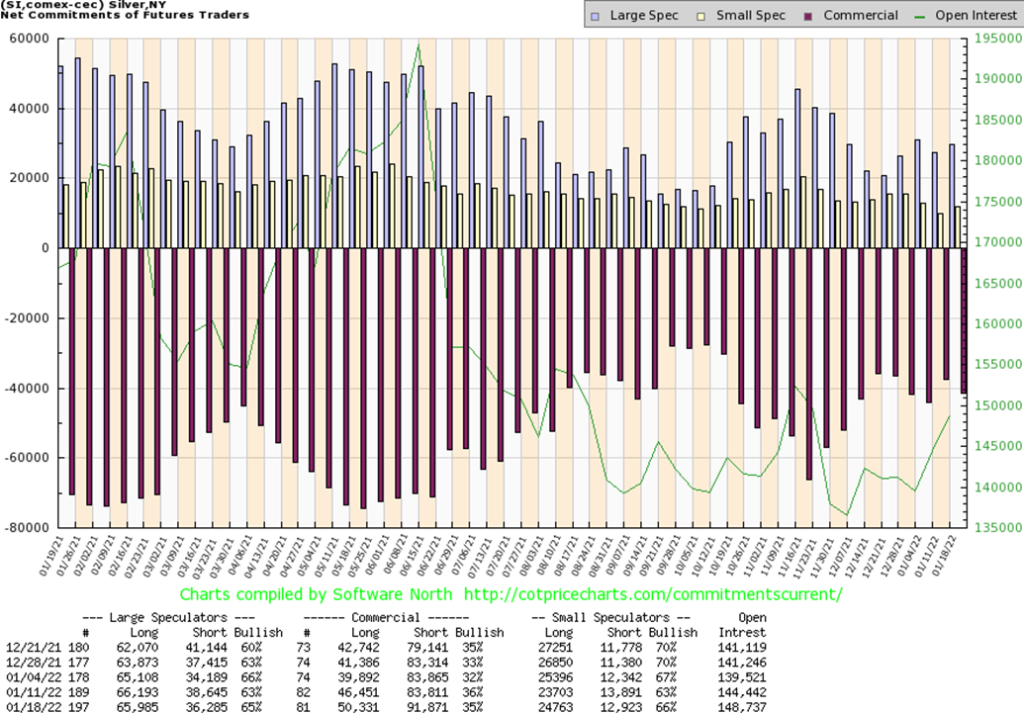
The silver commercial COT slipped this past week to 35% from 36%. Given the big jump in silver prices we suppose it is not surprising. However, this report does not include the big up day seen on Wednesday. Long open interest did rise about 4,000 contracts, a big positive, but short open interest also went up roughly 8,000 contracts. Hedging their bets? The large speculators COT rose to 65% from 63% as they were roughly unchanged on long open interest but slashed their short open interest by over 2,000 contracts. We continue to view the silver COT as at least mildly bullish.
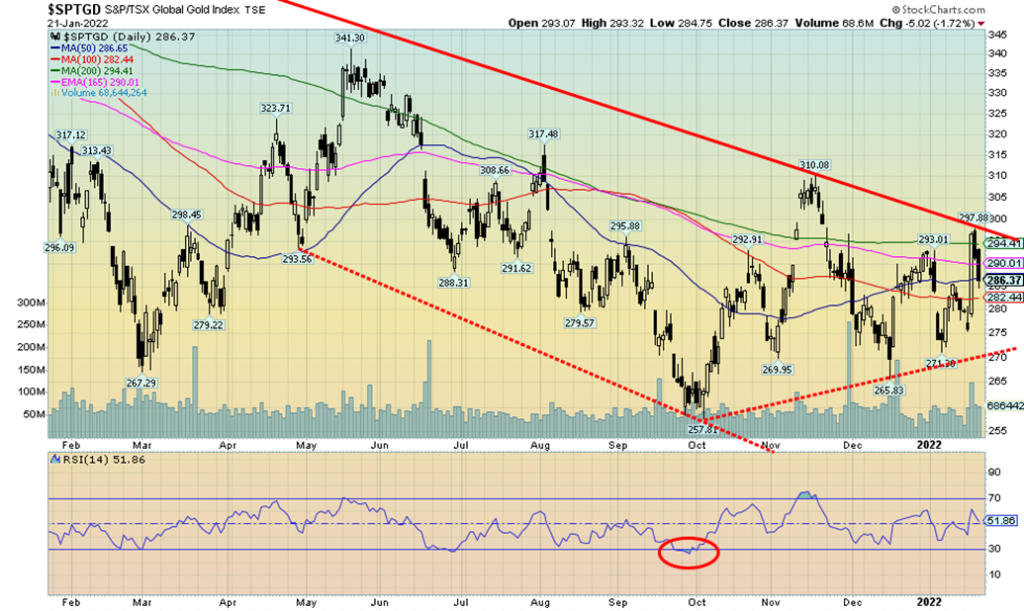
Gold stocks fell on Friday, possibly in sympathy with the crashing stock market. However, they managed to retain their earlier gains as the TSX Gold Index (TGD) rose 2.2% on the week and the Gold Bugs Index (HUI) was up 1.8%. However, on Friday the TGD fell 1.7% and the HUI was off 2.4%. Could the gold stocks crash along with the stock market? The gold stocks universe is pretty small compared to the broader market. All the gold companies in the world couldn’t crack the top ten of global companies by market cap. So when the stock market falls, the gold companies often perform worse. During the 1987 stock market crash the S&P 500 fell 23.4% but the Philadelphia Gold & Silver Exchange (XAU) dropped 32%. In the 2008 crash the S&P 500 fell 33% from mid-September to the October low but the XAU dropped 59%. It was the same story during the March 2020 pandemic crash. The S&P 500 fell 33% while the XAU dropped 55% top to bottom in March. We used the XAU because the HUI wasn’t operative in 1987. A crash is a liquidity crisis and markets that are thinner get hurt more. We are, however, reminded the commodity gold was usually the best performer.
The TGD rallied to its resistance line currently near 297 before profit taking and market turmoil took over. We are still using 300 as the level to be taken out to confirm that a low is in and we are poised to move higher. To the downside, the 270 zone remains good support. A drop through that level would probably translate into new lows. The TGD is in an uptrend. The TGD is also forming what appears as a symmetrical triangle. Symmetrical triangles can be consolidation patterns or bottom patterns. They are rarely seen at tops. A firm break of 300 could project the TGD up to 350. Conversely, a breakdown under 270 could target down to 215.
Gold stock sentiment remains mired as the Gold Miners Bullish Percent Index (BPGDM) is at 30% which is still pretty low. The Gold/HUI ratio is around 7 which is historically very high and tells us that gold stocks remain cheap vis-à-vis gold. The ratio would have to fall under 2.5 to suggest that the gold stocks are becoming expensive vis-à-vis gold. We haven’t seen a reading under 2.5 since 2011.
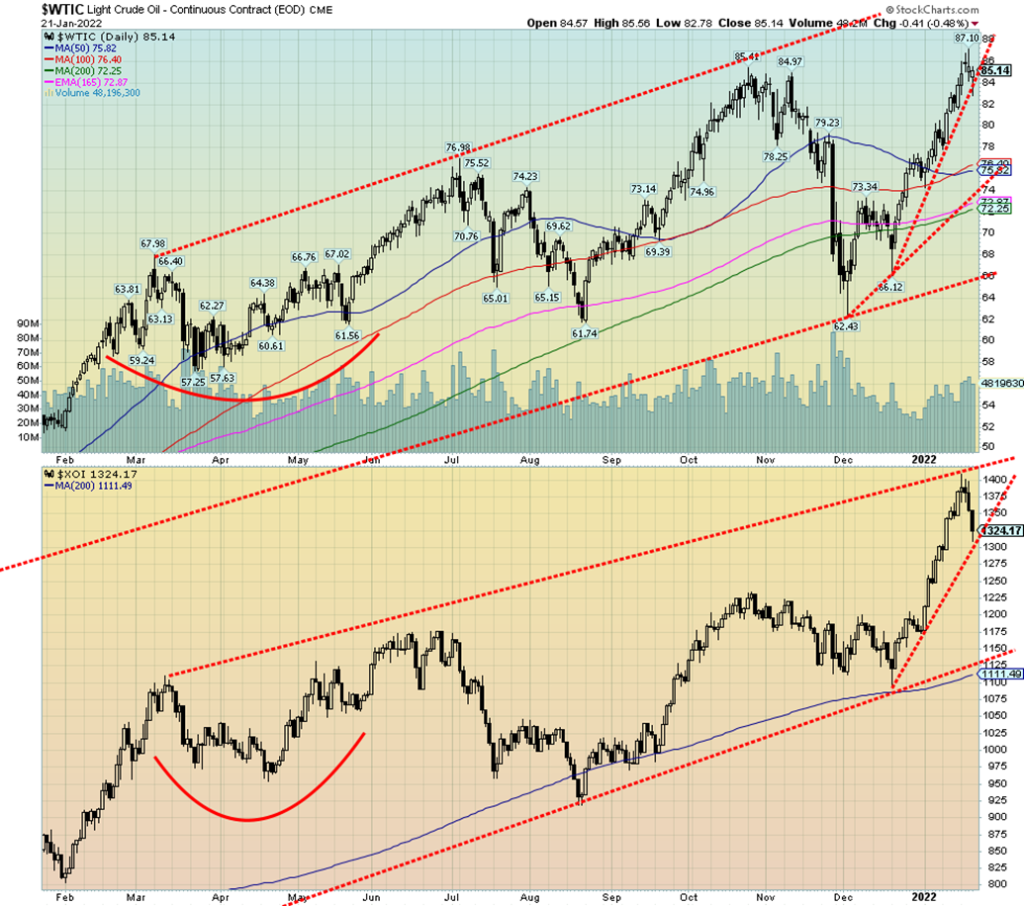
Possibility of war between Russia/Ukraine. Drone attacks from the Houthis against the UAE. Major investment banks projecting that oil will hit $100/barrel this year as oil inventories waver and OPEC+ spare capacity wanes. All of this helped propel WTI oil to a high at $87.10 this past week. Brent crude went past $90 this past week. In no time flat, the price of gas at the pump leaped once again. By Friday the price of oil had eased as some of the geopolitical worries waned. For the record, Russia is the world’s third largest oil producer and the world’s second largest natural gas (NG) producer, and holds the world’s eighth largest reserves of oil and the world’s largest reserves of NG. The EU imports at least 50% of its NG needs from Russia. Countries in the former Warsaw Pact and Soviet Union get 99% of their NG needs from Russia. Germany gets over 40% of its NG needs from Russia.
Oh, there is some hope for relief. Libya is slowly coming back on the market and apparently Ecuador will be as well. We notice that there is a wide backwardation in the oil futures market. Cash Friday closed at $86.90, but January 2024 closed at $70.75 a drop of $16. Backwardation signals that oil prices may be lower as we move forward.
WTI oil rose 1.6% this past week, but strangely NG fell off 11.3%. The energy stocks joined the broader market to the downside this week. The ARCA Oil & Gas Index (XOI) fell 4.3% while the TSX Energy Index (TEN) dropped 3.7%. Both remain up on the year. Oil prices fell on Friday following a report that U.S. crude and fuel inventories rose.
Oil tested an uptrend line on Friday but managed to close back over it—just. The uptrend line is steep, so our expectations are that we shouldn’t read too much into the probability that oil will break the line. It needs a respite. WTI oil has support down to $76. A break of $75 could signal much lower prices. The energy stocks, as noted, probably succumbed on Friday as much from the stock market meltdown as they did from oil and gas falling. The XOI has good support down to 1,200. The TEN down to 168. The stocks are taking a much-needed cooling off as they had become overbought.
That’s unless things really flare up again, particularly in Russia/Ukraine. However, the Middle East could flare up again as the Houthi (breakaway Yemen rebels) attack on UAE energy facilities (UAE is OPEC’s third largest producer) prompted a retaliatory attack by Saudi Arabia against the Houthis. The attack killed dozens, including women and children. Could the Houthis attack Saudi oil facilities? The Houthis (Shiite) are intricately caught up in the Sunni (Saudi Arabia), Shiite (Iran) war. The Houthis make up roughly 25% of Yemen’s population concentrated in the north. The remaining 75% are Sunni. In global geopolitical terms, the Saudis/UAE/Yemen are backed by the U.S./Israel and the Houthis backed by Iran.
__
(Featured image by geralt via Pixabay)
DISCLAIMER: This article was written by a third-party contributor and does not reflect the opinion of Born2Invest, its management, staff, or its associates. Please review our disclaimer for more information.
This article may include forward-looking statements. These forward-looking statements generally are identified by the words “believe,” “project,” “estimate,” “become,” “plan,” “will,” and similar expressions. These forward-looking statements involve known and unknown risks as well as uncertainties, including those discussed in the following cautionary statements and elsewhere in this article and on this site. Although the Company may believe that its expectations are based on reasonable assumptions, the actual results that the Company may achieve may differ materially from any forward-looking statements, which reflect the opinions of the management of the Company only as of the date hereof. Additionally, please make sure to read these important disclosures.
David Chapman is not a registered advisory service and is not an exempt market dealer (EMD) nor a licensed financial advisor. He does not and cannot give individualised market advice. David Chapman has worked in the financial industry for over 40 years including large financial corporations, banks, and investment dealers. The information in this newsletter is intended only for informational and educational purposes. It should not be construed as an offer, a solicitation of an offer or sale of any security. Every effort is made to provide accurate and complete information. However, we cannot guarantee that there will be no errors. We make no claims, promises or guarantees about the accuracy, completeness, or adequacy of the contents of this commentary and expressly disclaim liability for errors and omissions in the contents of this commentary. David Chapman will always use his best efforts to ensure the accuracy and timeliness of all information. The reader assumes all risk when trading in securities and David Chapman advises consulting a licensed professional financial advisor or portfolio manager such as Enriched Investing Incorporated before proceeding with any trade or idea presented in this newsletter. David Chapman may own shares in companies mentioned in this newsletter. Before making an investment, prospective investors should review each security’s offering documents which summarize the objectives, fees, expenses and associated risks. David Chapman shares his ideas and opinions for informational and educational purposes only and expects the reader to perform due diligence before considering a position in any security. That includes consulting with your own licensed professional financial advisor such as Enriched Investing Incorporated. Performance is not guaranteed, values change frequently, and past performance may not be repeated.


El Dorado Raises $9M to Expand Cross-Border Fintech Platform
El Dorado, a Latin American fintech improving cross-border financial services, raised a $9 million Series A led by Paradigm with...


Bitcoin Stalls Near $60K as Strategy Moves, ETFs Outflow, and EU MiCA Rules Take Effect
Bitcoin hovers near $60,000 with ETF outflows, while Strategy boosts reserves, sells BTC, and raises dividends to reassure investors. Ethereum...


Cannabis Dominates Global Drug Use: Trends, Risks, and Shifting Markets
Cannabis remains the world’s most widely used illicit drug, with 256 million users in 2024, surpassing all others combined. Growth...


Italy Approves First Hydrogen-Powered Train for National Rail Network
ANSFISA has approved Italy’s first hydrogen-powered train, the Alstom HMU214, for use on the Brescia–Iseo–Edolo line. Capable of 140 km/h,...


Cotton Market Weakness Persists Despite Brief Rebound
Cotton prices fell to new lows last week before a modest rebound. USDA data shows crop conditions remain worse than...
 |
|
 |  |
 |
|
-

 Africa2 weeks ago
Egypt’s Net Foreign Assets Rise as External Position Continues Gradual Strengthening
-

 Markets2 days ago
Oil Surges on U.S.–Iran Tensions as Global Markets Show Diverging Trends and Rising Risk Fears
-

 Markets1 week ago
Cocoa Market Faces Mixed Trends Amid Rising Supply and Weak Demand
-

 Africa6 days ago
Bank of Africa Expands Sino-African Trade Partnerships in Beijing