Featured
Why the injection of liquidity is weighing the market down
Most blue-chip companies trading on Wall Street have assumed massive debts (post 2007-09 market crash) to fund their share buybacks and dividend programs. Because of this, I can see circumstances arrive where these companies will have to cut their dividends down to almost zero as once mighty, but now humbled General Electric did recently, to free up cash to service their debts.
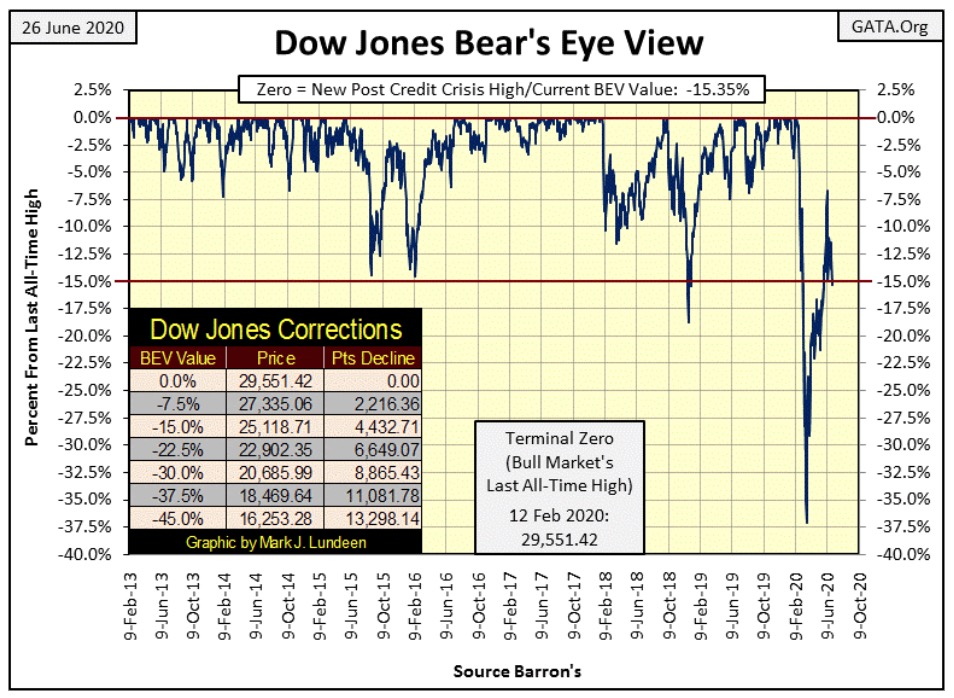
This week the Dow Jones broke below its BEV -15% line, something not seen since May 27th when the Dow Jones broke above this critical level. Looking at the advance of the Dow Jones’ BEV -37% level since March 23rd, a correction in this advance may be warranted, so maybe this isn’t the end of the world for the bulls.
What I’m going to do is look at the next five BEV points; whether the “policy makers” can drag the Dow Jones back above its -10% line, or if Mr Bear can claw the Dow Jones back below its -20% line.
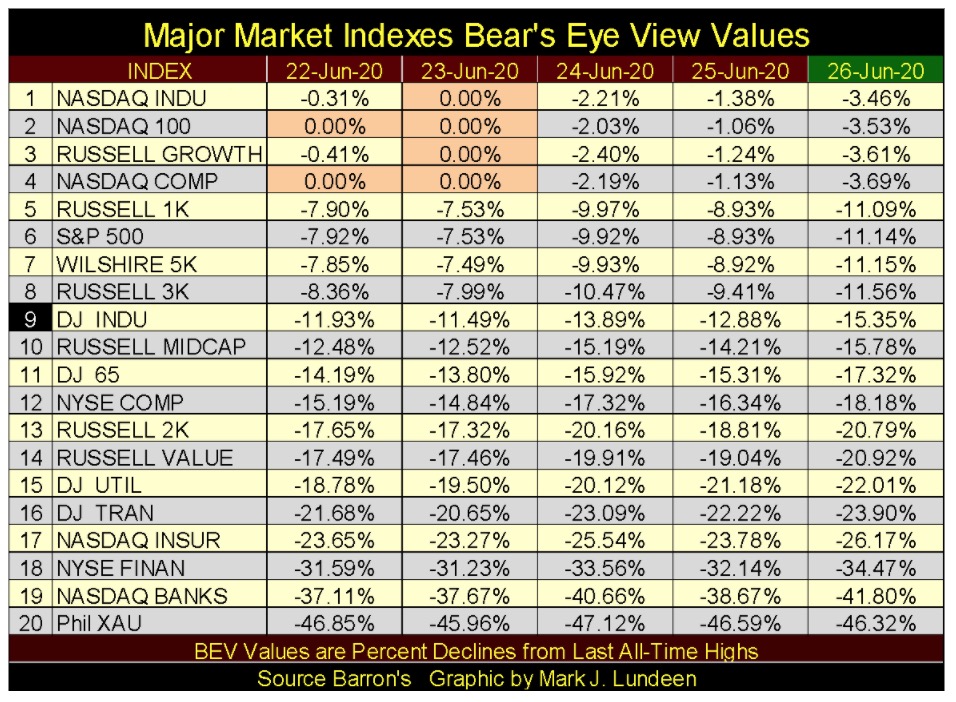
Looking at the major market indexes I follow below, on Monday and Tuesday, the market saw a few new BEV Zeros. But these advances into market history didn’t last long as Wednesday was a Dow Jones day of extreme volatility, a Dow Jones 2% day, and all the indexes below declined by 2% or more. Friday (also a Dow Jones 2% Day) was a repeat of Wednesday’s market action.
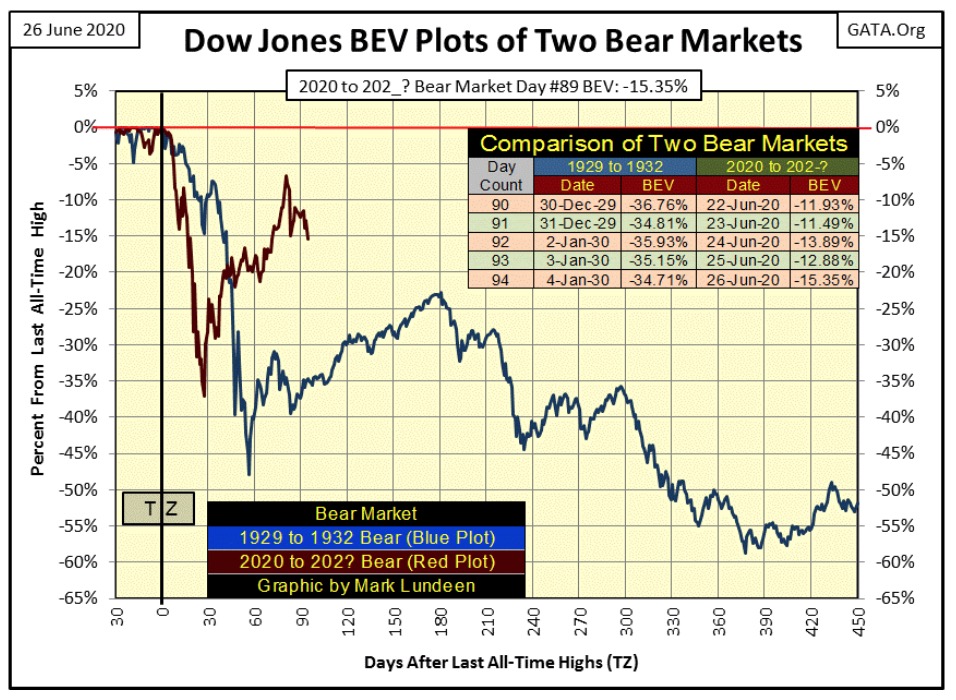
Below, our bear market correction (Red Plot) had peaked on day #80 at a BEV of -6.7%. Three days later (day #83) the Dow Jones bounced off its BEV -15% line when it closed at -14.97%. On the advance of its BEV -15% line, the Dow Jones failed to break into single-digit BEV points, and now at week’s end the Dow Jones fell below its BEV -15% line, closing at -15.35%.
This is a tedious way of stating since day #80, the Dow Jones has formed a bearish series of lower highs and lower lows in its BEV plot below. If the Dow Jones continues showing weakness in the weeks to come, it would strengthen the argument that the advance of its BEV -37% low of March 23rd is only a dead-cat bounce. In other words: the ultimate lows of this market decline are still to be seen.
That’s how I see this market. But should the Dow Jones go on to new BEV Zeros from here I could live with that too, as this is a horse race I’m not waging my money on. The stock market today is best seen as a spectator sport.
Why is that? The stock market is only rising because the FOMC is flooding the financial system with “liquidity” at a time when the internal damage to the private economy by the CCP virus pandemic is still unknown, and that damage could be considerable. The potential damage to corporate earnings has yet to be realized.
Does President Trump intend to send a second check out to everybody as a means to “stimulate the economy”, and yes help people too?
https://www.cnbc.com/2020/05/22/coronavirus-stimulus-trump-wants-to-send-out-more-relief-money.html
This CNBC story is a month old, but this week I heard it again somewhere, so maybe there is something to it.
I don’t approve of this. But how many times in my life has the Federal Government or an agency of their creation bailed out Wall Street while doing nothing for individuals? Looking at it this way, if they are going to trash the dollar I’m willing to do my part in the dirty deed. Actually I insist, and I’m quite willing to take on as much “liquidity” they are willing to “inject” into my bank account, because it isn’t right to leave all the heavy lifting out of our economic malaise to Wall Street alone.
Looking at the Dow Jones in daily bars below, this was not a good week for the Dow Jones. Closing the week at 25,000; the question in my mind is what’s next? Dow Jones closing above 26,000 or below 24,000?
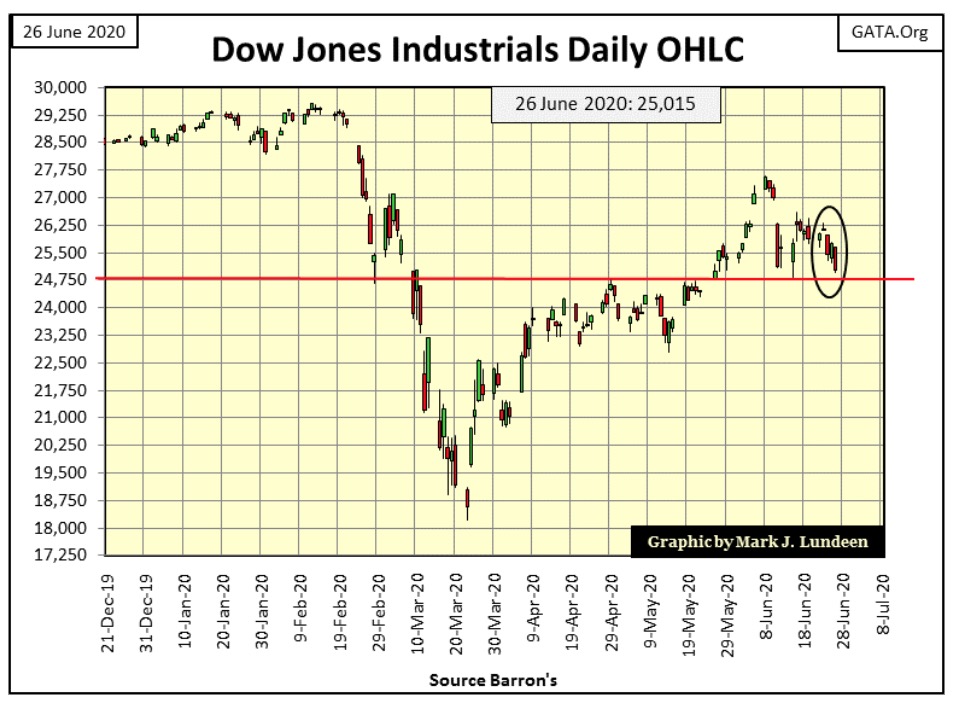
Maybe to best answer that question is to ask ourselves whether the stock market is still seeing extreme days:
- Dow Jones 2% Days / Days of Extreme Market Volatility
- NYSE 70% A-D Days / Days of Extreme Market Breadth
And as seen in Mr Bear’s Report Card below, yes it is. This past week we’ve seen two Dow Jones 2% days and one NYSE 70% A-D day. I’m not surprised the Dow Jones closed on Friday below its BEV -15% level for the first time in a month.
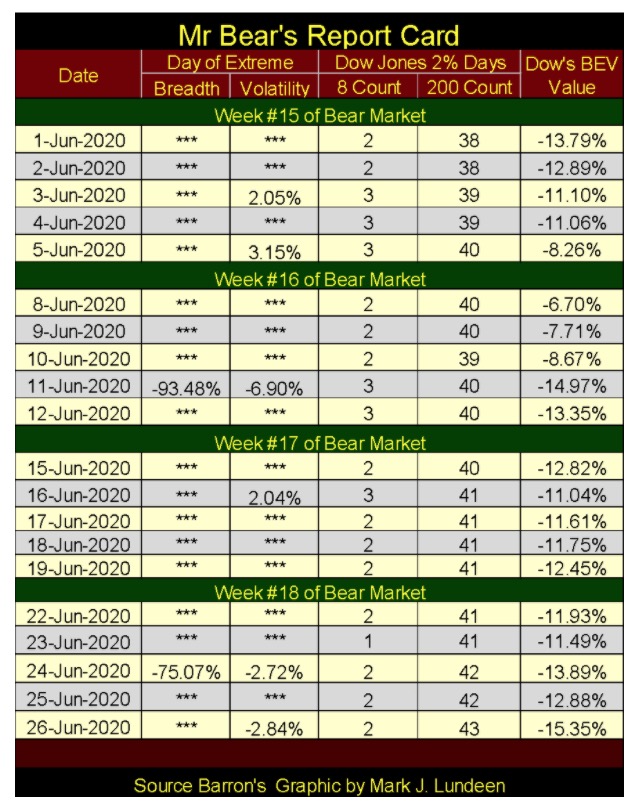
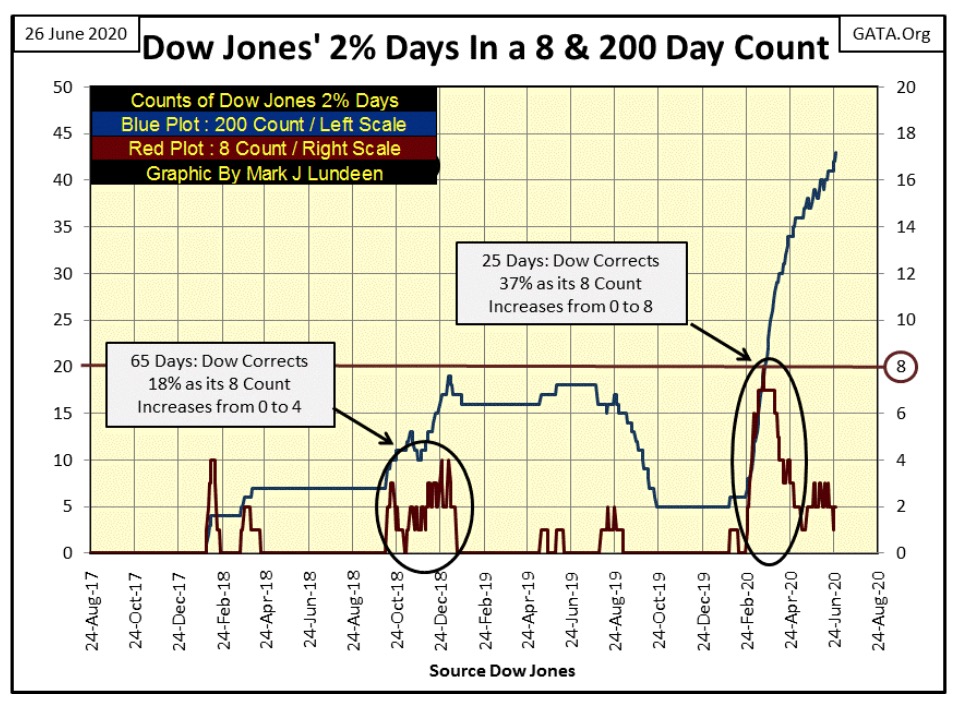
Looking at the Dow Jones’ 8 & 200 counts in Mr Bear’s Report Card above and in the chart below, market volatility continues plaguing the stock market. It’s been eighteen weeks since the 8 count saw a Zero, and each week the 200 count continues rising. THIS IS BIG BEAR MARKET ACTION.
The next few weeks will be important. If the bulls are going to drive the Dow Jones up to new all-time highs they have to break this downtrend pretty darn quick. I have this feeling the current downtrend could signal the end of the dead-cat bounce off the March 23rd lows, and where the market bottoms from there may be very ugly.
But it may take many months or even years before we see the ultimate lows of this bear market. A study of the history of the Dow Jones provides examples where the market did nothing for investors for years.
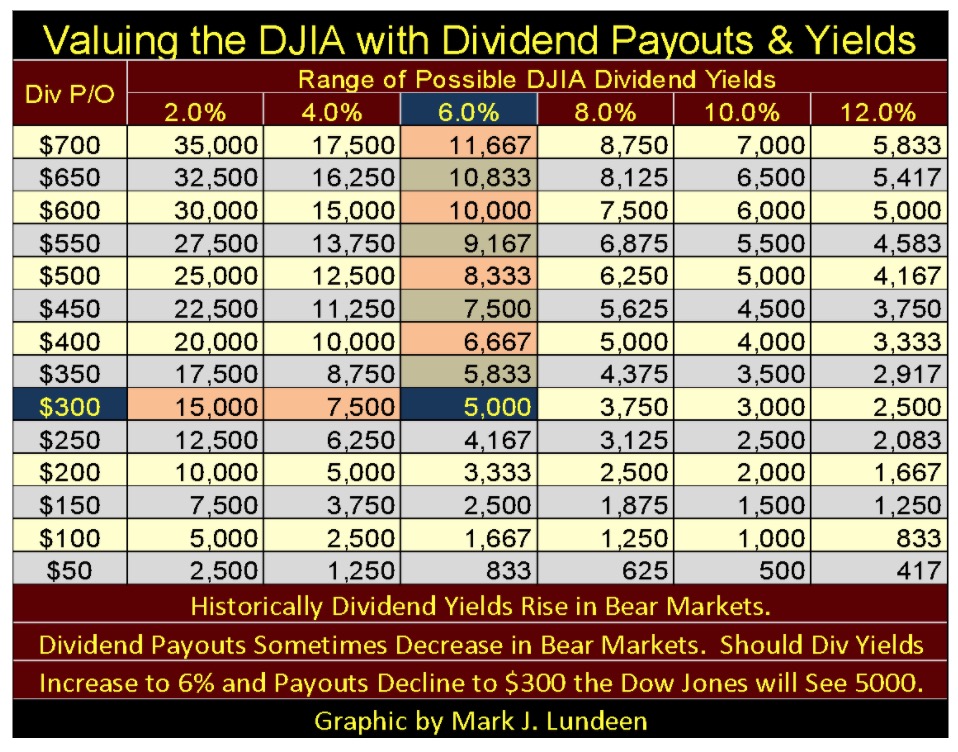
Looking at the Dow Jones in terms of its dividends, as market watchers did many decades ago, a huge bear market bottom should be anticipated.
Currently, the Dow Jones is paying out $655 and yielding 2.62%. Should dividend payouts be reduced by 54% to $300, and yield increased to 6%, both modifications well within historic parameters, that fixes the Dow Jones at 5000 in the table below; an 83% market decline from our last all-time high of 29,551 seen just last February.
Is this possible? It sure doesn’t seem likely at the close of this week, but the “policy makers” are still in control of the financial markets. When market events overwhelm their best efforts to control them, most likely seen in defaults in the debt markets, or liquidity issues in the banking system, market sentiment could turn sour very fast, and that isn’t good in an overvalued market such as ours.
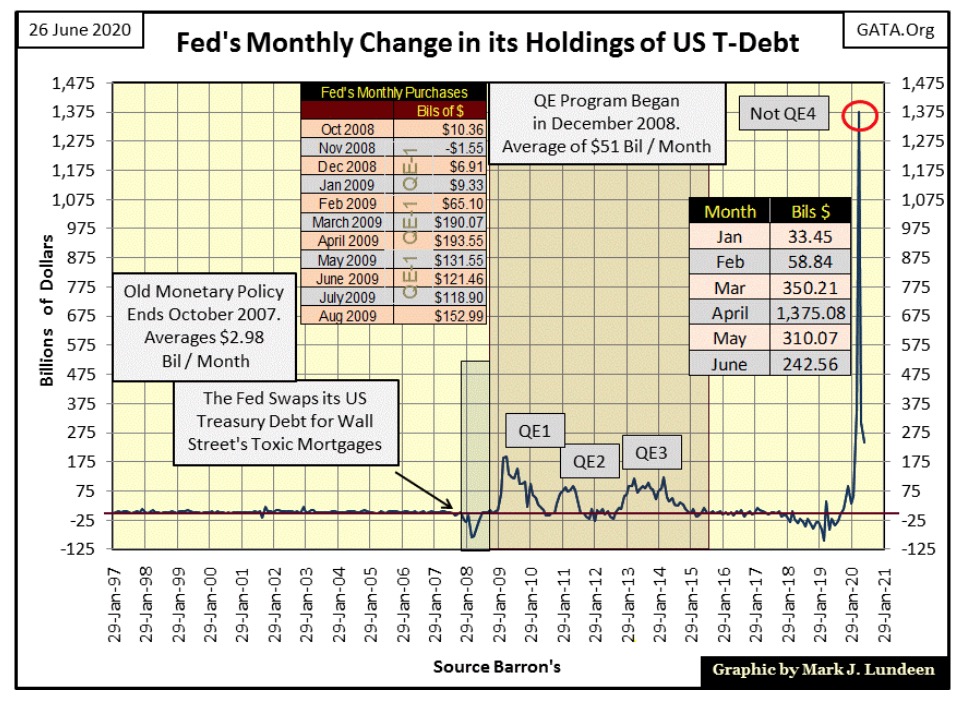
And exactly what are the “policy makers” best efforts? They can be seen below in their monthly changes in their holdings of US Treasury debt. Keep in mind Federal Reserve Chairman Powell’s “Not QE-4” didn’t begin last February, but last October; months before the Dow Jones’ February market top.
Compare these massive “injections” of “liquidity” of April 2020’s Not QE-4 with those of April 2009 for QE-1:
- April 2009: $193.55 billion
- April 2020: $1,375.08 billion
Today all may seem “normal” in the financial markets; but it’s not. And all these Not QE-4’s “injection of liquidity” seen below only create more unsustainable debt burdens weighing down the economy, if not producing new all-time highs for the Dow Jones.
The day is coming when earnings and dividend payouts for the Dow Jones are going to crash, and the effects of that can be seen in the table above where the Dow Jones is valued by its dividends. An 83% market decline may prove to be wildly optimistic.
Most blue-chip companies trading on Wall Street have assumed massive debts (post 2007-09 market crash) to fund their share buybacks and dividend programs. Because of this, I can see circumstances arrive where these companies will have to cut their dividends down to almost zero as once mighty, but now humbled General Electric did recently, to free up cash to service their debts.
Viewing the market from the perspective of oppressive debt burden; until the shackles of debt that currently weighs on business, government and the consumers are lifted, the markets will never far from a crisis.
So, what is there to do in a world such as ours? Find an undervalued asset that is free from counter-party risk; such as gold and silver bullion.
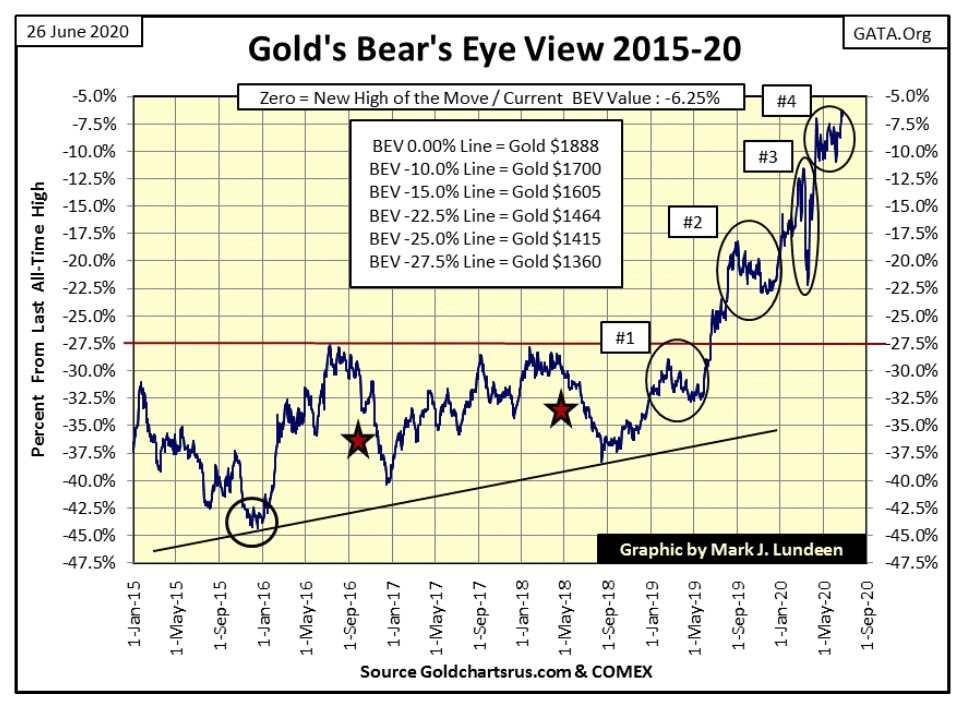
In gold’s BEV chart below we see gold closed the week at a post December 2015 high (BEV -6.27% / $1770). What’s next? Will gold break boldly out of circle #4 which has contained it since April? Maybe. No matter, the gains gold has made since last summer, where since 2013 it couldn’t break above and stay above its BEV -27.5% line ($1360) for six years, has proven gold has resumed its long delayed bull market advance.
That almost no one realizes this yet only proves this advance is still in its early stages, and that is always the best time to buy into any bull market. Unfortunately, history shows the public has a propensity to risk their money in bull markets during their late-terminal stage, such as the Dow Jones is seeing now.
With the Silver to Gold Ratio (SGR) below closing the week at 99.43 ounces of silver for one ounce of gold, silver still lags gold as June 2020 comes to an end. As things become exciting in the old monetary metals market, the SGR will once again approach its 40 line, as silver outperforms gold in their bull markets.
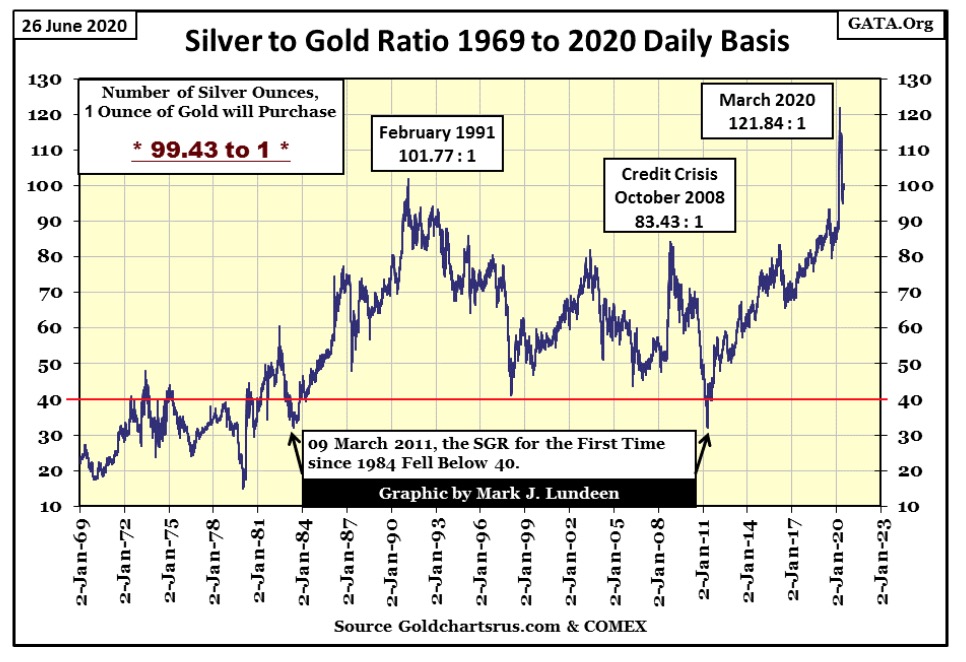
This decline in the SGR towards the 40 line may not be an orderly decline; one that takes many months or years to accomplish should the “policy makers” lose control over the financial markets and can no longer suppress bond yields and interest rates at their current artificial lows.
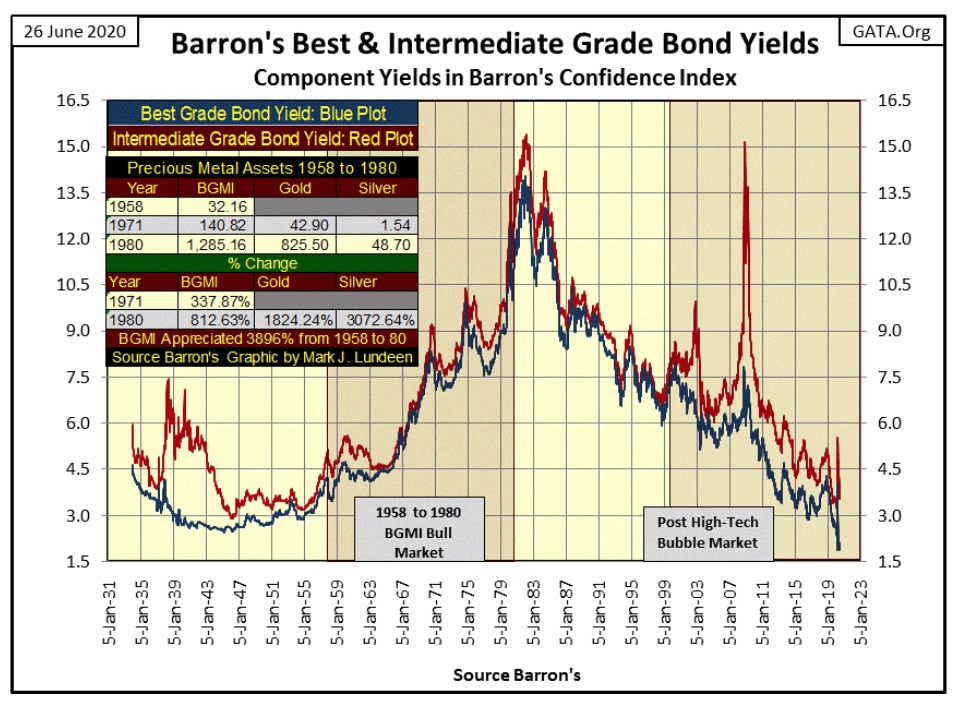
In the chart below, rising bond yields was one of the hall marks of the 1969 to 1980 bull market in gold and silver, and that can be pushed back to 1958 for the Barron’s Gold Mining Index (BGMI). When yields and rates once again begin to rise, realize there is an unknown threshold where once crossed all hell will break loose in the financial markets. That can only be positive for gold, silver and precious metal miners.
Note the spike in yields below just this March. The “policy makers” almost lost it as the Dow Jones saw a 37% market decline in only 25 NYSE trading sessions. Don’t think these guys are invincible. Mr Bear’s day of judgement is coming for them and they know it.
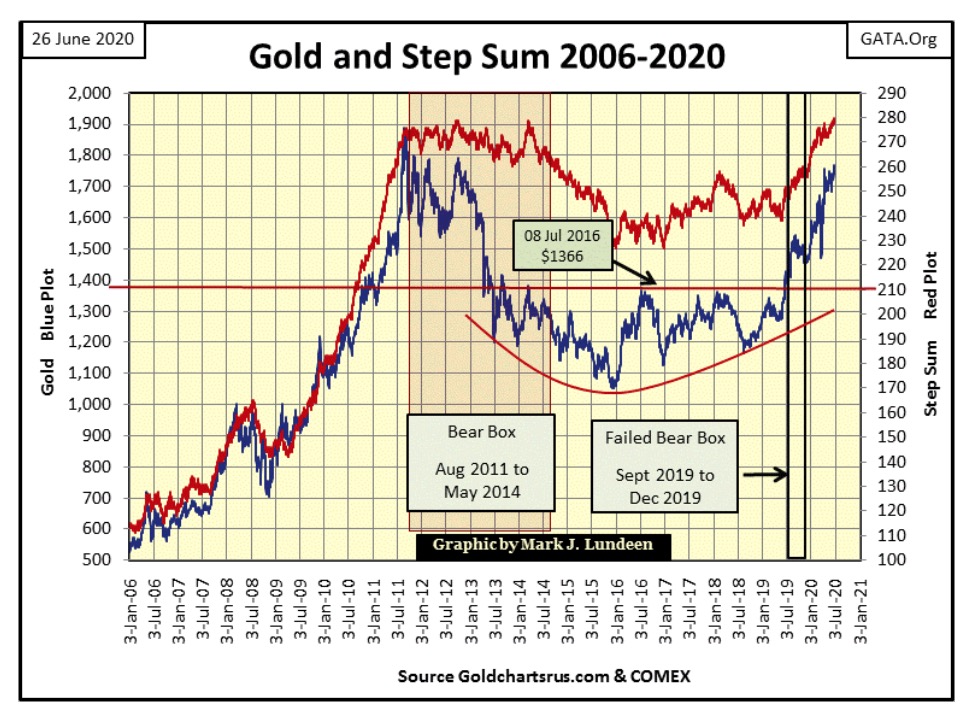
Not so obvious in gold’s step sum chart below, but the price of gold (Blue Plot / Market Reality) is once again in sync with gold’s advancing step sum (Red Plot / Market Sentiment). This is a very positive development in the gold and silver market.
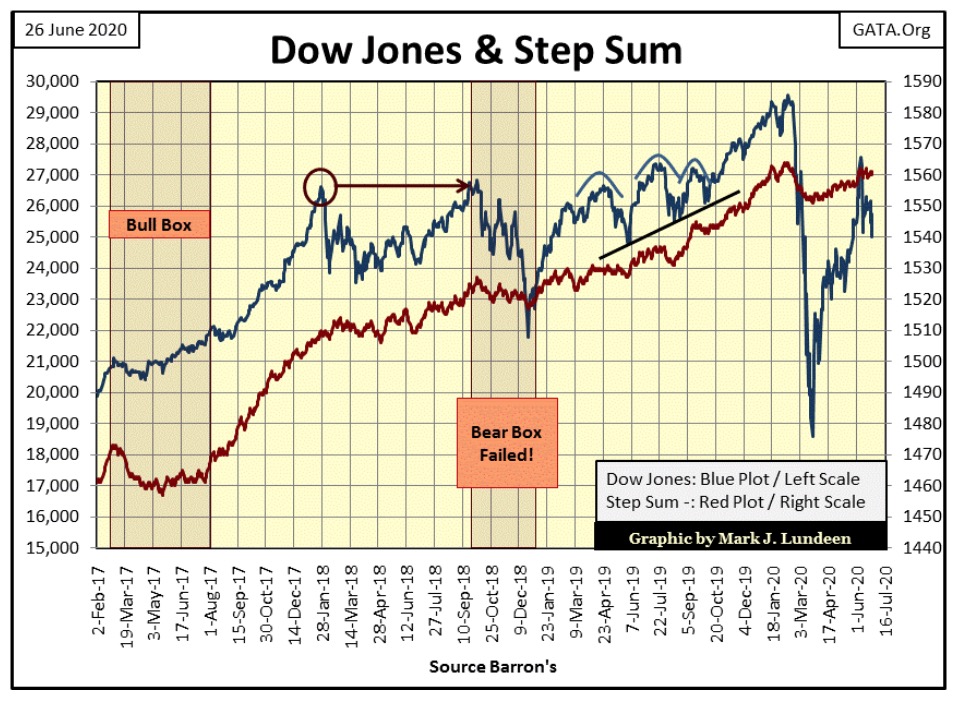
For the Dow Jones and its step sum, the Dow Jones peaked at 27,572 on June 8th, the same day its step sum peaked at 1562. For the past three weeks the Dow Jones has been unable to exceed these values, and now at the close of this week it almost closed below 25,000. The more I look at this chart, the weaker it looks. If the bulls don’t reverse these trends soon, we may see some excitement to the downside in the next few weeks.
Moving on to gold’s step sum table below, gold’s step sum continues trending higher taking the price of gold with it. Seeing its daily volatility’s 200 day moving average actually declining these past twenty-five trading sessions tells us the gold market is advancing as the world ignores its gains.
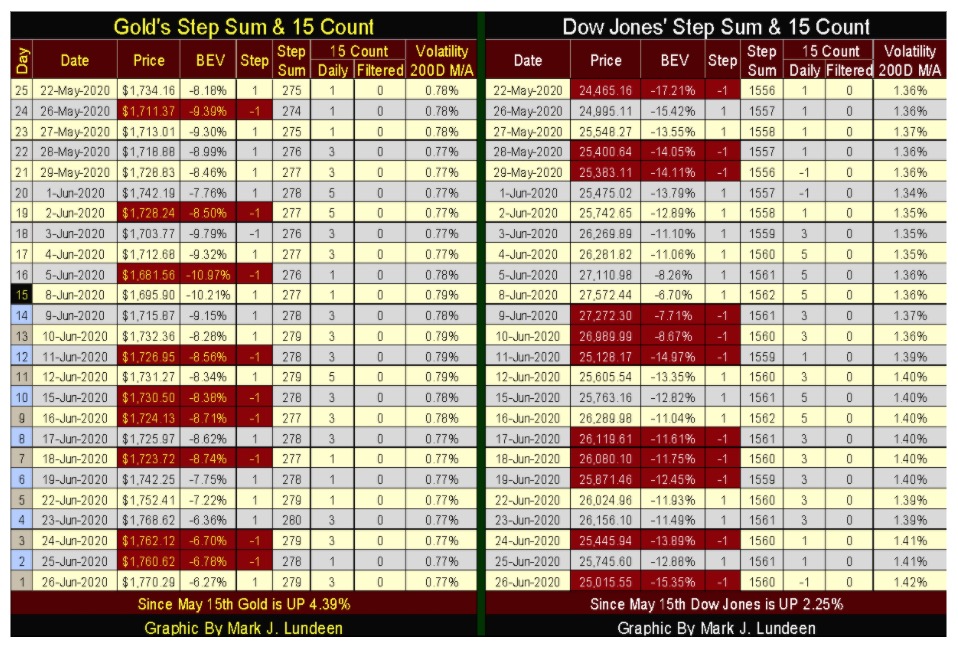
For the Dow Jones’ step sum table, look at June 8th’ BEV of -6.70%. That was the top of the Dow Jones’ advance off its March 23rd lows, as its step sum hit 1562. As seen in the Dow’s step sum chart above, these values have yet to be exceeded. But if the Dow Jones is to continue the advance off its March 23rd bottom, they must be exceeded.
Also, it was on June 8th where the Dow Jones’ daily volatility’s 200 day moving average began its break above 1.36%, up to 1.42% at Friday’s close. Rising volatility, like a fever is never good for the Dow Jones’ long term health. So you bulls out there; keep your eyes open for those dreaded Dow Jones 2% days in the weeks to come.
I like following the market. It’s a hobby of mine I enjoy sharing with my readers.
An old shipmate of mine who passed away long ago once told me one can’t claim they know something about anything unless they could write about it. In other words; talk is cheap, while writing requires effort to say exactly what one wants to.
So I ask myself, for who am I writing these weekly market commentaries for: my readers or for myself? I think both, but I get more by writing them than my readers do from just reading them.
Another thing I like sharing with my readers is insights of abusive behavior I see by our political and cultural establishment. There are many of them, but the biggest of these abuses is what is called “science.” “Science” we are told is the search for truth in our world. But actually “science” today searches for government funding, and scientists will do or say what they must to lock in their grants.
“Science” was at work during the coronavirus (aka CCP virus) listing deaths due to this, that and other thing as CCP virus related to increase the death count to allow politicians to enact drastic regulations. At no other time in human history that I’m aware of was a quarantine imposed on healthy people – what? Hey, it’s okay as “science” demanded that we all self-isolate ourselves and wear a medical mask.
What a joke! Veterans of the armed services have all taken part in biological warfare drills and have been drilled in knowing how to stop airborne biological agents. In boot camp service members are exposed to teargas with and without a gas mask and realize how totally worthless that stupid paper mask everyone is wearing is.
So why is Los Angeles, California imposing mandatory mask requirements on its population? And why is the LA Times allowing this to go unchallenged in the article below? Because the mainstream media outlets, such as the LA Times are a part of the “science” scam foisted upon a gullible public.
If you believe wearing a paper mask will protect you and those around you from an airborne virus; go right ahead and wear one. But I don’t care what “science” says: mandating the general population must wear these ill-fitting paper masks will have negligible effects on mitigating the impact of any airborne virus.
And as far as pandemics goes, the CCP virus has to be a huge disappointment to epidemiologists. This “pandemic” is now five months old and counting. So far unless one has health issues or infirmed by years, the CCP virus has proven to be mostly benign to healthy people. So why hasn’t “science” spoken the truth of this instead of advocating the universal wearing of stupid-paper masks and inciting fear about a pending second stage in the “pandemic?”
Because there is much money to be made in promoting this fear. Not that you would read about this in the LA Times.
Here’s a Fox Business article that is telling the public the truth.
“While most Americans have been preoccupied with protests and pandemics, a potentially bigger story has managed to slip beneath the radar: a growing movement among the world’s most powerful leaders to call for a “reset” of the entire global economy.”
https://www.foxbusiness.com/markets/al-gore-un-secretary-general-great-reset-global-capitalism
The article goes on explaining how these wealthy and influential people are planning to overhaul the global economy to make it “sustainable” and free mankind from certain disaster from “global warming.” I knew “science” would come in to this story warning us of the coming New World Order.
These people are serious; they see the necessity of reducing the footprint of mankind on planet Earth by any means necessary. This equates to the murder of billions of people. Oh yes it does! Here’s a quote from Prince Phillip, Queen Elisabeth’s Royal Consort:
“I just wonder what it would be like to be reincarnated in an animal whose species had been so reduced in numbers than it was in danger of extinction. What would be its feelings toward the human species whose population explosion had denied it somewhere to exist... I must confess that I am tempted to ask for reincarnation as a particularly deadly virus.”
These people are not good people. They are people who in dark places plan bad things for all the “little people” of the world, and “science” is but one of their tools.
I’ll tell you where else you could learn of this pending global dictatorship. The prophets from the Bible’s Old Testament and in the New Testament’s Book of Revelation warned us of this thousands of years ago.
In the years to come you can make more money than you believe possible today. But money won’t save you should these horrible people establish their global financial and political system.
Now, not tomorrow is the time go get right with God.
—
(Featured image by coloringcuties via Pixabay)
DISCLAIMER: This article was written by a third party contributor and does not reflect the opinion of Born2Invest, its management, staff or its associates. Please review our disclaimer for more information.
This article may include forward-looking statements. These forward-looking statements generally are identified by the words “believe,” “project,” “estimate,” “become,” “plan,” “will,” and similar expressions. These forward-looking statements involve known and unknown risks as well as uncertainties, including those discussed in the following cautionary statements and elsewhere in this article and on this site. Although the Company may believe that its expectations are based on reasonable assumptions, the actual results that the Company may achieve may differ materially from any forward-looking statements, which reflect the opinions of the management of the Company only as of the date hereof. Additionally, please make sure to read these important disclosures.


Bitcoin Stalls Near $60K as Strategy Moves, ETFs Outflow, and EU MiCA Rules Take Effect
Bitcoin hovers near $60,000 with ETF outflows, while Strategy boosts reserves, sells BTC, and raises dividends to reassure investors. Ethereum...


Cannabis Dominates Global Drug Use: Trends, Risks, and Shifting Markets
Cannabis remains the world’s most widely used illicit drug, with 256 million users in 2024, surpassing all others combined. Growth...


Italy Approves First Hydrogen-Powered Train for National Rail Network
ANSFISA has approved Italy’s first hydrogen-powered train, the Alstom HMU214, for use on the Brescia–Iseo–Edolo line. Capable of 140 km/h,...


Cotton Market Weakness Persists Despite Brief Rebound
Cotton prices fell to new lows last week before a modest rebound. USDA data shows crop conditions remain worse than...


Eli Lilly Hits $1 Trillion Valuation Amid Strong Bullish Momentum
Eli Lilly stock hit a record high, surpassing $1 trillion market value after strong product demand. Shares surged over 7%,...
 |
|
 |  |
 |
|
-

 Impact Investing2 weeks ago
AI Adoption in Italian Retail Stalls Despite Strong Experimentation
-
 Cannabis20 hours ago
Cannabis Dominates Global Drug Use: Trends, Risks, and Shifting Markets
-

 Impact Investing7 days ago
EU Weighs More Free Emission Permits in ETS Review to Boost Industry Competitiveness
-

 Impact Investing2 weeks ago
SBTi Net-Zero Standard 2.0 Enhances Corporate Climate Action