Markets
Are Interest Rates to Rise or Fall?
The Dow Jones remains in a bullish position, continuing its advance from November. However, its recent performance has slowed, with only five new all-time highs since late winter. Despite potential support at 38,000, uncertainty looms. This ongoing bull market, fueled by Federal Reserve liquidity, suggests a massive bear market ahead. Caution is advised.
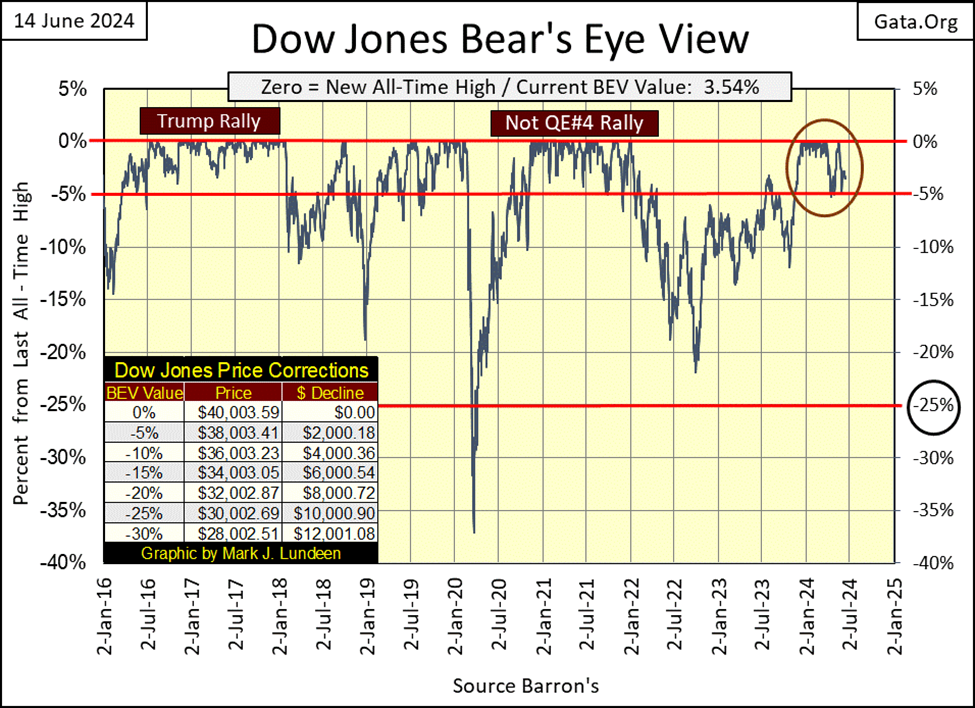
Interest rates in our focus this week. But first, what’s to say about the Dow Jones at this week’s close? It is still in scoring position in its Bear’s Eye View chart below. For that reason, it’s best assuming the advance that began last November, when the Dow Jones first closed in scoring position (inside of circle), continues.
Looking at the market action inside the circle, the Dow Jones was making new all-time highs (0% = BEV Zeros) fast and furiously from December 13th to February 23rd, twenty-one of them. Things have slowed down since late winter, with only five additional BEV Zeros since then, for a total of twenty-six so far in this advance.
Just keep in mind, things will change in the market, and it’s hard predicting the future. Maybe, the next big thing for the Dow Jones will be a new surge of BEV Zeros in its BEV chart below. Then maybe, twenty-six BEV Zeros is all this advance is good for.
So, what do I think will happen next? I don’t know. What I do know is; for as long as the Dow Jones closes daily inside of scoring position in its BEV chart below (-0.01% to -4.99%), its best assuming the advance that began last November will continue.
That’s my story, and I’m sticking to it. That plus until the Dow Jones closes below its BEV -10% line, or maybe just its BEV -7% line, I’ll remain short-term bullish on the stock market.
Keep in mind, this bull market in the Dow Jones began in August 1982, when it last closed below 800. Forty-two years later, it has broken above 40,000.
This has been a massive bull market, fueled by an ocean of “liquidity” flowing from the Federal Reserve System. For that reason, expecting the following bear market will be just as massive is a logical assumption.
And why would that be? Because; “liquidity” flowing from the Federal Reserve = someone, or something is taking on debt, debt that must be serviced. The ability of the Federal Reserve to pump their “liquidity” into the economy is infinite, unlimited, as they can issue as many dollars of debt, as there are stars in the universe, effortlessly. But for those assuming that debt, their ability to service that debt is not infinite. Once interest and principal payments exceed income, debt becomes a big problem.
There is a limit to how much debt a consumer, corporation, the government, or an entire economy can service. When an economic entity assumes more debt than they can service, they will default on that debt. Think of bull markets as when the idiots at the FOMC are pumping “liquidity” into the economy, and everyone is taking on debt, and it feels great. Now think of bear markets happening, when the economy (and banking system) discovers it is overwhelmed by servicing this debt, and debt defaults now become the thing driving the economy, and markets downward.
Exiting any bull market within 10% of its absolute top, thus keeping most of your profits, especially for this bull market, would be no small accomplishment for either retail investors, or managed-money professionals. If history is any guide, and it usually is, this is something most people in the market will not be able to do.
That is a shame, as to do exactly that, one only has to exit the market should (when) the Dow Jones closes below its BEV -10% line in its BEV chart above, or 36,000 in the daily bar chart below, and absolutely refuse accepting market risk (buying stocks), until the Dow Jones once again closes above its BEV -5% line (38,000). In other words, at a market top; stay in scoring position, or stay out of the market.
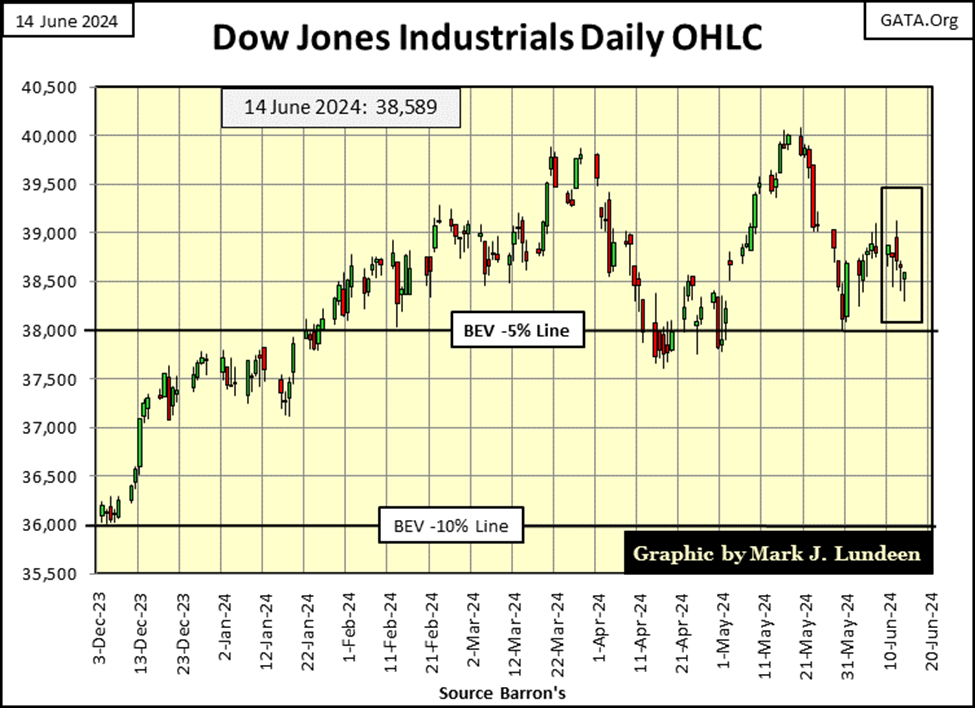
Looking at the Dow Jones in daily bars below, things look a bit more bearish than in its BEV chart above. Two weeks ago, the Dow Jones bounced off its BEV -5% line, then saw a nice gain in the following week. This week, it appears the Dow Jones is once again going to test its BEV -5% line, 38,000 in the weeks to come.
Will 38,000 once again be a level-of-support for the Dow Jones, as it was last April. Or this time, will the Dow Jones fall below 38,000 and keep going down? Before we begin thinking too hard about the Dow Jones rising to new all-time highs, above 40,003, lets see what it first does with 38,000 in the weeks to come. Pondering this situation, next week should be very interesting.
Moving on to my table of major market indexes BEV values below, the stock market at first glance was bullish this week, as seen with all those BEV Zeros in the table. But at the week’s close, the market ended on the weak side, with only three indexes closing with BEV Zeros on Friday. I placed a red box over the indexes closing the week in scoring position. On Friday’s close, the Russell Midcap (#13) and NASDAQ Insurance indexes (#14) were knocked out of scoring position. Not good, but not something to panic about.
If you look at the daily BEV values for these indexes, except for the top three, who saw nothing but new all-time highs all this week, all the other indexes declined from Monday to Friday’s close. This is something to keep an eye on, as this is exactly how a market would top out, if in fact the market is now topping out. But that is something we can’t yet assume.
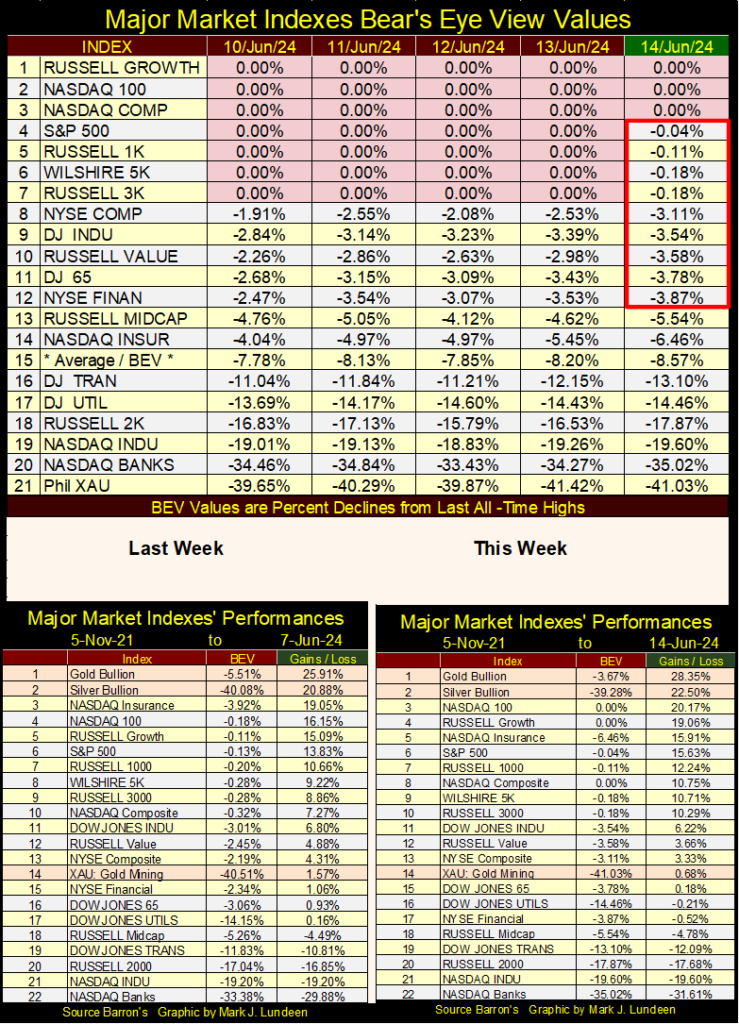
In the performance tables above, gold and silver kept their #1 & 2 positions, and were up nicely for the week. The XAU, the gold miners were down slightly since last week. In a world plagued with problems spanning from massive monetary inflation, to the US and its toadies in NATO, doing everything possible to provoke nuclear war with Russia, one would think the XAU, as well as gold and silver would be multiples higher than they closed at week’s end.
So, why aren’t they? Most likely it’s a “policy thing.”
This week, the FOMC are holding off on lowering interest rates, see below.
I used to read these FOMC press releases published in the media with some interest, of a “market expert’s” speculation of what the idiots will, or will not do. Now, as my understanding in the ways of “monetary policy” have matured, I now make graphics of these press releases, as seen below, for filler in my weekly articles. If I’m to write about the markets and economy, I have to write about something to generate some paragraphs of text for the week, and the press release below will do nicely.
Looking at the second bullet point, where we see the idiots will use a variety of economic forecasting updates — including the “central bank’s much watched dot plot of interest rate expectations.”
I have to ask myself; what in the hell is a “dot plot of interest rate expectations?” This must be a new gimmick, as it’s something I’ve not heard of before. I imagine this “dot plot” to be something like a Jackson Pollock painting, total confusion confined within the margins of the chart, which normal people would look at in awe, and stunned silence. Of course, it goes without saying the idiots at the FOMC would quickly glance at this “dot plot’s” dots, and with crystal clarity, see future trends in interest rates. Yeah sure, okay; the idiots are so smart, and I’m so dumb.
Let’s see, so far, I have two paragraphs of text commenting on this FOMC press release. I need more. Oh, here is a “fact” from its second bullet point I have to fact-check, as I’m sure this “fact” is in error. This press release states; “When it comes to interest rates, the Fed will do nothing.” It should read: “When it comes to interest rates, the Fed will do nothing constructive.”
Okay, that is paragraph number three.
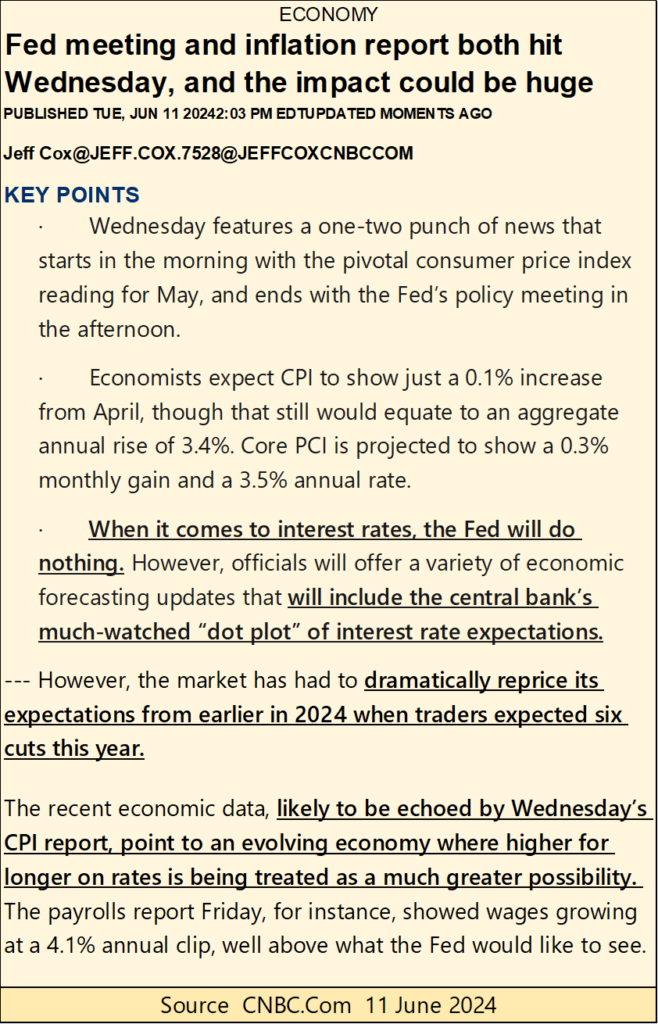
Do you want more commentary on this FOMC press release? Okay, it says at the bottom that wages are rising at a 4.1% annual clip, well above what the Fed would like to see. No need to fact-check that absolute truth!
- BUT, * and it’s a Big But, the entire point of employing idiots at the FOMC to inflate the money supply, is to steal from wage-earners, old people living on a fixed income, and merchants in the economy, via rising consumer prices. The less for their money, is the more for the government, banking system insiders, and their friends. If it wasn’t for central banking, where would America’s higher education system, the UN and WEF be today?
So, can you see what would be the point of having idiots going through all that trouble, just to then have wages keep up with rising consumer prices?
That isn’t going to happen. The “policy makers” are ripping you off, get used to it!
So, why are the idiots struggling with deciding to hold, or lower interest rates? I think a chart of the yield curve will help clarify their predicament. Since December (Red Plot below), bond yields have risen slightly, to where they were at the close of this week (Green Plot), with the FOMC’s Fed Funds rate being nailed on the yield curve, at 5.33% since last summer.
With the Fed Funds Rate fixed at 5.33%, as bond yields rise, the yield curve flattens as seen below, “monetary policy” becomes looser, more accommodating to “economic growth,” which by the FOMC’s Keynesian world’s view, is “inflationary.” To lower rates (the Fed Funds Rate) under the rising bond yields seen below, only makes their hobgoblin of CPI inflation, even more terrifying to them.
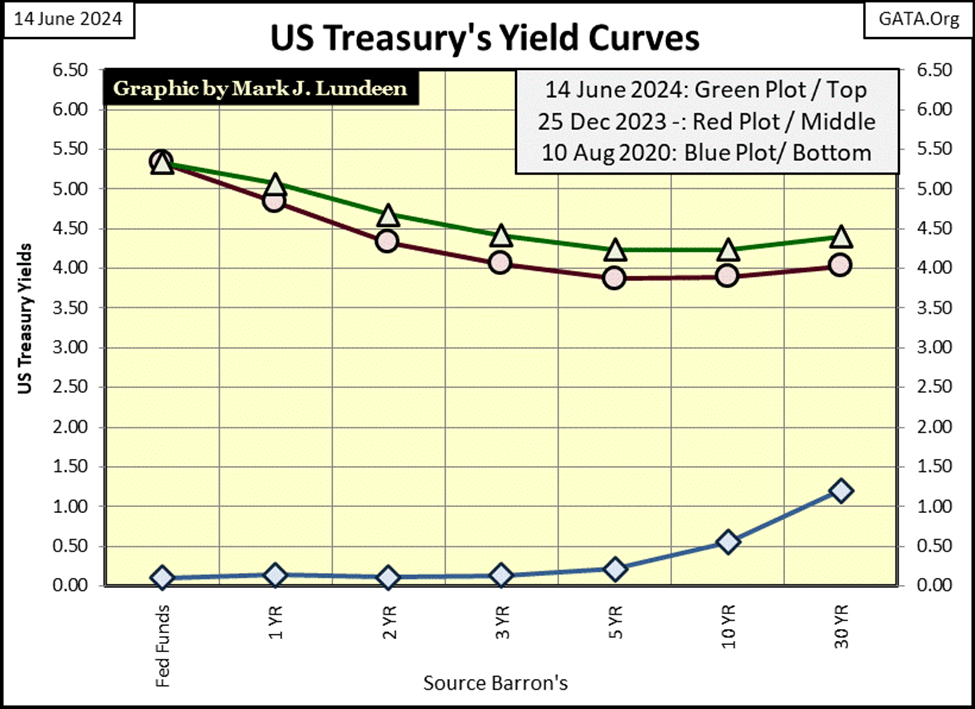
Looking at the chart above, I’m thinking the FOMC will do nothing until after the November election, hoping these T-bond yields hold where they are, or begin to decline.
After the November elections, especially if Trump wins, I expect the next big thing in “monetary policy” will be the FOMC increasing short-term rates; raise their Fed Funds Rate to something above 6% to maintain a “tight monetary policy” to fight “inflation.” That could crash the markets, and send the economy into a tailspin. But these people don’t care for Trump, any more than they care for you and me.
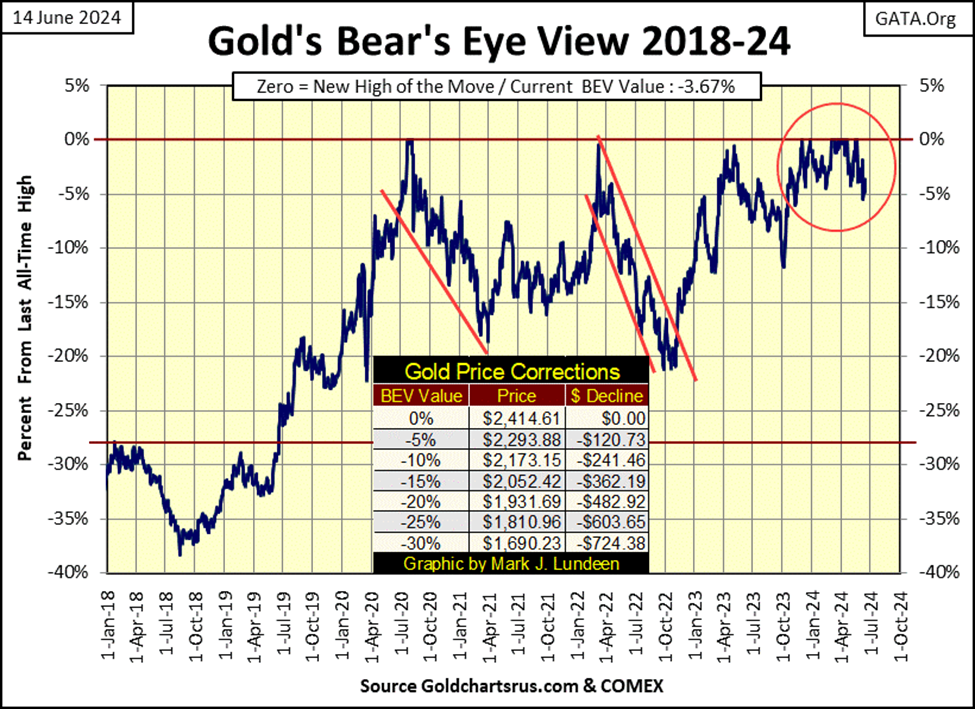
Let’s look at gold’s BEV chart. Like the Dow Jones, since November it has stubbornly refused to stray far from scoring position, making twenty-three new all-time highs in this advance. This is a string of new all-time highs not seen since August 2011, a fact to take note of, that possibly something fundamental in the gold market has changed.
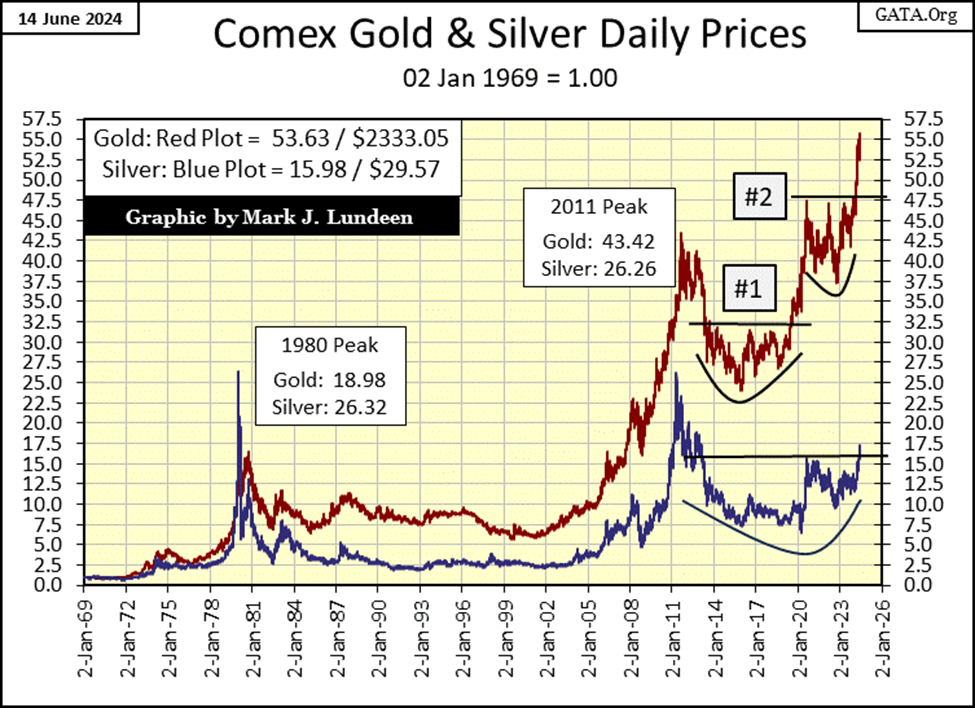
In the gold and silver’s indexed values seen below, it’s been very boring for the past few weeks, as gold and silver take a pause after breaking out of their bowl and break out patterns.
Moving on to gold’s step sum table below, I note how gold last Friday closed BELOW scoring position with a BEV of -5.51%, but bounced back this week, closing the week with a BEV of -3.67%. That is good market action, reason to believe gold wants to rise to new all-time highs in the near-term future. I’m also noting how gold’s daily volatility’s 200D M/A closed the week at 0.65%, up nicely from 0.58% on May 10th. Bull markets in gold and silver are exciting markets, rising daily volatility indicates things are becoming exciting.
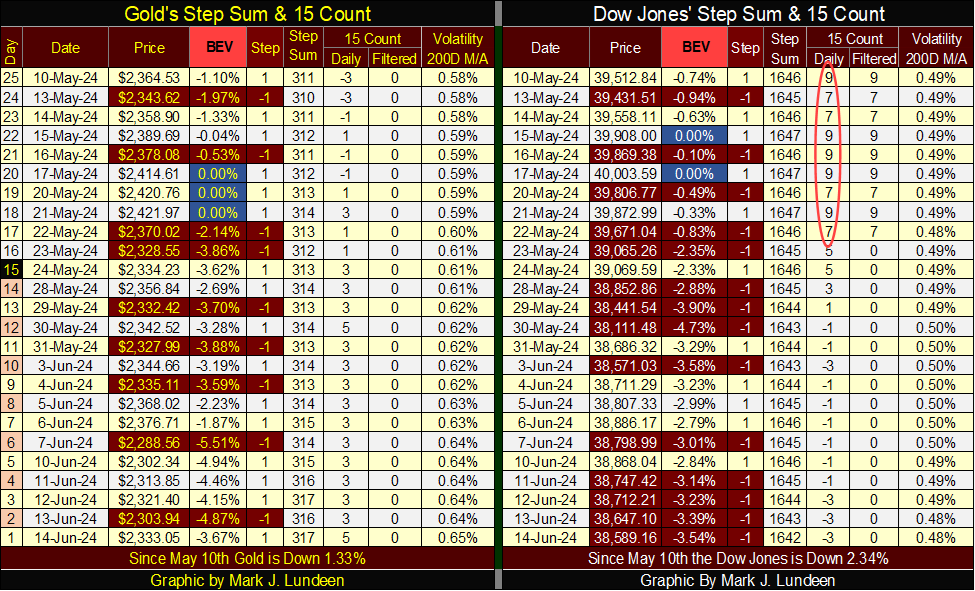
On to the Dow Jones side of the table, since its last all-time high on May 17th, when the Dow Jones had a 15-count of +9, making the Dow Jones a very overbought market, the Dow Jones has been overwhelmed by down days. I expected that. With a 15-count of +9, the Dow Jones was very overbought, and markets don’t like being very overbought, and tend to sell off, as we see above.
But, after all those red down days for the Dow Jones, looking at its BEV value on Friday, we see the Dow Jones is down only 3.54% from its last all-time high, which isn’t much. I’m going to take this marginal sell off in the Dow Jones as a sign of market strength. In the weeks to come, once again the Dow Jones will see daily advances overwhelm daily declines. For the bulls out there, its important the Dow Jones makes a few new BEV Zero when it does.
__
(Featured image by Annie Spratt via Unsplash)
DISCLAIMER: This article was written by a third party contributor and does not reflect the opinion of Born2Invest, its management, staff or its associates. Please review our disclaimer for more information.
This article may include forward-looking statements. These forward-looking statements generally are identified by the words “believe,” “project,” “estimate,” “become,” “plan,” “will,” and similar expressions. These forward-looking statements involve known and unknown risks as well as uncertainties, including those discussed in the following cautionary statements and elsewhere in this article and on this site. Although the Company may believe that its expectations are based on reasonable assumptions, the actual results that the Company may achieve may differ materially from any forward-looking statements, which reflect the opinions of the management of the Company only as of the date hereof. Additionally, please make sure to read these important disclosures.


Augustine Raises $17 Million in a Round Co-Sponsored by Eli Lilly and Led by Asabys
Augustine Therapeutics raised 17 million euros in the first closing of a Series A round led by Asabys Partners. Eli...


PlanRadar: Digital Solutions Can Simplify the Proof of ESG Compliance
PlanRadar, a platform for digital documentation in construction, facility management, and real estate, found that only a third of industry...


US Spot Bitcoin ETFs Record $31 Million Net Inflows After Outflow Trend
US spot Bitcoin ETFs have seen a significant turnaround with net inflows of $31 million after continuous outflows. This indicates...


Nickel Is Considering Diversifying its Offer in Belgium
Nickel offers payment cards linked to a current account in Belgium without traditional banking. With 500 sales points and plans...


Brazil’s Supreme Court Decriminalizes Cannabis Possession
Brazil's Supreme Court decriminalized cannabis possession for personal use, a major shift amid longstanding debates. This decision, aimed at alleviating...
 |
|
 |  |
 |
|
-

 Markets1 week ago
Coffee Markets Decline Despite Looming Robusta Supply Shortages
-
 Fintech4 hours ago
Nickel Is Considering Diversifying its Offer in Belgium
-

 Cannabis2 weeks ago
What’s the Current Situation of the Cannabis Market in Europe
-

 Crypto6 days ago
Conservatively, This One’s a Multibagger: Oxbridge Re to Ride $10T Blackrock RWA Tokenization Boom