Featured
A Look at Gold on an Inflation-Adjusted Basis
Markets appear to be heading lower even as we are also seeing some positive divergences. Gold/silver made an interesting reversal this past week possibly signaling a low. But the gold stocks are still struggling even against the backdrop of the announced Agnico Eagle/Kirkland Gold merger. Oil and gas continue to march higher as gas keeps making fresh 52-week highs.
Mr. Mankiewicz may be right. How is one to make sense of the slowly unfolding Evergrande collapse? What sense is there in the ongoing uncivil war in the U.S. that is currently rearing its head in the debt limit fight? What about the pandemic that has ravaged the world nigh on two years now, a pandemic that now ranks as one of the worst in history? No, we are not talking about the Black Death (1347–1351, 200 million estimated deaths). But it does rank as the third-worst since the start of the 20th century, behind the Spanish Flu (1918–1920, estimated 20–50 million) and the AIDS pandemic (1981–present, estimated 25–35 million). While the official death toll is approaching 5 million, including over 700,000 in the U.S., there are estimates that suggest upwards of 15 million have died as a result of the COVID pandemic (https://www.economist.com/graphic-detail/coronavirus-excess-deaths-estimates).
Many are calling Evergrande China’s Lehman Brothers moment. But unlike Lehman, there is scant evidence to suggest that the Chinese government is trying to save Evergrande. Call it instead controlled demolition. As we know the Lehman Brothers bailout failed and panic ensued. But with Lehman, the entire U.S. and even the global financial system was at risk. So far, at least, the fallout from Evergrande has been limited. Its bonds are trading at 25–35 cents on the dollar. Numerous hedge funds and others have been snapping them up. A number of Chinese property developers are finding themselves cut off from new credit. The Chinese government has been trying to quell the speculation and bubble in their property development market for some time and concentrate on other aspects of the economy that would be more beneficial overall.
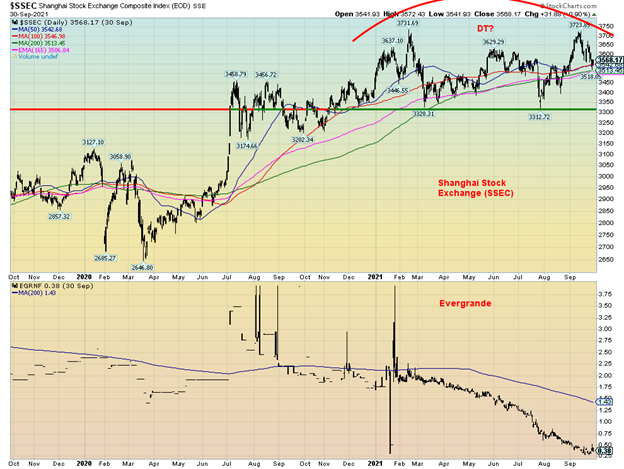
China’s stock market has been pretty lethargic in 2021. Yes, it is up about 2.5% but it is underperforming other exchanges considerably, including the MSCI World Index. The Shanghai Index (SSEC) appears to be forming a possible double top. A major breakdown under 3,300 could send the index tumbling towards potential targets near 2,900. Evergrande, on the other hand, is down roughly 80% in 2021 and over 90% from its all-time high.
China has other issues as well. China is not a major producer of semi-conductors. But Taiwan is. In the Huawei world, the U.S. has been trying to restrict China. China wants to shift the concentration of capital and production to producing more semi-conductors on its own. China is dependent on foreign energy and they import roughly 10 million bpd. Hence China’s interest in protecting Iran, a major oil producer from whom they get oil although not exclusively. And guess who has sanctions on Iran? Finally, with over $1 trillion of U.S. treasury securities and corporations with huge debts denominated in U.S. dollars, the U.S. is trying to block China’s access to U.S. funding and even lock them out of the global SWIFT system for settling U.S. dollars. This has forced China to concentrate on creating its own SWIFT and raising the yuan to the level of a global trade currency and even a reserve currency.
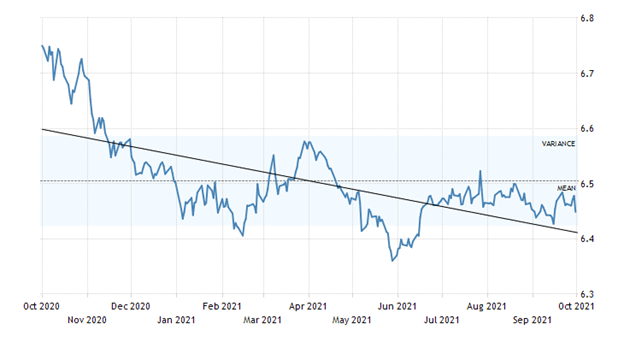
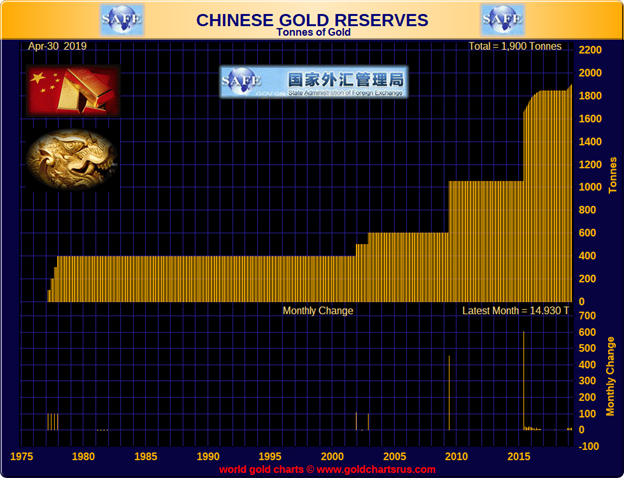
Oddly, the yuan has held up through all this turmoil in China although it is down from highs a year ago. China has helped strengthen the yuan through an ongoing program of adding to their gold reserves in lockstep with American investors building on their Goldco direct accounts. According to official figures, China is holding some 1,900 metric tonnes of gold. Official reserves have basically doubled in the past five/six years. It is suspected that actual reserves may be even higher as China is a major gold producer, widely listed as the world’s largest and producing upwards of 400 tonnes annually. Very little is exported. China has often stated its goal is to hold at least as much as the U.S. (8,133 tonnes) and even hold a per capita equivalent which would see China hold upwards of 34,000 tonnes of gold.
While China has a problem with Evergrande, it appears that it will be controlled demolition as parts are sold off. Yes, Evergrande has $300 billion in debt, and the Chinese shadow banking system is estimated at $50 trillion. Yes, Evergrande has failed to make some payments. But a default has not yet been triggered. China has considerable room for borrowing. PBOC acts much like the Fed. It is noteworthy that Chinese 10-year bond yields have fallen in the past year some 16%, whereas U.S. 10-year treasury yields are up 120%. Other major developed countries have also seen bond yields rise. China with Evergrande is more likely to control the collapse and send the message to the rest of the real estate market to get their own houses in order.
Evergrande China’s Lehman moment? Many don’t believe it is. But then when a couple of Bear Stearns funds failed in July 2007 triggering the start of the sub-prime mortgage crisis that culminated in the Lehman collapse in 2008, many thought that too would pass.
Chinese Yuan – U.S. $ per Yuan 2020-2021
The other big issue has been the ongoing drama surrounding the U.S. debt limit. With the Democrats holding only a slim majority in Congress and needing upwards of 10 Republicans in the Senate to support them, every bill is a battle. And the battle over the debt limit is one of the ugliest as the U.S. moves to the brink of shutdown and default. The Democrat-controlled Congress passed a bill to suspend the U.S. debt ceiling on September 29. However, the bill was doomed in the Senate. The Senate did vote and support a short-term appropriations bill that will keep the lights on until December 3. Congress is expected to pass the bill. The bill includes funds for hurricane relief and re-settlement funds for Afghan refugees. Without it, the lights would begin to go out in government offices, thousands would face furloughs, and services would be sharply reduced.
But extending spending resolves only one problem and the countdown to October 19 (give or take) gets underway. That date is when the U.S. will run out of ways to pay its bills. That raises the possibility of a default. Chaos would follow. U.S. debt would likely be downgraded from the current AA+ to at least an A+. That would push interest rates higher. Attempts to send in a bill that covers both the debt limit and spending failed as it was blocked in the Senate. The Democrat administration’s infrastructure bills are also buried in all of this and their likelihood of passage is slim to none. Attempts at getting these bills passed with a simple majority vote were blocked by Republicans.
Congress has raised or suspended the debt ceiling 78 times since 1960. But the infighting has intensified since the mid-nineties. The most recent one passed in 2019 with little fanfare, but the fight in 2011 resulted in the U.S. being downgraded from AAA to AA+. All of it is playing out like a game of Russian roulette with the consequences so serious few want to contemplate them. But that has been the case with at least one giant financial institution. JP Morgan’s CEO Jamie Dimon has said they are preparing for a potential U.S. default but continue to hope they will come to their senses and avert a financial disaster. In the past it has all been fixed eventually, but this time is different and we are marching to the brink. Dimon added that the last time they went through this it cost the bank $100 million. A default today would cost the bank a lot more and its clients even more.
We noted from Pennock Idea Hub that they flagged a breakout on the TED spread. What is the TED spread? This is the difference between the three-month LIBOR or three-month eurodollars and three-month U.S. treasury bills. It is normally used as a measure of credit risk with U.S. treasury bills being viewed as risk-free. So, if the spread widens it is a sign that credit conditions could be weakening. It normally widens during periods of economic stress such as the financial crisis of 2008 and the EU debt crisis of 2011. A widening TED spread in February 2020 possibly portended the March 2020 pandemic-driven stock market collapse.
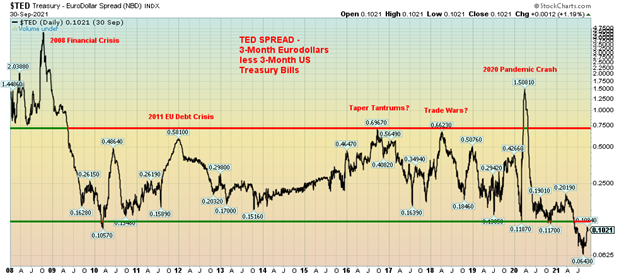
While the TED spread has widened recently from 0.06% to 0.10%, it is not yet at a level that would engender major concern. However, the spread can accelerate very quickly as was seen in 2020 during the pandemic crash. While the stock market is currently wavering, neither the stock market nor the TED spread has fallen or risen into to what one would call danger zones. However, it is worth noting.
Our chart of the TED spread highlights the periods when the spread quickly rose. Each rise was associated with some sort of crisis; however, only two stood out as major rises—the 2008 financial crisis and the 2020 pandemic crash. With the stock market currently wavering and longer-dated interest rates rising, the widening TED spread may be portending further problems. That is not too hard fathom as rising oil and gas prices are putting upward pressure on inflation. But then so are the growing pandemic-related supply disruptions occurring globally.
The global supply disruptions are complex and many are perplexed as to what to do. Shortages of computer chips are negatively impacting auto production as well as personal electronics such as cellphones and laptops, resulting in falling sales; prices of food have surged primarily due drought, floods, and a lack of trucks to deliver produce; the U.K. is facing gas shortages at the pump due to a lack of truck drivers, short upwards of at least 100,000 as Brexit closed the door on many from Eastern Europe; there are problems in the EU with gas prices rising and also a shortage of drivers; and dozens of container ships are delayed, stuck offshore (apparently 70 off the coast of Los Angeles and Long Beach) due to a shortage of dock and warehouse workers. Global supply chain workers are warning of a potential “system collapse”.
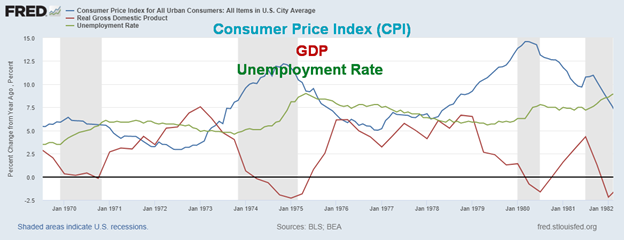
All this raises the potential for inflation to remain high for a more prolonged period. In other words, stagflation—high inflation, high unemployment, and a stagnant economy. The question is, will it be 1970s-style stagflation or something different? Either way, it doesn’t portend a period where the economy will be booming. The stagflation of the 1970s was bad for the stock market but good for commodities and gold.
The 1970s Stagflation
U.S. CPI, GDP – Year over Year Change, Unemployment Rate 1969-1982
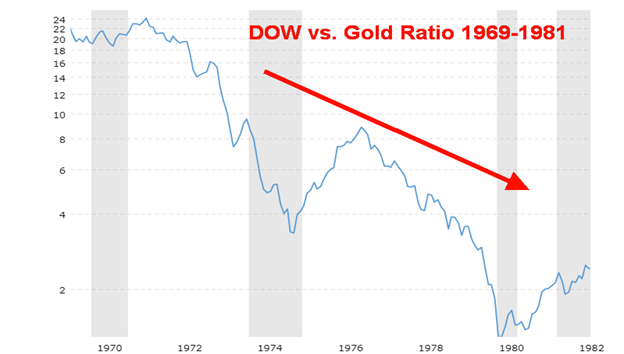
The Dow Jones Industrials (DJI) vs. gold ratio peaked in December 1965 at 27.45. Throughout the 1970s, the DJI was largely stuck in a trading range topping out just above 1,000. Meanwhile, gold soared following President Richard Nixon taking the world off the gold standard in August 1971 with gold trading around $42. The DJI/Gold ratio bottomed at 1.30 in February 1980 after gold peaked at $875 in January 1980.
The Evergrande saga continues to play out, the debt limit civil war continues as the U.S. marches to the brink, inflation may be more than transitory, supply chains are clogged, and the stock market is wavering. October could prove to be an interesting month.
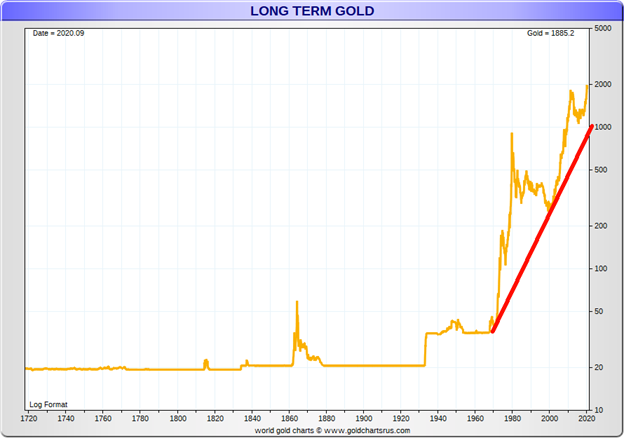
Chart of the Week
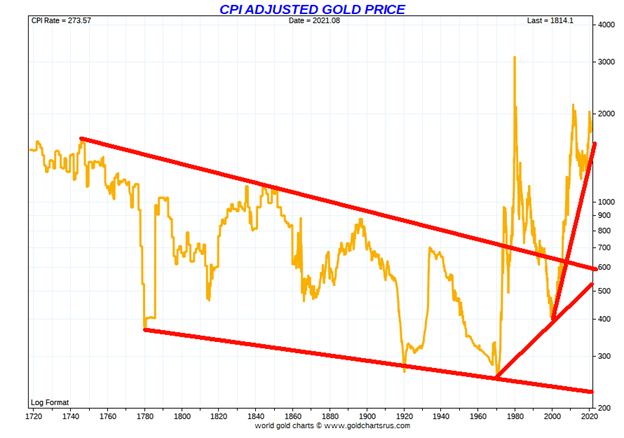
Here is a long-term picture of inflation-adjusted gold dating back to around 1700. While gold goes through periods of boom and bust, the inflation-adjusted gold highlights both the booms and the busts. Until Bretton Woods ended in August 1971, gold’s busts in inflation-adjusted terms were primarily due to the fact that the gold price was fixed. As inflation rises, fixed-price gold falls in value. Contrast the inflation-adjusted chart with a straight price chart of gold over the same period. In terms of price, gold spiked during the period of the U.S. Civil War and again when gold was revalued upward in 1934 (Gold Reserve Act of 1934) from $20.67 to $35.
Gold never really started to rise until August 1971 when former President Richard Nixon took the world off the gold standard. Then gold started to rise to its true value, pushed as well by other factors (i.e., sharp decline in the value of the US dollar, inflation, geopolitical instability, financial crisis, trade wars, etc.). Gold does, however, maintains its purchasing power. It is said that an ounce of gold can buy a well- tailored suit. During Roman times, one ounce of gold would buy one a toga plus accessories. Today it buys a well-tailored suit (roughly US$1800); however, a bespoke suit (individually tailored suits with multiple fittings and more) can be US$2,800 to US$4,000. Yes, one can get it cheaper but the making of the suit is outsourced to a low-wage foreign country.
Gold has also maintained purchasing power. An example is that in 1930 1/100 ounce of gold purchased 2.3 loaves of bread while $1 could buy 11 loaves of bread. In 2021 that 1/100 ounce of gold can buy 8.3 loaves of bread but $1 can buy less than a half a loaf of bread, a devaluation of 95% since 1930.
Still, in inflation-adjusted terms gold remains below the highs seen in the 1970s run-up. Gold today would have to rise to around US$3,000 to catch up to the 1980 high. Today at around $1,735 gold remains well below that level.
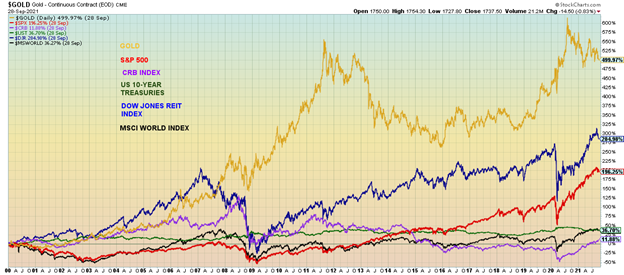
Our third chart below shows the relative performance of asset classes since 2000. While gold has been going through a corrective period, it still leads in performance, up almost 500% since 2000. By comparison, the S&P 500 is up only 196% (before dividends). A better performer has been the DJI REIT Index that is used as a proxy for real estate. The DJR is up 285%. The 10-year U.S. treasury note has shown a return of about 37% (before interest payments), while the CRB Index which contains a basket of 19 commodities including precious metals (but is dominated by agriculture and energy) is up just under 12% and is only now beginning to show a positive return. Finally, the chart shows the MSCI World Index (ex U.S.) that is up about 36% since 2000. Since August 1971 when the world came off the gold standard gold is up over 4,000%. The S&P 500 is up 5,200%; however, as we know there are periods where gold outperforms and vice versa. A further comparison is that silver is up 312% since 2000 while the US$ Index has fallen almost 8% in the 21 years. The fall in the US$ Index explains why gold has maintained its purchasing power while the purchasing power of currencies has fallen sharply.
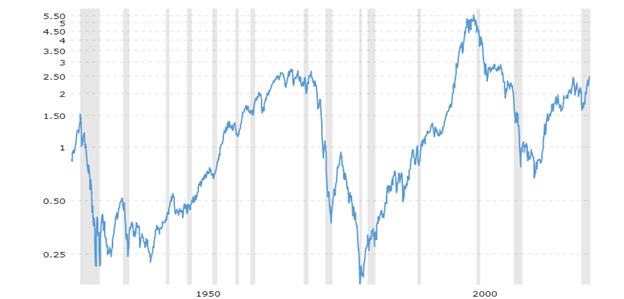
Finally, we should remind everyone that gold cannot be destroyed (or for that matter hacked or erased). Today, while central banks maintain bonds as a part of their reserves (primarily U.S. treasuries) gold remains an important reserve asset. Under Basel III rules for banks that applies to the EU, Switzerland, and the U.S. Gold is considered a Tier 1 asset for capital purposes and has a zero-risk weighting. Gold is, for the most part, negatively correlated to other asset classes. Gold acts as a safe haven during periods of economic and geopolitical instability. Finally, gold remains cheap compared to stocks, as shown by the S&P 500/Gold ratio. The S&P 500/Gold ratio is currently at 2.21 or stated the other way about 0.45 (Gold/S&P ratio). At 2.21 the ratio is not far from the high of 1967 at 2.68 and the all-time high set in 2000 at 5.29. The all-time low was in January 1980 at 0.17 and even recently in 2011 it had fallen to 0.67.
Performance 2000–2021
S&P 500/Gold Ratio 1928-2021
MARKETS AND TRENDS
| % Gains (Losses) Trends | ||||||||
| Close Dec 31/20 | Close Oct 1/21 | Week | YTD | Daily (Short Term) | Weekly (Intermediate) | Monthly (Long Term) | ||
| Stock Market Indices | ||||||||
| S&P 500 | 3,756.07 | 4,357.04 | (2.2)% | 16.0% | down | up | up | |
| Dow Jones Industrials | 30,606.48 | 34,324.46 | (1.4)% | 12.2% | down | up (weak) | up | |
| Dow Jones Transports | 12,506.93 | 14,250.71 | (0.7)% | 13.9% | down | neutral | up | |
| NASDAQ | 12,888.28 | 14,566.7 | (3.2)% | 13.0% | down | up | up | |
| S&P/TSX Composite | 17,433.36 | 20,150.87 | (1.2)% | 15.6% | down | up | up | |
| S&P/TSX Venture (CDNX) | 875.36 | 865.88 | (1.2)% | (1.1)% | down | down | up | |
| S&P 600 | 1,118.93 | 1,357.37 | 0.9% | 21.3% | up (weak) | up | up | |
| MSCI World Index | 2,140.71 | 2,292.57 | (3.0)% | 7.1% | down | up (weak) | up | |
| NYSE Bitcoin Index | 28,775.36 | 46,984.59 | 10.6% | 63.3% | up | neutral | up | |
| Gold Mining Stock Indices | ||||||||
| Gold Bugs Index (HUI) | 299.64 | 228.28 (new lows) | (0.9)% | (23.8)% | down | down | neutral | |
| TSX Gold Index (TGD) | 315.29 | 260.95 (new lows) | (1.5)% | (17.2)% | down | down | neutral | |
| Fixed Income Yields/Spreads | ||||||||
| U.S. 10-Year Treasury Bond yield | 0.91 | 1.47% | 0.7% | 61.5% | ||||
| Cdn. 10-Year Bond CGB yield | 0.68 | 1.47% | 6.9% | 116.2% | ||||
| Recession Watch Spreads | ||||||||
| U.S. 2-year 10-year Treasury spread | 0.79 | 1.20% | 1.7% | 51.9% | ||||
| Cdn 2-year 10-year CGB spread | 0.48 | 0.96% | 9.7% | 100.0% | ||||
| Currencies | ||||||||
| US$ Index | 89.89 | 94.05 | 0.8% | 4.6% | up | up | down (weak) | |
| Canadian $ | 0.7830 | 0.7913 | 0.2% | 1.0% | neutral | down | up | |
| Euro | 122.39 | 115.96 | (1.1)% | (5.3)% | down | down | up | |
| Swiss Franc | 113.14 | 107.46 | (0.6)% | (5.0)% | down | down | up | |
| British Pound | 136.72 | 135.49 | (0.9)% | (0.9)% | down | down | up | |
| Japanese Yen | 96.87 | 90.06 | (0.3)% | (7.0)% | down | down | down | |
| Precious Metals | ||||||||
| Gold | 1,895.10 | 1,758.40 | 0.4% | (7.2)% | down | down | up | |
| Silver | 26.41 | 22.54 (new lows) | 0.5% | (14.7)% | down | down | up (weak) | |
| Platinum | 1,079.20 | 973.60 | (0.6)% | (9.8)% | Down | down | up (weak) | |
| Base Metals | ||||||||
| Palladium | 2,453.80 | 1,903.70 (new lows) | (2.4)% | (22.4)% | down | down | neutral | |
| Copper | 3.52 | 4.19 | (2.3)% | 19.0% | down | neutral | up | |
| Energy | ||||||||
| WTI Oil | 48.52 | 75.88 | 2.6% | 56.4% | up | up | up | |
| Natural Gas | 2.54 | 5.62 (new highs) | 8.1% | 121.3% | up | up | up |
Taper worries fear that the Fed might hike interest rates, the battle over the debt limit, and inflation worries all helped push the stock markets into a loss this past week. It was the third weekly decline in the past four weeks. The S&P 500 dropped 2.2%, the Dow Jones Industrials (DJI) held in but still fell 1.4%, the Dow Jones Transportations (DJT) held in quite well, losing only 0.7% while the tech-heavy NASDAQ was the biggest loser, off 3.2%. The small-cap S&P 600 surprised, gaining 0.9% and giving rise to the expectations that the stock market’s decline will soon be over. In Canada, the TSX Composite lost 1.2% and the TSX Venture Exchange (CDNX) dropped 1.2%.
In the EU, the London FTSE fell 0.1%, the Paris CAC 40 was off 1.8%, and the German DAX dropped 2.4%. In Asia, China’s Shanghai Index (SSEC) fell 1.2% while the Tokyo Nikkei Dow (TKN) dropped at sharp 4.9%, seeming to end its recent good run. The MSCI World Index was down almost 3%. The cryptos had a good week with Bitcoin rebounding 10.6% on speculation for the pseudo currency as it is launched in El Salvador.
While the jump in treasury yields was concerning, the buzz on the week appeared to be the looming debt limit war. Yes, there is concern over tapering, that the Fed might hike interest rates, that inflation is rising, and that the Delta variant has pushed U.S. deaths over 700,000, but the debt limit has been a topic of hot discussion. So far, the Republicans are spurning all attempts. The Republicans accepted the spending bill that would have averted a government shutdown. The debt limit war deadline is October 19. So far, the market continues to treat it as if they will come to their senses and avert a default. But what if they don’t?
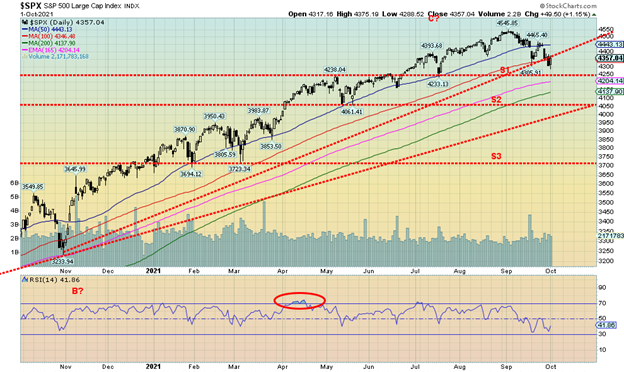
The stock markets now appear to be in the throes of a third wave down. Whether it is a 3 wave or a C wave is not relevant. We are headed lower. We acknowledge, however, that the corrective that started over a week ago could still be in play and we get another bounce higher. The S&P 500 has broken support at 4,370 and next support is seen at 4,250. Below that, the next support is at 4,050 or the 200-day MA near 4,140. Below 4,050 lies the abyss. The DJI major support is at 31,800 and again at 29,200. The 200-day MA is at 33,380. So far, supports are holding. But for how much longer? The DJI has taken out lows seen May through July so that is already telling us we should go lower. The lows seen February through April are the next key levels that must hold. That fits with the 31,800 and 29,200 levels. Only above 35,100 do we stand a chance of challenging the highs once again.
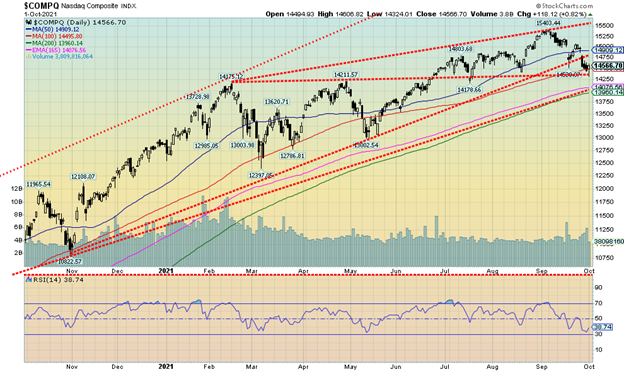
The NASDAQ appears to be leading the market lower. The NASDAQ lost 3.2% this past week, the weakest of the major indices. The NASDAQ is currently trying to hold the 100-day MA near 14,500. It tested a support level near 14,360, bouncing off it. A break now of 14,360 could send the index down to the 200-day MA near 13,960 for what would be a 9.4% correction from the high. The FAANGs helped lead the way down. The NYSE FANG Plus Index (FANG) fell 2.8% this past week. Of the components, Facebook dropped 2.8%, Apple was off 3.1%, Amazon was down 4.2%, Netflix was the gainer making 52-week highs +3.5%, Google dropped 4.4%, Microsoft was down 3.5%, Tesla held up but with a small gain of 0.1%, Twitter was a big loser -7.8%, Baidu was down 3.2%, Alibaba was off 0.6%, and Nvidia down 6.1%. By contrast, the ultimate value stock Berkshire Hathaway was off 0.6%. The NASDAQ has resistance up to 14,800 and 14,900. Over 15,250 new highs are possible.
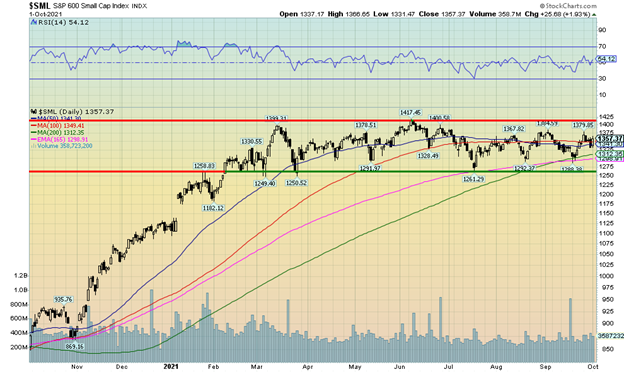
The small-cap stocks have held up remarkably well recently. The S&P 600 was up this past week 0.9%. The small-cap Russell 2000 Index was, however, off a small 0.4%. Without examining the components of the indices there may have been something(s) in the SML that helped it to a gain. Many are pointing to the SML as why the markets are not going to fall because the small caps are rising. Usually, in a bear market, the small caps lead the way down. The small caps 600 have been in a trading range now for most of the year. Either this is a big topping pattern or it is a big consolidation pattern. It breaks out above 1,425 but breaks down below 1,250. At least we know the points.
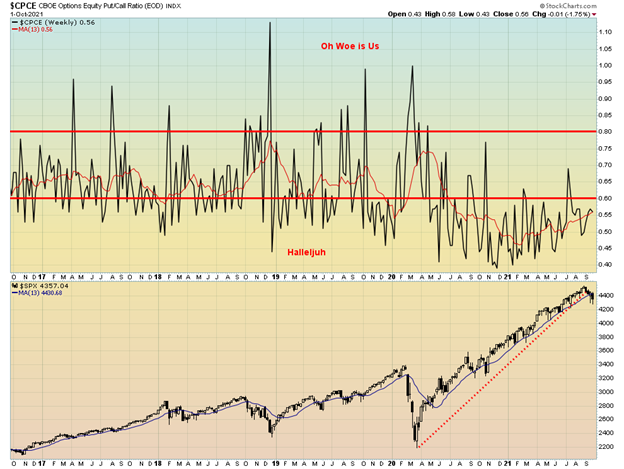
Well, we were surprised once again about how bullish this market remains. The put/call ratio closed at 0.56, still firmly in bullish territory. I guess they haven’t been spooked enough to leap into puts just yet. This is despite the S&P 500 breaking and closing under its 13-week MA. Our S&P 500 Bullish Percent Index is currently at 48 which is pretty neutral. Overall, what this suggests to us is that we have not yet found a bottom. We’d like to see the put/call ratio over 0.80 to consider a bottom.
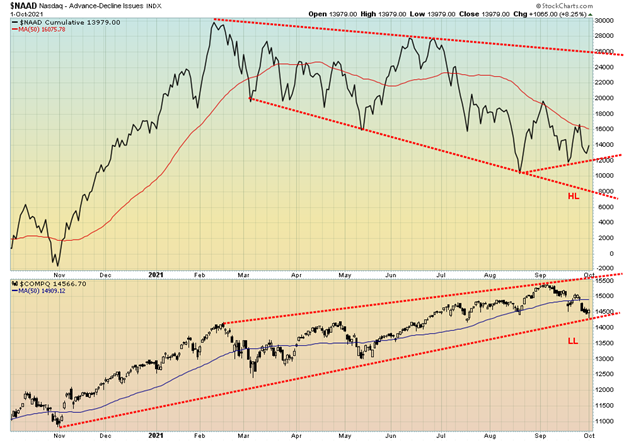
We are getting some mixed signals. While the put/call ratio is still highly favourable towards the bulls we note a small divergence in the NASDAQ advance/decline line. The AD line is making a higher low (HL) while the NASDAQ is making a lower low (LL). Compared to the negative divergence we saw at the top this is pretty small so it may not be meaningful just yet.
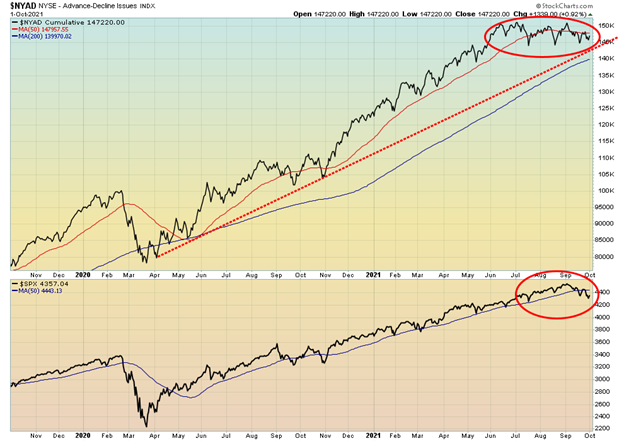
There is a small divergence between the NYSE advance/decline line with the S&P 500 as well. Again, it is not that pronounced compared to the divergence seen at the recent top. But worth noting.
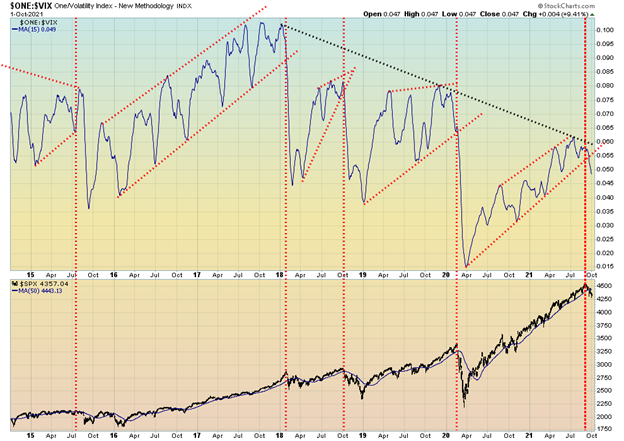
Here is the inverted VIX Volatility Indicator and the S&P 500. No divergence being seen here. Both are pointed down. Other indicators are not giving clear signals either. None of the bear/bull indicators have hit extremes nor has the MacLellan Summation Index (ratio adjusted). RSI’s, MACD’s and other indicators are still in down mode. So while some divergences have popped up we don’t believe there are sufficiently strong enough to signal that a low could be in.
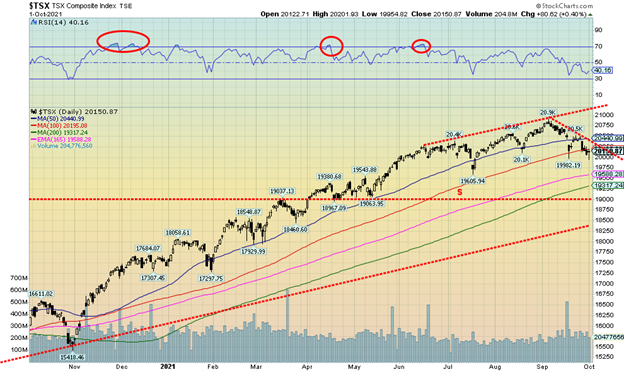
The TSX Composite continued its recent downtrend, falling 1.2% on the week. The index closed under its 100-day MA, the weakest level since July. The small cap TSX Venture Exchange (CDNX) was off 1.2% on the week. Of the 14 sub-indices only one, Energy, saw gains on the week. And Energy (TEN), given it is such a big component of the TSX, helped to keep the TSX up or the weekly loss might have been more. The TEN gained 5.0% to new 52-week highs. Leading the pack to the downside was Information Technology (TKK), down 6.6%. Other significant losers were Consumer Discretionary (TCD) -2.7% and Real Estate (TRE) -2.0%. A downtrend for the TSX is now proceeding and the short-term trend has turned down. Given the index closed under its 100-day MA, it is essential to regain the level and preferably above 20,200 if we have any thoughts of going higher. There appears to be support at 20,000, but when that breaks the next time, the odds favour a decline towards the 200-day MA near 19,300. The downtrend does not officially end unless we break out over and close over 20,500. Long-term support can be seen down at 18,500. We do not expect to fall that far this time around. We are looking for the 200-day MA to hold (give or take) any further decline.
U.S. 10-year Treasury Bond/Canadian 10-year Government Bond (CGB)
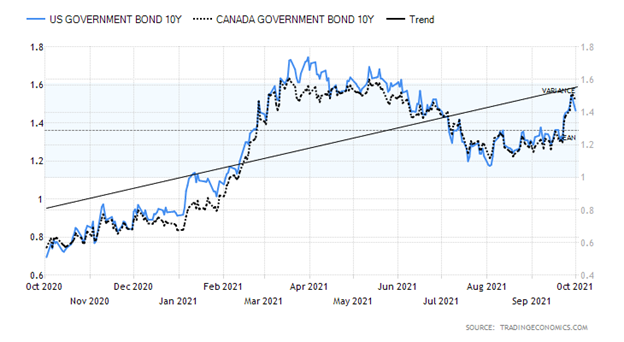
After jumping as high as 1.56% this past week, the U.S. 10-year treasury note settled back and closed at 1.47%, up 1 bp on the week. The Canadian 10-year Government of Canada bond (CGB) held firm, rising to 1.47%, up roughly 10 bp on the week. Over 1.50% would normally have suggested to us that we are headed higher still. However, closing back under that level leaves us in a quandary as to what next. The trend has shifted to the upside. Over 1.60% would suggest to us that we could see new highs above 1.74%. Still, at 1.47% the 10-year remains negative to the current rate of inflation to the tune of 3.83% for the CPI and 2.53% to the core CPI rate. Either interest rates have to go higher or the inflation rate comes down. Inflation continues to be pushed higher by commodity prices, particularly energy prices as bottlenecks and shortages develop. Rising inflation and supply shortages are becoming bad in the EU and especially in the U.K. Driving yields higher this week were Fed comments (Harker, Powell, Williams, Bostic, Brainard) giving varying accounts of tapering, hiking interest rates, and the economy. Powell quelled things with statements suggesting the U.S. is far from full employment. That helped push the 10-year yield down. Sure enough, jobless claims this past week were 362,000 above the forecast of 335,000 and above last week’s 351,000. Suddenly the job picture is not looking quite as rosy. The employment numbers are due out this coming Friday, October 8. The expectation is 460,000 vs. 235,000 in August. The unemployment rate is expected to be 5.1% vs. 5.2%. Canada’s job numbers are out as well, looking for 60,000 vs. 90,200 and an unemployment rate of 6.9%.
Helping push yields higher was the August durable goods number that rose 1.8% when a rise of only 0.7% was expected. Housing prices rose 19.9% year over year, about as expected. Pending home sales also surprised on the upside, up 8.1% in August when all the expected was a rise 1.4%. The Chicago PMI was about on target at 64.7 vs. expected 65. The GDP price index was 6.2% for Q2 vs. the previous 4.3% but about on expectations. The ISM Manufacturing Index was 61.1 vs. the expected 59.6 and the Michigan Consumer Sentiment Index was at 72.8, a bit above the expected 71 but well down from the 88.3 seen last April. The rise of the Delta variant and the growing political divide are contributing to the decline.
The treasury yield is being pushed higher by rising inflation expectations, fear of tapering, or the Fed hiking interest rates and possibly as well what might happen with the debt limit. But overall, they are rather benign given they are sharply under the current rates of inflation. These are the kind of spreads we saw in the 1970s. In other words, stagflation. The 1970s were bad for stocks but great for commodities and gold.
PCE Price Index, Core PCE Price Index – Year over Year Change % 2000-2021
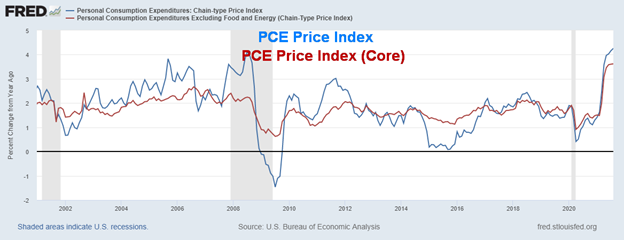
While markets tend to focus on the CPI or the PPI the Fed usually focuses on the PCE Price Index (Personal Consumption Expenditures). The PCE Index is a measure of prices in the U.S. It captures inflationary pressures across a wide range of consumer expenses. The PCE price index is up 4.3% in the past year while the Core PCE Price Index is up 3.6%. These are well above the Fed’s stated 2% goal. We note that the PCE Price Index jumped sharply during the 2007-2009 financial crisis then collapsed again before starting a more measured rise. Maybe this one will do the same as many do not believe the recession is over. However, there are other factors pushing prices higher mostly related to pandemic clogged supply chains.
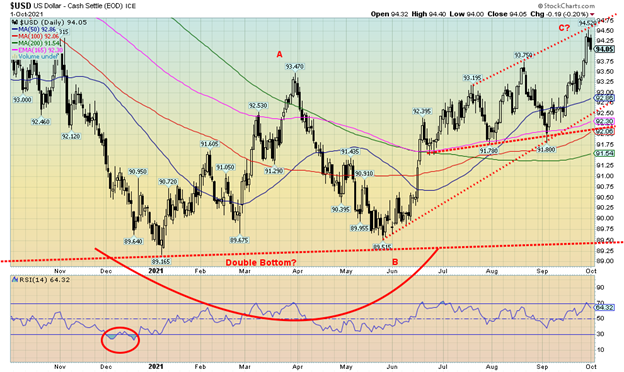
The US$ Index broke out this past week, soaring to new 52-week highs. Bullish sentiment as reported by the DSI indicator soared to 89% the highest extreme seen since March 2020. And that is despite the fact that prices on the US$ Index are 8% lower than they were in March 2020. On the week the US$ Index rose 0.8%. The euro lost 1.1%, the Swiss franc dropped 0.6%, the pound sterling was off 0.9%, while the Japanese yen dropped just under 0.3%. Only the oil-driven Canadian dollar gained, up 0.2% on the week and now up 1.0% in 2021. All the other currencies are down on the year. The US$ Index appears to have hit the top of a channel drawn along the highs seen in July and August. As well, the pattern now appears to us as what we call three thrusts to a high. The pattern is characterised by three consecutive thrusts to new highs with each thrust only barely above the previous one. The first one was at 93.20 in July, the second one in August was 0.6% higher at 93.75, while the high this past week was 0.8% higher at 94.52. The pattern also forms what we call a zig-zag. This is not a pattern of strength but one of weakness. From the January 6 low at 89.52 the US$ Index has formed what appears as a double zig-zag. This is a corrective pattern and not a new impulse move to the upside. Once this completes, we should retrace the entire move back to January 6 and probably go lower. The breakdown points come at 92.50 and especially under 92 and 91.50. This is premised on no new highs as that could change the timing but probably not the overall pattern.
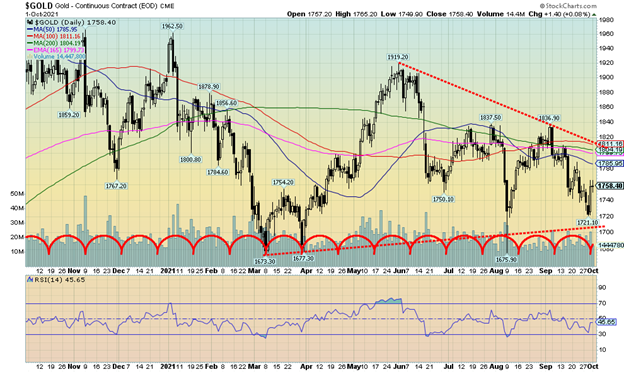
Has gold made a low? This past week gold hit a low of $1,721 but held well above the $1,675 low seen in August. Thus far the March low of $1,673 remains the low for the year and what we believe to be our 31-month cycle low. However, as we learn, the negatives from the cycle low can hang around with us for a number of months. After hitting a low $1,721 on Wednesday’s $40 plunge, gold reversed the next day and effectively wiped out the losses seen earlier in the week. Gold closed up 0.4% on the week but remains down 7.2% in 2021. However, we do point out that gold remains up 21% from the March 2020 pandemic crash low. Silver followed gold making 52-week lows, breaking briefly under $22 but then closed up 0.5% on the week. Platinum continues its recent woes, losing 0.6% and down 9.8% in 2021. Of the near precious metals, palladium fell again, off 2.4% and down 22.4% on the year while copper was off 2.3% but remains up 19% in 2021. The gold stocks fell once again (see later) to fresh 52-week lows.
Gold was pressured lower by the sharply rising U.S. dollar that broke to 52-week highs. Growth potential, fear of the Fed tapering and hiking interest rates helped push gold lower. However, when the U.S. dollar reversed and the Fed noted that employment remains weak, gold reversed back to the upside, wiping out the previous loss. As well, we note our small cycle indicator indicated we could be due for a low and gold appears to be doing just that. The question now: is it just another bounce before we plunge to new lows or is this the low?
There is considerable work to be done to regain $1,800 and then break out above $1,810 resistance. As well, there is further resistance seen at $1,820 and up to $1,835. The line in the sand remains at $1,700/$1,710. Under that level gold could in theory see new lows below $1,675 and even project down to $1,450. Gold may have been forming a large symmetrical triangle. The breakout point is above $1,810 and potentially could project up to $2,050. That would get the gold bugs excited. The commercial COT (see next) is at its best level in over a year. Bearish sentiment towards both gold and silver remains at extremes so that is also potentially bullish. We were buoyed by the reversal week after peering into the brink (and silver going briefly over the brink), but the reversal and higher close were encouraging. The question now is, can we see upside follow-through this coming week? But even if we do, we still need to break out over the entire $1,800/$1,835 resistance zone to confirm and convince us that we should move higher.
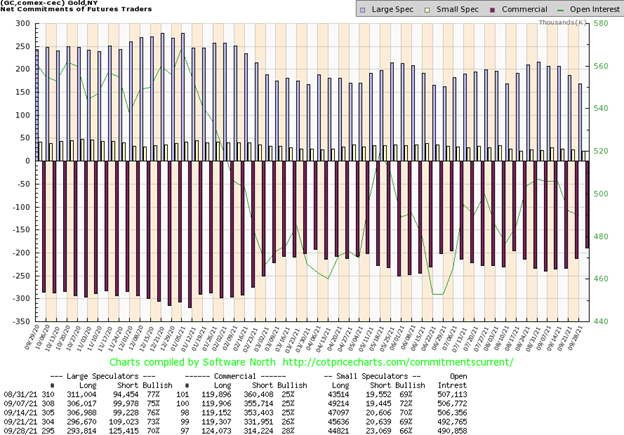
The commercial COT (bullion companies and banks) improved once again to 28% from 26%. The large speculators COT (hedge funds, managed futures, etc.) fell to 70% from 73%. For the commercial COT, long open interest jumped almost 5,000 contracts while short open interest fell over 17,000 contracts. This is good improvement for the commercials while the large speculators continue to get short as their short open interest rose over 16,000 contracts while long open interest fell about 3,000 contracts. This is the most bullish we have seen the commercial COT in a year. Hopefully this translates into an upward move in the markets.
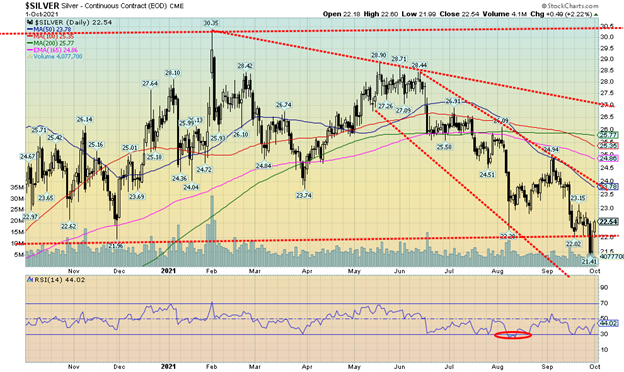
Silver plunged this past week through our long-held line in the sand at $22. However, it happened on low volume. No doubt it shook out a lot of stops that would be placed there. The next day silver reversed to the upside, then closed higher again on Friday, effectively retracing the entire $1 plunge seen on Wednesday. In closing higher on the week, while making fresh 52-week lows, silver put in a reversal week. No, not a key reversal. Only a close over $23 would have accomplished that. With gold not making fresh 52-week lows silver once again diverged sharply. As we note, the silver commercial COT has improved to its best levels in over a year. The gold/silver ratio last at 78.15 remains historically high although well off the high near 130 seen in 2020. A mean level would be around 60 and a low level would be under 40 and especially under 30. To achieve mean, silver should be trading at $29/$30. By many measurements, silver remains undervalued.
If the reversal was right, then silver needs to see follow-through this coming week and also continue to lead gold. Silver breaks out above $23.80 but a major breakout does not happen until it is above $27. Silver gained 0.5% this past week but is down 14.7% in 2021. Silver is down roughly 26% from its high at $30.35 in February.
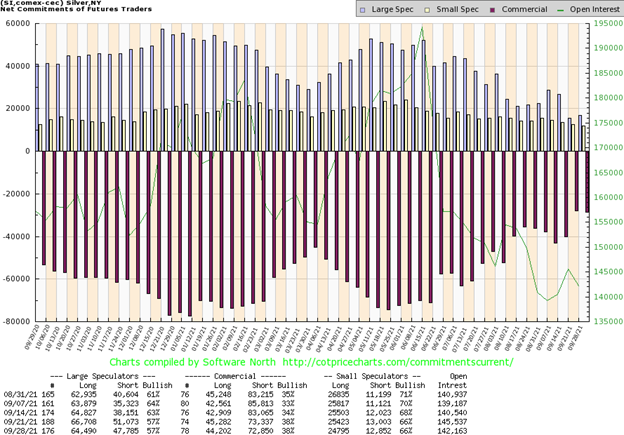
While there was no change in the silver commercial COT, it remains the most bullish we have seen in months. The commercial COT came in once again at 38%. There was little change with both long and short open interest, each falling roughly 1,000 contracts or so. The large speculators’ COT was also unchanged at 57%. There too the change was small with long open interest down just over 2,000 contracts and short open interest off roughly 3,500 contracts. Overall open interest fell during what proved to be a reversal week.
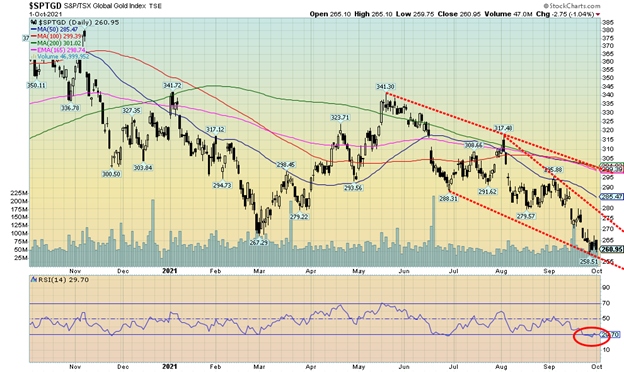
The misery continues for the gold stocks. Despite the reversal in gold and silver this past week the gold stocks did not follow. Once again, they closed lower with the TSX Gold Index (TGD) falling 1.5% and the Gold Bugs Index (HUI) off 0.9%. Both printed new 52-week lows. The HUI is down 23.8% in 2021 and down 39% from its August 2020 high but up 59% from March 2020. The TGD is down 17.2% in 2021, down 37% from August 2020 but up 50% from March 2020. The Gold Miners Bullish Percent Index (BPGDM) has fallen to 20%, the lowest level seen since March 2020 when it fell to 7.7%. The RSI for the TGD has been mostly under 30 for the past few weeks, an indication of how oversold the gold stocks are. Ratios that measure gold miners’ relative strength vs. gold or vs. the stock market show the gold stocks are very undervalued and unloved historically. While it is easy to say that they can’t remain this way forever it doesn’t necessarily change the relationship overnight. An old trading axiom, however, is that eventually everything returns to the mean and in that respect the gold stocks are long overdue.
Given this week’s reversal for gold and silver, there is some optimism that the TGD (and HUI) may be in the process of bottoming. If the recent low of 258 holds, then the TGD appears to be forming a descending wedge triangle which is bullish. The breakout point is at 275 and it projects up to 315/320 as a minimum. The major breakout zone is at 300. All of this is assuming the low this past week at 258.51 holds. In theory, we could wiggle our way lower to 255. Over 270 could start to confirm a low.
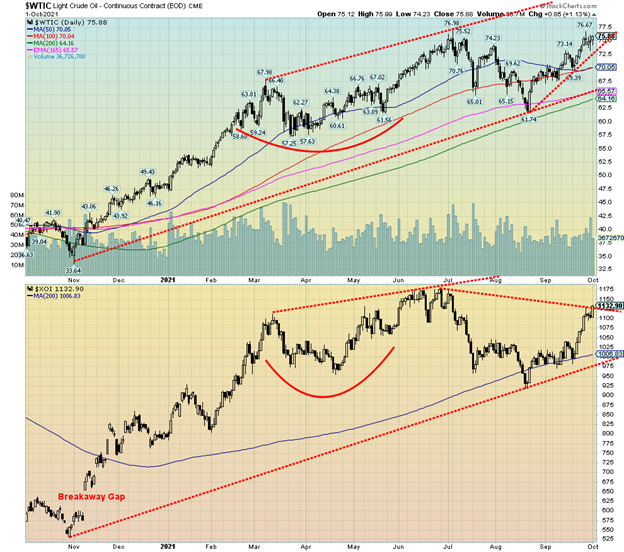
WTI oil came close to equaling the recent high of $76.98 this past week while Brent crude soared at one point over $80. WTI settled back to close at $75.88 while Brent pulled back to $79.17. It was the highest close in 2021 and the highest close since 2014. Many are now predicting that prices will rise to $100. The slight pullback was sparked by a surprise surge in inventories and some extra supply. This week OPEC will meet (starting Monday) and the buzz is they might bring in more supply. Word did come this week that both Russia and Kazakhstan boosted supply.
WTI oil gained 2.6% this past week and is now up 56.4% in 2021 and up over 1,000% from the depths of the March 2020 pandemic low. Natural gas (NG) continued its recent run up 8.1% this past week and up 121.3% in 2021. NG once again printed 52-week highs. NG is up 270% from its March 2020 pandemic low. All this feeds right back into gasoline prices as the gasoline contract on the CME is up 60% in 2021 and up 389% from the March 2020 pandemic low. No wonder the energy stocks continued their recent run with the ARCA Oil & Gas Index (XOI) up 5.9% this past week and the TXS Energy Index (TEN) up 5.0% to new 52-week highs. The XOI is up 43% in 2021 and up 156% since March 2020. The TEN is up 59.7% in 2021 and up 275% since March 2020.
The XOI appears to be trying to break out. The close wasn’t firmly over the breakout line but the implication appears to be that the XOI should move higher. Both the XOI and the TEN remain below where they were before the 2020 pandemic crash. However, oil prices are now above those levels and NG is back where it was in 2014. All these wild moves reflect the volatility of the sector and the booms and bust cycles they go through naturally.
Given that we are seeing some pickup in volume as prices move higher, the odds are good that once WTI oil breaks out over $80 prices could rise towards $100 as some are predicting. A break back under $72.50 might put the strong rally on hold and under $70 prices could fall back towards the 200-day MA currently near $64.
—
(Featured image by PublicDomainPictures via Pixabay)
DISCLAIMER: This article was written by a third party contributor and does not reflect the opinion of Born2Invest, its management, staff or its associates. Please review our disclaimer for more information.
This article may include forward-looking statements. These forward-looking statements generally are identified by the words “believe,” “project,” “estimate,” “become,” “plan,” “will,” and similar expressions. These forward-looking statements involve known and unknown risks as well as uncertainties, including those discussed in the following cautionary statements and elsewhere in this article and on this site. Although the Company may believe that its expectations are based on reasonable assumptions, the actual results that the Company may achieve may differ materially from any forward-looking statements, which reflect the opinions of the management of the Company only as of the date hereof. Additionally, please make sure to read these important disclosures.
David Chapman is not a registered advisory service and is not an exempt market dealer (EMD) nor a licensed financial advisor. We do not and cannot give individualised market advice. David Chapman has worked in the financial industry for over 40 years including large financial corporations, banks, and investment dealers. The information in this newsletter is intended only for informational and educational purposes. It should not be considered a solicitation of an offer or sale of any security. Every effort is made to provide accurate and complete information. However, we cannot guarantee that there will be no errors. We make no claims, promises or guarantees about the accuracy, completeness, or adequacy of the contents of this commentary and expressly disclaim liability for errors and omissions in the contents of this commentary. David Chapman will always use his best efforts to ensure the accuracy and timeliness of all information. The reader assumes all risk when trading in securities and David Chapman advises consulting a licensed professional financial advisor before proceeding with any trade or idea presented in this newsletter. David Chapman may own shares in companies mentioned in this newsletter. We share our ideas and opinions for informational and educational purposes only and expect the reader to perform due diligence before considering a position in any security. That includes consulting with your own licensed professional financial advisor.


Youth Cannabis Use in Colorado Is Falling — But the Full Story Is More Complex
The 2026 Colorado survey shows teen cannabis use fell to 10 percent in 2025, down from 21 percent in 2015....


Morocco’s Growth Holds at 4.6% as Agriculture Offsets Economic Pressures
Morocco’s economy grew 4.6% in Q1 2026, driven by a strong agricultural rebound offsetting declines in industry. Services expanded moderately...


Abivax Shares Surge as New Trial Data Eases Safety Concerns Over Ulcerative Colitis Drug
Abivax shares surged nearly 36% after positive updated trial results for its ulcerative colitis drug obefazimod reassured investors following earlier...


El Dorado Raises $9M to Expand Cross-Border Fintech Platform
El Dorado, a Latin American fintech improving cross-border financial services, raised a $9 million Series A led by Paradigm with...


Bitcoin Stalls Near $60K as Strategy Moves, ETFs Outflow, and EU MiCA Rules Take Effect
Bitcoin hovers near $60,000 with ETF outflows, while Strategy boosts reserves, sells BTC, and raises dividends to reassure investors. Ethereum...
 |
|
 |  |
 |
|
-

 Impact Investing2 weeks ago
AI Adoption in Italian Retail Stalls Despite Strong Experimentation
-

 Cannabis1 day ago
Cannabis Dominates Global Drug Use: Trends, Risks, and Shifting Markets
-

 Impact Investing1 week ago
EU Weighs More Free Emission Permits in ETS Review to Boost Industry Competitiveness
-

 Crypto5 days ago
Bitcoin and Ethereum Slide as Market Pressure Builds Amid Strategy Concerns and Layer 2 Disruptions