Featured
Oil Continues to Rise as Supply Disruptions Continue
Evergrande and the looming debt limit fight are the topics of the week. Apparently Evergrande didn’t make the payment triggering a 30 day window. Will PBOC save the day? The debt limit fight appears that it will go down to the wire with global financial implications if it fails. Our “chart of the week” looks at the Dow Jones Industrials from an inflation adjusted viewpoint.

I’ve always enjoyed reading Carmen M. Reinhart and Kenneth S. Rogoff’s book This Time is Different, Eight Centuries of Financial Folly (Princeton University Press, 2009). The book is probably the best ever written in trying to empirically investigate financial crises over the centuries. The book continues to be meaningful right up until today. Yes, the book is quite quantitative, full of charts, tables, and lengthy explanations. Nonetheless, it remains fascinating.
Practically any country that calls itself a country (and even states and provinces) has defaulted at some point. Some are serial defaulters. Argentina and Brazil are two that crop up numerous times and Latin America leads the serial default parade with Venezuela and Ecuador leading the pack—10 defaults each. And there are surprises. Most people are probably not aware that England defaulted at least twice, even if it was back in the 14th to 16th centuries.
Even the U.S. has defaulted, at least technically. They delayed on interest payments for several years on debt obligations that started in 1790. They once delayed on treasury bill interest payments in 1979. However, the most egregious case of default was the U.S. shutting the gold window in August 1971. Before that, the upward revaluation of gold in 1934 was sparked in part by the U.S.’s inability to cover bond payments in gold as was the obligation. Simply, they didn’t have enough gold to cover their obligations. The debt ceiling fight of 2011 led to the U.S. losing its coveted AAA credit rating as they were downgraded to AA+. The current debt ceiling fight could result in another downgrade, even if they somehow cobble together a last-minute deal to stave off default.
Oh yes, and Canada hasn’t fully escaped. Newfoundland (1934) before it became a province and Alberta (1935) both defaulted in the 1930s during the Great Depression. As to Canada becoming Venezuela or the Weimar Republic at some point in time—well, who knows, but Canada remains one of only 11 countries with an AAA credit rating. With a National/Federal debt of Cdn$1.15 trillion and a GDP of Cdn$2.1 trillion, our debt/GDP ratio is 55%. Canada is the lowest in the G7. Although numerous tables available include provincial and municipal debt and that pushes us to around 115%. The U.S. National/Federal debt/GDP ratio is 125% ($28.8 trillion debt, $22.9 trillion GDP) while Japan is approaching 275% and Japan hasn’t collapsed. A comparable figure for the U.S. debt/GDP ratio including state and local debt pushes the U.S. to about 140%. China’s debt/GDP ratio is 55% and Russia is around 19%. Any debt/GDP ratio over 100% is a drag on the economy, lowering GDP by about 1%.
Nonetheless, the risk of default by some sovereign nations is high. However, outside of concern for Japan’s debt, the countries considered at or near default are emerging market economies in Latin America, Africa, and Asia. In Latin America, Argentina (a serial defaulter), Venezuela, and Ecuador (both serial defaulters) are noted. Belize and Suriname already have defaulted and El Salvador is at risk. In Africa, Angola, Zambia, Congo, Egypt, Tunisia, Ethiopia, and Morocco are in tough. Asia has risk in Jordan, Lebanon, Pakistan, Sri-Lanka, and Mongolia. In Europe, Turkey and Ukraine are most mentioned along with Greece and Portugal.
While there have been notable sovereign debt crises, with numerous country defaults during the Great Depression and the Latin American debt crisis of the 1980s standing out, it is banking/financial crises that causes stock markets to swoon. Since 1900 the U.S. has been through at least seven serious banking crises. The ones that stand out were: the 1901 and 1907 banking panics; the Great Depression of 1929–1933 when thousands of banks failed; the 1973–1975 banking crisis sparked by the oil crisis of 1973 and the collapse of Franklin National; the 1980s savings and loan crisis or S&L crisis that saw the collapse of over 1,000 financial institutions in the U.S.; the 1997 Asian financial crisis impacting mostly Asian financial institutions; the 1998 Russian financial crisis culminating in the collapse of Long Term Capital Management (LTCM): and the 2007–2009 sub-prime mortgage crisis that culminated in the collapse of Lehman Brothers, a 50% plus collapse of the stock market, the near collapse of the global financial system and ending with the most massive bailout in history until the pandemic collapse of 2020.
On average that is one roughly every 17 years, except for a few that occurred close together. In terms of recession, there have been 23 recorded recessions (including two classifieds as Depressions – 1920–1921, 1929–1933) since 1900. That’s one roughly every five years. Since 1970 we have recorded eight recessions or one every six years. Given that we have recorded two consecutive quarters of growth, many are declaring that the 2020 recession is over. However, it is tenuous. It is also behind why the Fed at the FOMC meeting this past week was suggesting potential interest rate hikes in 2022 and a move to slow tapering, starting even in the fourth quarter. Remember, the Fed is not going to actually come out and say they are going to do these things, only hinting they could if the numbers fall in place. So that is a big “if” with a lot of wiggle room between actually doing something and doing nothing.
Currently there are two significant risks. One is the potential collapse of Evergrande, the giant Chinese property management conglomerate. Yes, a save came in this week averting a potential default. However, that is not the end of it. The Chinese government would like to engineer an orderly default. But there are serious risks of contagion that could engulf not only China’s banking system but the world’s as well. China’s banking system is huge, estimated at $50 trillion; however, there is also a large shadow banking system that today has credit extended to firms and households totaling 287% of GDP. By comparison, U.S. corporate and household debt is roughly 205% of GDP. Canada’s private debt to GDP is over 300% according to the OECD, putting Canada’s corporate and household debt in a more precarious position than government debt.
Chinese companies have issued in excess of $1 trillion of U.S. dollar denominated bonds. Most of those bonds were actually snapped up by foreign entities. So, an Evergrande default could have global implications given contagion. Evergrande’s debt is also horribly mismatched with much of it short-term against long-term real estate holdings. There is considerable confusion as to whether Evergrande was making payments that were due. Apparently, an $83.5 payment due Thursday had not been made, triggering a 30-day window for this to be resolved before a default can be triggered. More payments are due over the next week or two. PBOC has been “pumping” liquidity into the financial system to ensure everyone can keep “swimming.”
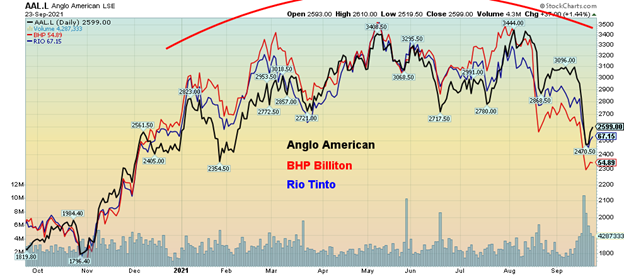
The downturn in the Chinese property market boom is already negatively impacting the price of iron ore and steel as demand falls. Is it any surprise to discover that the shares of BHP Billiton, Anglo-American, and Rio Tinto have taken a big hit, each down 13% to 16% since early September. Evergrande is in the category of “too big to fail” and many watchers are unsure of what the Chinse government might do. Government bailout, restructuring, or default are the only options available to Evergrande. Could this be a Chinese Lehman Brothers moment?
Metal Companies have Collapsed
The other looming huge risk is the U.S. debt limit. Unsurprisingly, former president Donald Trump is telling Republicans that it is “unpatriotic” not to block the raising of the debt limit. Given his sway over the Republican party, will it spark a real crisis? The betting is still that something will be crafted more likely in the form of a “save face” move to defer the decision once again.
Still, the potential threat of a U.S. default has to be nerve-wracking as the deadline is approaching sometime in October. A bill has been put forward in the house but it still needs to pass the Senate and the likelihood appears to be slim to none. Don’t forget the government is also trying to pass its $3.5 trillion infrastructure bill at the same time. So, raising the debt ceiling has positive (or negative) implications for that as well.
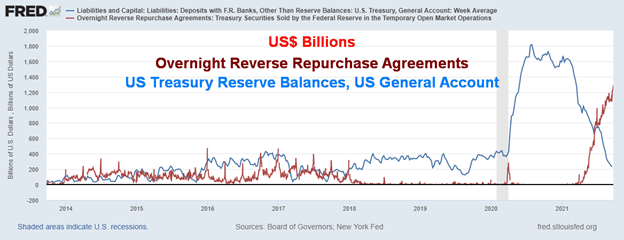
So, what does it mean if the U.S. can’t pay its bills? As one can see, U.S. Treasury balances are falling rapidly. Oddly enough, the decline in U.S. treasury balances coincides with the rise of the Fed’s activities in the repo market, with reverse repos sopping up excess cash at not only primary dealers but at many other financial institutions and corporations as well. Those daily reverse repo activities are now exceeding $1.2 trillion daily, even as U.S. treasury cash balances have been run down $1.5 trillion since August 2020. Are they connected? What is connected is that the daily reverse repo operations of roughly $1.2 trillion equal 10 months of QE at $120 billion/month. So, the question still begs: why continue with QE while at the same time “sucking” the excess cash out of the financial system over apparently 128 different counterparties, up from 74 counterparties back in June 2021?
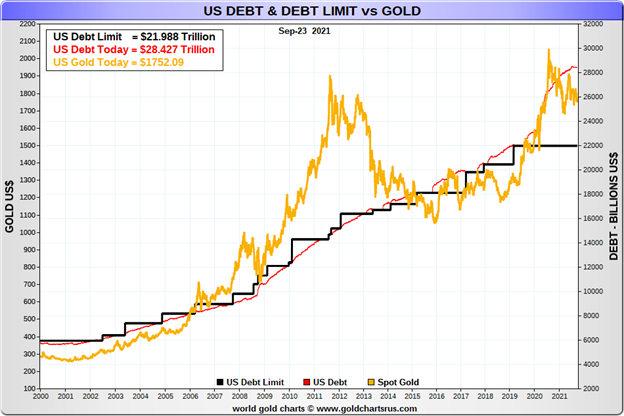
As to the end of cash payments at the U.S. treasury, it could translate into a shutdown of government. Social security payments would not go out, U.S. troops and federal employees would not be paid, veterans would see pensions lapse, and millions of Americans on food assistance would see their benefits stopped. Millions could suddenly find themselves unemployed. And, most disturbing of all, the U.S. could default on its debt, sparking a global financial crisis. U.S. was downgraded during the 2011 debt limit fight from AAA to AA+. How low would another downgrade go? The U.S. dollar would most likely collapse, putting the U.S. dollars reserve currency status in extreme doubt. A global depression on the scale of the 1930s could follow and stock markets would collapse. Confidence in government would collapse. Deep polarization could result in civil strife. In other words, the nightmare scenario. No wonder many expect it not to happen and that, at minimum, another deferment will be crafted. It is too scary to contemplate. However, gold may rise.
Oh yes. This time is different. The only thing different is the circumstances.
Chart of the Week
Charles Dow first published the Dow Jones Industrial Average (DJI) on May 26, 1896. There were only 12 companies in the index. However, Dow Averages were first published in the Wall Street Journal in 1885. Charles Dow was the editor and he, together with Edward Jones, co-founded Dow Jones & Company. Before the creation of the Dow Jones index, published data was available from the New York Stock Exchange (NYSE) founded in 1817 and before that the Philadelphia Stock Exchange (PHLX) that was founded in 1790. The PHLX still exists today and is owned by NASDAQ Inc.
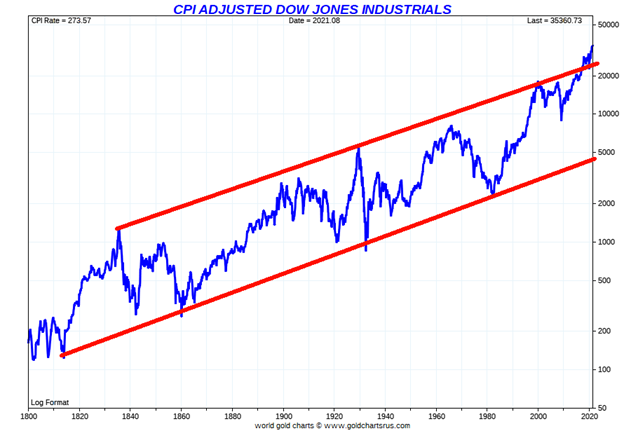
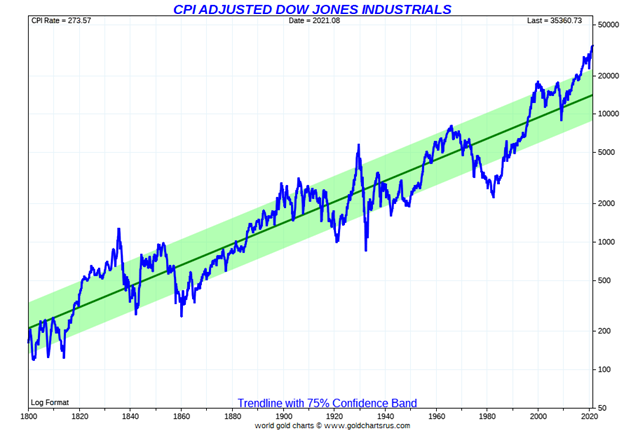
This is the DJI dating from 1800, inflation-adjusted. It is a somewhat different picture than one normally sees. Resistance is the upper line that starts from a market high in 1835, traces along the high of 1929, and catches the high of 2007. We are currently overthrowing the resistance line. This suggests to us that if we are not at a top, we are getting very close to one. Support traces from a low in 1813 and connects up with a the low of 1843, 1932, and 1982. As noted, the 2007–2009 collapse came nowhere near the major support line.
The question is, will the next time take it down to the support line currently near 5,000? A reminder that this is an inflation-adjusted chart. Our second chart below shows the same DJI 1800–present but has a trendline with a 75% confidence band. The market may trade for a period of time outside the 75% confidence band but eventually everything comes back to the mean. We are currently outside the 75% confidence band. The 2009 low did take us down towards the 75% confidence band but not under as the DJI did in the early 1980s and before that in the 1930s. Could it do it again? Time will tell.
We used an inflation-adjusted DJI as it more accurately reflects the level of the index, taking inflation into consideration.
MARKETS AND TRENDS
| % Gains (Losses) Trends | ||||||||
| Close Dec 31/20 | Close Sep 24/21 | Week | YTD | Daily (Short Term) | Weekly (Intermediate) | Monthly (Long Term) | ||
| Stock Market Indices | ||||||||
| S&P 500 | 3,756.07 | 4,455.48 | 0.5% | 18.6% | neutral | up | up | |
| Dow Jones Industrials | 30,606.48 | 34,798.00 | 0.6% | 13.7% | down | up | up | |
| Dow Jones Transports | 12,506.93 | 14,343.49 | 0.5% | 14.7% | down | neutral | up | |
| NASDAQ | 12,888.28 | 15,047.70 | flat | 16.7% | neutral | up | up | |
| S&P/TSX Composite | 17,433.36 | 20,402.66 | (0.4)% | 17.0% | down (weak) | up | up | |
| S&P/TSX Venture (CDNX) | 875.36 | 876.13 | (1.2)% | 0.1% | down | down | up | |
| S&P 600 | 1,118.93 | 1,344.76 | 1.0% | 20.2% | neutral | neutral | up | |
| MSCI World Index | 2,140.71 | 2,362.56 | 0.3% | 10.4 | neutral | up | up | |
| NYSE Bitcoin Index | 28,775.36 | 42493.87 | (10.4)% | 47.7% | down | neutral | up | |
| Gold Mining Stock Indices | ||||||||
| Gold Bugs Index (HUI) | 299.64 | 230.39 (new lows) | (3.1)% | (23.1)% | down | down | neutral | |
| TSX Gold Index (TGD) | 315.29 | 265.00 (new lows) | (3.3)% | (16.0)% | down | down | neutral | |
| Fixed Income Yields/Spreads | ||||||||
| U.S. 10-Year Treasury Bond yield | 0.91 | 1.46% | 6.6% | 60.4% | ||||
| Cdn. 10-Year Bond CGB yield | 0.68 | 1.38% | 7.4% | 102.2% | ||||
| Recession Watch Spreads | ||||||||
| U.S. 2-year 10-year Treasury spread | 0.79 | 1.18% | 3.5% | 49.4% | ||||
| Cdn 2-year 10-year CGB spread | 0.48 | 0.88% | 8.0% | 82.3% | ||||
| Currencies | ||||||||
| US$ Index | 89.89 | 93.18 | 0.6% | 3.7% | up | up | down | |
| Canadian $ | 0.7830 | 0.7897 | 0.7% | 0.8% | down (weak) | down | up | |
| Euro | 122.39 | 117.21 | (0.1)% | (4.2)% | down | down | up | |
| Swiss Franc | 113.14 | 108.15 | 0.8% | (4.4)% | down | down | up | |
| British Pound | 136.72 | 136.75 | (0.4)% | flat | down | down | up | |
| Japanese Yen | 96.87 | 90.29 | (0.7)% | (6.8)% | down | down | down | |
| Precious Metals | ||||||||
| Gold | 1,895.10 | 1,751.7 | flat | (7.6)% | down | down | up | |
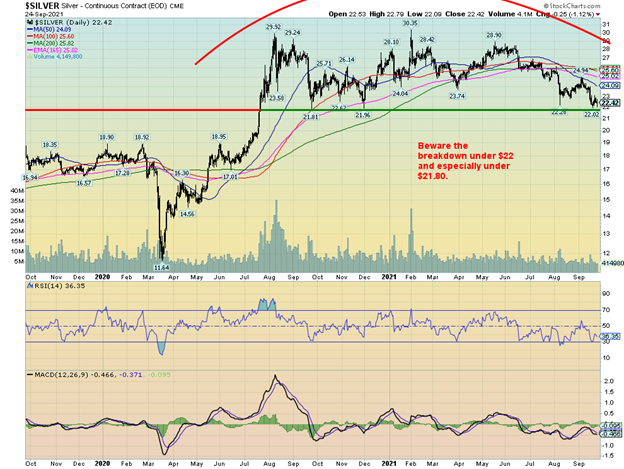
| Silver | 26.41 | 22.42 | 0.4% | (15.1)% | down | down | up | |
| Platinum | 1,079.20 | 979.90 | 5.3% | (9.2)% | down (weak) | down | neutral | |
| Base Metals | ||||||||
| Palladium | 2,453.80 | 1,951.10 | (1.7)% | (20.5)% | down | down | neutral | |
| Copper | 3.52 | 4.29 | 0.9% | 21.8% | down (weak) | neutral | up | |
| Energy | ||||||||
| WTI Oil | 48.52 | 73.98 | 3.0% | 52.5% | up | up | up | |
| Natural Gas | 2.54 | 5.20 | 1.8% | 104.7% | up | up | up |
New highs/lows refer to new 52-week highs/lows and in some cases all-time highs.
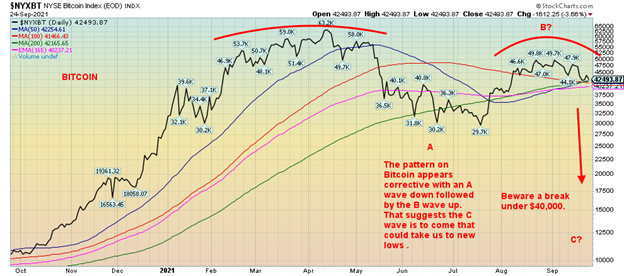
Recovery? Or just the bounce-back before another wave to the downside gets underway? Breadth was not impressive this week with apparently a negative 0.66:1 on Friday. Bullish percent indicators barely budged this past week despite the S&P 500 rising 0.5% this past week. The number of stocks trading over their 50-day and 200-day MA are falling, reflecting selling going on behind the scenes even as the markets were being held up by a few large-cap stocks. On the week, down volume exceeded up volume despite the gain for the index. To say that the rally has been tiring is not an understatement. The Dow Jones Industrials (DJI) rose 0.6%, while the Dow Jones Transportations (DJT) also rose up 0.5% but remains below its 200-day MA. The divergence between the DJI and the DJT widens. The NASDAQ was flat on the week. The small-cap S&P 600 was up 1%. For the most part, all the indices did this past week was rally back to the 50-day MA while retracing upwards of 61.8% of the first wave decline. A failure here would not be a surprise. Evergrande shook the market but the Fed’s taper and interest rate talk didn’t phase them and then when everyone thought Evergrande would pay up the market rallied. Bitcoin was beat up because of China’s ban on cryptos. Bitcoin fell a sharp 10.4% and is now quickly down 32% from its April high and down almost 15% from its high seen four weeks ago.
Elsewhere, the TSX Composite lost 0.4% and the TSX Venture Exchange (CDNX) dropped 1.2%. In the EU, the London FTSE was up 1.1%, the Paris CAC 40 gained 1.0%, while the German DAX was up 0.3%. In Asia, China’s Shanghai Index (SSEC) was flat despite Evergrande. We can only guess they expect a government save. The Tokyo Nikkei Dow (TKN) finally faltered, down 0.8%. The MSCI World Index was up about 0.3%.
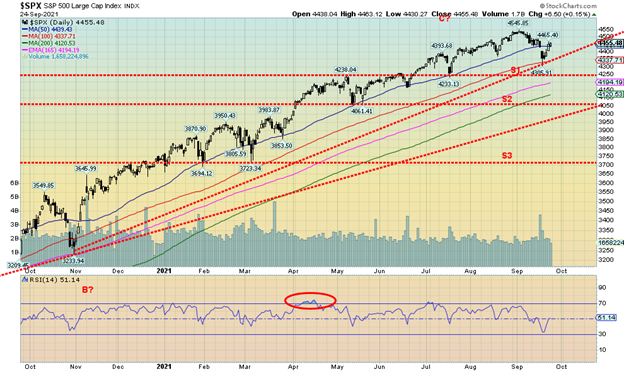
The S&P 500 has recovered roughly 61.8% of the decline from the high of 4,546. A rise above 4,490 on some expanding breadth would suggest to us that new highs lie ahead. A drop back under 4,300 would be negative and new lows would lie ahead. The save came in just below the 100-day MA (4,337). The 200-day MA is currently down near 4,120 and does not seem unreasonable for a decline to that level. That would give us a correction of about 10% which is our expectation at this time. Evergrande and the looming debt limit fight could play a role.
BITCOIN
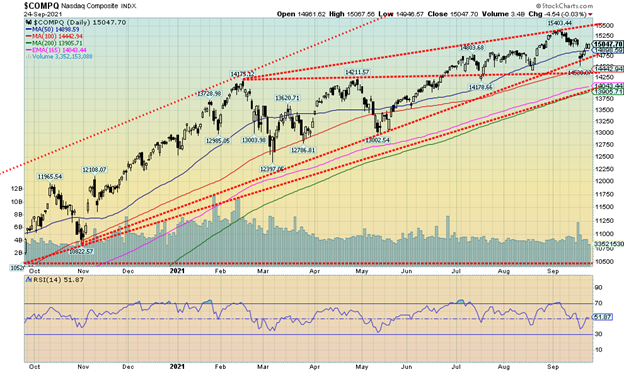
The NASDAQ was flat this past week after falling the previous week. Monday’s gap down opening was quickly filled the rest of the week. The NASDAQ tested an uptrend line but failed to close under that level. The FAANGs didn’t help. Facebook fell 3.2%, Apple was up 0.6%, Amazon lost 1.1%, Netflix gained 0.5%, and Google was up 0.9%. Microsoft lost 0.2%, Tesla gained 1.9%, and Twitter was a big winner, up 7.6%. The Chinese FANGs were hit with Bidu down 3.5% and Alibaba off 9.4%. Nvidia was up 0.8%. The NASDAQ fell roughly 6% on its first drop. The rebound has retraced roughly a Fibonacci 61.8% of the decline from 15,403 to 14,530. In theory at least, that should be it. As long as it stays under 15,200 the next wave down should take the NASDAQ to new lows. A test of the 200-day MA near 13,900 is not out of the question. The NASDAQ recovered to just above the 50-day MA and should find some resistance there. A firm drop back under 14,900 should signal the start of another wave to the downside.
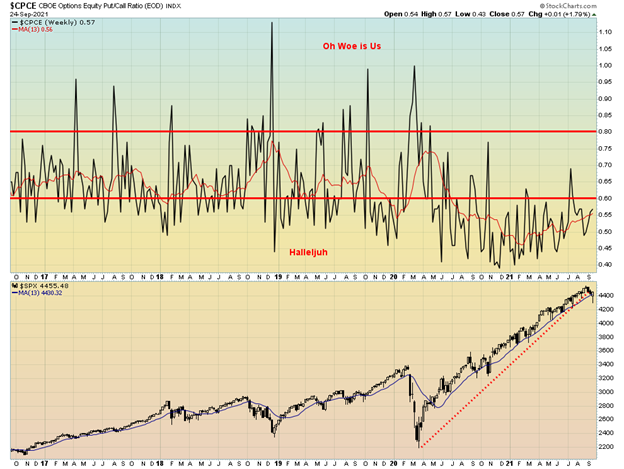
Well, if we are turning bearish, we are pretty slow to respond. This past week’s action didn’t move the dial much on the put/call ratio. It closed at 0.57 vs. 0.55 the previous week. The put/call ratio is jaggedly rising but remains mired in very bullish territory. We continue to wonder where the bears are.
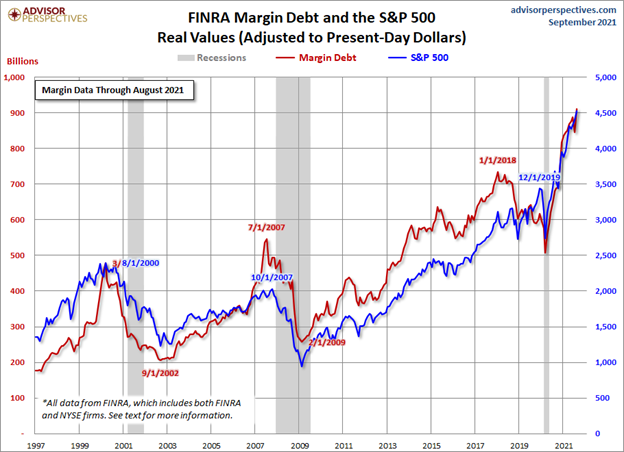
FINRA has released the August margin debt and it jumped almost 8% from July. It rose to a new high even as the S&P 500 was also rising to new highs. When one adjusts for inflation, the growth of margin debt has actually exceeded the growth of the S&P 500 by a considerable margin. Previous high levels of margin debt in 2000, 2007, and 2018 resulted in a considerable retraction over the next several months. The trouble is, we can’t say with any confidence when, only that it will happen. And, given the sharp rise over the past several months, we may be closer than we care to think.
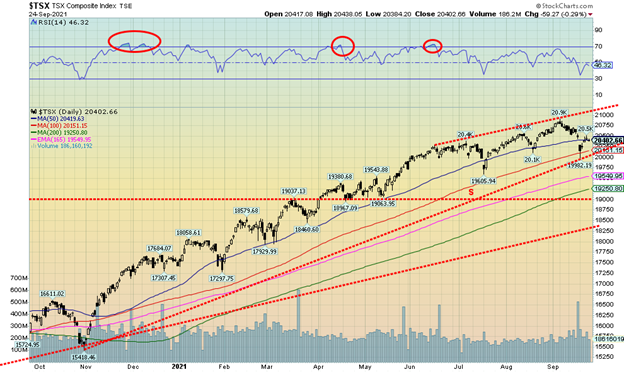
Evergrande helped push the TSX Composite lower this past week as it fell 0.4%. The TSX Venture Exchange (CDNX) did worse, down 1.2% and it is now up only 0.1% on the year. The TSX Energy Index (TEN) saved the day with a gain of 6.3%; otherwise, the loss would have been much larger. Only two other sub-indices saw gains on the week: Financials (TFS) +0.2% and Telecommunications (TTS) +0.2%. Leading the pack to the downside were Golds (TGD), down 3.3%, followed by Metals & Mining (TGM) -3.1%. Health Care (THC) -2.1%, Materials (TMT) -1.9%, Industrials (TIN) -1.3%, and Information Technology (TTK) -1.4% were the other significant losers. The TSX found support just below the 100-day MA, currently at 20,151. However, the subsequent rebound could be finding resistance at the 50-day MA 20,419 given the TSX closed at 20,402. A break of the recent low at 19,982 would ensure that the TSX is headed down towards the 200-day MA, currently near 19,250. That would be a roughly 8% correction from the recent high and is within our range of 8%–12% correction at this time. Further support can be seen down to 19,000. Regaining above 20,700 would be positive and suggest that new highs were possible.
U.S. 10-year Treasury Bond/Canadian 10-year Government Bond (CGB)
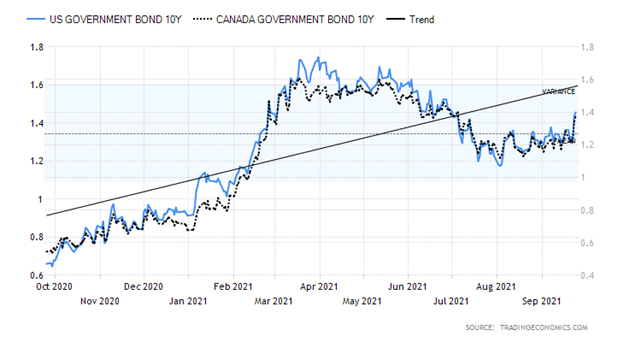
Concern that the Fed could start tapering before year end and raise rates into 2022, plus the rising risk of a government shutdown and possible default because of the current fight over the debt limit, sent the U.S. 10-year treasury note higher this past week to 1.46%. The move over 1.40% suggests we could go higher still. Over 1.50% would help confirm the break above 1.40%. If this is a fifth wave up for U.S. notes/bonds, then we should see yields rise above the March high of 1.74%. The brawl over the debt limit would do it. The DSI indicator reported to us by Elliott Wave International hit a recent high at 77% which is high for bonds. It has moved off that level now. There weren’t a lot of numbers to trade off of this past week. Housing starts for August came in just above as expected at 1.615 million vs. 1.554 million in July. Building permits for August rose 6% when they were expecting a decline of 1.8%. Existing home sales for August were 5.88 million about as expected and slightly under the 6 million in July. The Markit Manufacturing PMI for September was 60.5 vs. 61.1 in August. New home sales in August were 0.74 million, just above expectations and just above July’s 0.729 million. The disappointment came with the weekly initial claims that were 351,000 above last week’s 335,000 and above the consensus of 320,000. Things are starting to point to potential disappointment for the September job numbers due out October 8. Not a lot of notable numbers for next week. Durable goods orders, house price indices, the Conference Board’s Consumer Confidence Index, and the Chicago PMI are the most notable. The Fed’s John Williams (New York), Raphael Bostick (Atlanta), and Patrick Harker (Philadelphia) all speak next week. We are sure their speeches will be parsed carefully for clues.
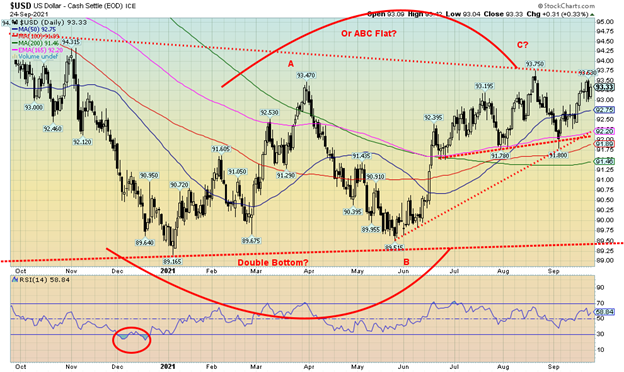
The US$ Index had a somewhat volatile week but ended up gaining just under 0.2%. The euro slipped about 0.1%, the Swiss franc may be portending a lower U.S. dollar, gaining 0.8%, the pound sterling lost 0.4%, while the Japanese yen dropped 0.7%. The Canadian dollar was a winner, up 0.7% thanks to higher oil prices. The US$ index hit a high of 93.53, shy of the earlier 93.75 high and above what we thought might be a left shoulder of a possible head and shoulders pattern at 93.20. At 93.53 the high was a bit more than we are comfortable with to call it a right shoulder. So that leaves the US$ Index open to many interpretations, even a double top possibility. Still, we believe the rally from 89.52 back in May unfolded in a double zig-zag pattern ABC-X-ABC. That’s corrective and not the start of a new upward wave. Until we break back down under 91.95 there remains potential to move to new highs above 93.75. It would appear as a breakout on the charts but it more likely would be a head fake. Under 92.75 could start a down wave.
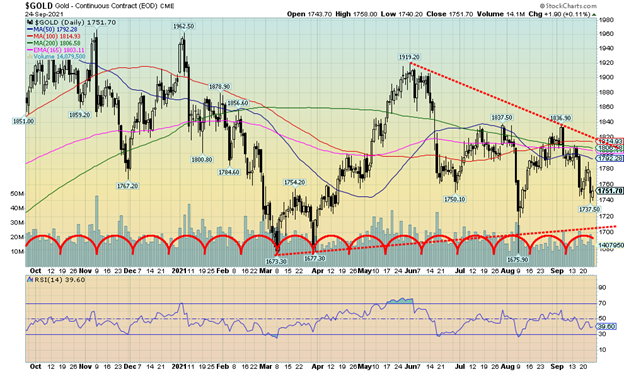
The good news is that gold prices held up this past week. The bad news is gold fell to a six-week low on Thursday before rebounding on Friday. Gold closed at $1,751.70, virtually unchanged from the previous week. We continue to approach what may be a short-term cycle low. We continue to believe that the March 2021 low at $1,673 was the 31-month cycle low. However, what we can’t tell is whether the run $1,919 was it for this current cycle and we will now face the larger 7.8 year and 23–25 cycles that could see gold fall to new lows once again. Few were spared this past week although silver managed to eke out a 0.4% gain and platinum was up a good 5.3%. However, palladium continued its woes, down 1.7% although copper was up 0.9%. Silver made new lows below its August low, but gold did not, a possible divergence. Gold was hammered over the confusion surrounding Evergrande as to whether it made payments or not and the Fed that hinted at interest rate hikes in 2022 and the wind-down of tapering before year end. Both are anathema to holding gold. According to Elliott Wave International (www.elliottwave.com), the DSI sentiment indicator for gold is now at 13% above the low of 10% seen earlier. That remains bearish and often signals a zone for a reversal. But we need evidence, something that has been sorely lacking. And we need gold to hold above $1,715 and especially above $1,700. Otherwise, all bets are off and we are headed lower. None of this is particularly supportive. The commercial COT improved (see next), but we need more than that. Regaining $1,780 would be a start, but above that we need to clear through $1,800 and $1,820–$1,835. Any rally up into that zone that fails would be bearish. Gold continues to be a hedge against inflation/deflation, against currency devaluations, and against geopolitical uncertainty and turmoil and a loss of confidence in government. However, the U.S. dollar has shown some strength of late and gold doesn’t seem to concerned right now about inflation or deflation. Geopolitical tensions are at least at a stalemate as are government tensions. Gold appears to be forming what might be a symmetrical triangle bottom. It is not an unusual pattern often see at both tops and bottoms although it can also be a consolidation pattern. Below $1,700 and the triangle breaks down with potential measuring implications to around $1450. Above $1,820 the triangle could break out with potential measuring implications to $2,061. It will be important to watch the direction of the breakout.
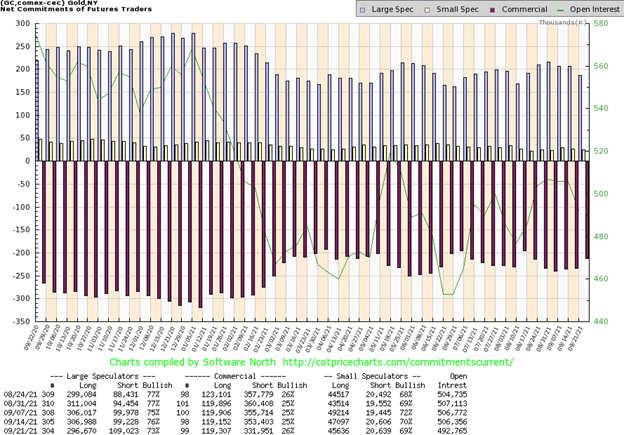
The gold commercial COT (bullion companies and banks) improved slightly this past week to 26% from 25%. The large speculators COT (hedge funds, managed futures, etc.) slipped to 73% from 76%. The commercial short open interest fell almost 22,000 contracts while long open interest was flat. For the large speculators, short open interest was up almost 10,000 contracts while long open interest dropped just over 10,000 contracts. This improvement for the commercial COT has to be viewed as at least slightly bullish, given it’s the best one seen in at least five weeks. The drop in the large speculators COT is also bullish as they are often caught the wrong way at significant tops and bottoms.
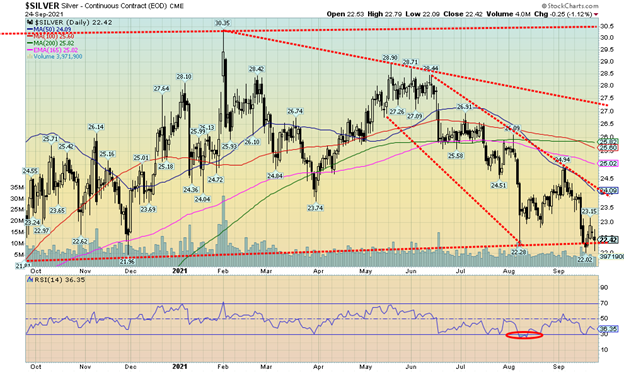
Silver ended the week marginally higher than where it was a week earlier. The gain was a small 0.4%. Short and intermediate trends remain down. Silver has fallen 15.1% in 2021 and is down 26% from its February high of $30.35. The low over the past week was $22.02 emphasizing the $22 support we have noted. Silver tried to rise this week, hitting as high as $23.15 but it could not hold on to the gain. Indicators are diverging with the price action meaning silver made a new low but indicators did not. According to Elliott Wave International they report that the DSI sentiment indicator is at 10% a level often associated with lows. However, it can go lower. I believe the lowest we ever saw was 6%. Note that silver made a new low below its August 2021 low but gold did not. Another divergence. The decline from the May high appears to be a zig-zag pattern; i.e., abc-x-abc. That’s a corrective move, not an impulse wave to the downside. Volume has been tailing off as we go lower. That suggests we are probing to see if there are any stops here, especially if we were to break under $22. Silver does not break out until we are over $24.10. After that the next major breakout zone is at $27. Under no circumstances can we say a low is in. We are encouraged by the improvement in the commercial COT noted next. However, that is not a guarantee of a bottom. Arguably, we could say we have been forming a huge topping pattern. A breakdown under $22 would not be good. Under $21.80 we could be falling to potential targets down to $13.50 and this downward drift could continue into December (see longer chart below). All this against supply shortages of silver. Silver has a fairly good record of 18–18.5-year cycle lows. The last one was seen in 2014–2015. The 18–18.5-year cycle can break down into two cycles of nine years or three cycles of six years. The March 2020 low came about five years after the 2014–2015 lows. That could satisfy the 6-year cycle low and the next one won’t be due until 2024–2026. However, that doesn’t rule out that February 2021 wasn’t an important top. For now, we need to hold $22 and especially above $21.80. And now we are little too close for comfort, regardless of high bearish sentiment.
Silver – Weekly Chart
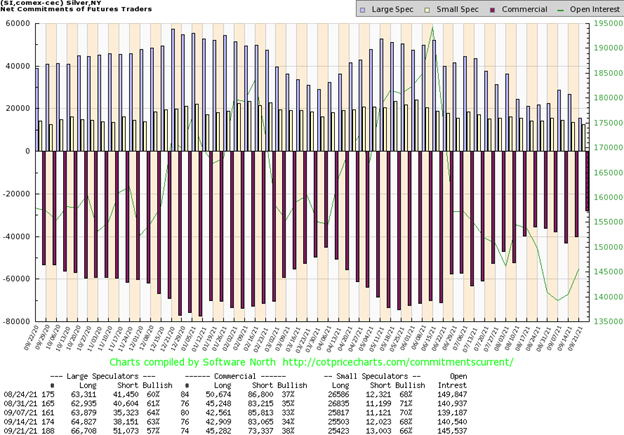
The silver commercial COT improved significantly this past week, jumping to 38% from 34%. Short open interest fell almost 10,000 contacts while long open interest rose roughly 2,500 contracts. This is a good improvement from the previous week and has silver’s commercial COT at the best level seen in months. The large speculators COT fell sharply to 57% from 63% as their short open interest position jumped almost 13,000 contracts, even as the long open interest was up about 2,000 contracts. Overall, we have to view this improvement in the commercial COT as at least mildly bullish. The large speculators are at their most bearish level seen in months.
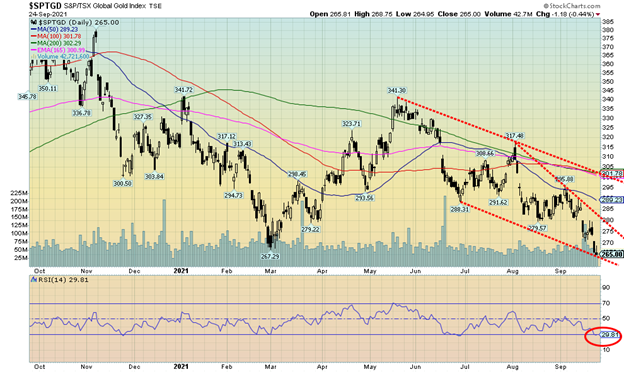
Downward pressure on the gold stocks continues. The TSX Gold Index (TGD) fell 3.3% this past week while the Gold Bugs Index (HUI) dropped 3.1%. Both fell to fresh 52-week lows. The TGD is now down 16.0% in 2021 and down 36.5% from the August 2020 high. However, the TGD is up about 53% from the March 2020 low. The HUI is down 23% in 2021—down over 38% from the August 2020 high and up almost 62% from the March 2020 low. The gold stocks are becoming quite extended. The RSI has slipped under 30. No, it is not a guarantee of a bottom, only that they are oversold. They could become even more oversold and move to even lower prices. The Gold Miners Bullish Percent Index (BPGDM) is at 20, the lowest level seen since March 2020. Again, it could go even lower. Notably, it fell to 0 back in December 2015. That turned out to be a major bottom. If prices were to bottom here, we could be forming a descending wedge triangle. However, that is not a given either, just because we drew it that way. In terms of patterns, Friday’s action may have left what looks like a gravestone doji on the charts. That is a pattern where the market opens low, rises during the day, and then falls again to close about where it opens. Usually, we see these at tops, not at a bottom. The Van Eck Vectors Gold Miners ETF (GDX) left a neutral-looking doji on its chart, suggesting instead a hesitation but not necessarily a bottom. So, we’ll see next week whether this has any meaning. There is a bit of a gap to fill between 271 and 273 for the TGD. The TGD breaks out above 280, suggesting we could at least go back to testing 300. However, a more serious breakout doesn’t happen until we break out over 300. How low could we go? The next level of support is 250/255 for the TGD. We are over 12% under the 200-day MA a level that also suggests we should at least see a bounce. There are positive divergences in a number of weekly indicators, meaning that prices are making new lows but the indicators are not.
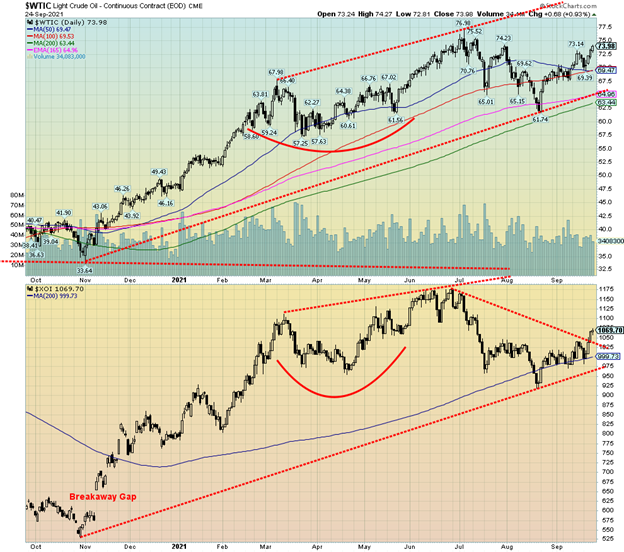
Oil prices jumped for the third week in a row as supply disruptions led to tighter supply. WTI oil gained 3.0% this past week, rising to almost $74. Natural gas (NG) was also up this time 1.8% but fell short of a new 52-week high. The energy stocks were the stars on the week for the stock markets as the ARCA Oil & Gas Index (XOI) jumped 4.6% and the TSX Energy Index (TEN) did even better, up 6.3%. Both have broken out to higher levels, suggesting that there could be more to come.
Despite the gains, WTI oil and the energy indices remain under their highs seen earlier in June/July. Seasonally, the best time for energy prices and stocks is December to June while the July to November period is usually seen prices soften. So far, everything is going according to script. The current run-up is because of the hurricane season that has resulted in shut-ins in the Gulf of Mexico. With potentially more storms on their way, the upward pressure could persist. Besides the disruptions in the Gulf, the OPEC countries are not increasing production to offset shortages elsewhere. They are enjoying refilling their coffers once again. Russia’s bank accounts are brimming because of the rise in prices as an example. Saudi Arabia is able to add to its Rolls Royce fleet (okay, just kidding).
If there is a danger for this current rise in prices, it is that they stall out before making new highs, and then turn down again. That could set up the potential for a double top. New highs above $77 for WTI Oil and above 1175 for the XOI would continue the rally and suggest that WTI oil could reach $80 or higher. The move from the high in late June to the low in August fell in an ABC pattern, suggesting it was corrective in nature.
The spread between WTI oil and Brent Oil widened this past week to around $4, the highest differential seen since March 2021.
__
(Featured image by Chris Liverani via Unsplash)
DISCLAIMER: This article was written by a third party contributor and does not reflect the opinion of Born2Invest, its management, staff or its associates. Please review our disclaimer for more information.
This article may include forward-looking statements. These forward-looking statements generally are identified by the words “believe,” “project,” “estimate,” “become,” “plan,” “will,” and similar expressions. These forward-looking statements involve known and unknown risks as well as uncertainties, including those discussed in the following cautionary statements and elsewhere in this article and on this site. Although the Company may believe that its expectations are based on reasonable assumptions, the actual results that the Company may achieve may differ materially from any forward-looking statements, which reflect the opinions of the management of the Company only as of the date hereof. Additionally, please make sure to read these important disclosures.
David Chapman is not a registered advisory service and is not an exempt market dealer (EMD) nor a licensed financial advisor. We do not and cannot give individualised market advice. David Chapman has worked in the financial industry for over 40 years including large financial corporations, banks, and investment dealers. The information in this newsletter is intended only for informational and educational purposes. It should not be considered a solicitation of an offer or sale of any security. Every effort is made to provide accurate and complete information. However, we cannot guarantee that there will be no errors. We make no claims, promises or guarantees about the accuracy, completeness, or adequacy of the contents of this commentary and expressly disclaim liability for errors and omissions in the contents of this commentary. David Chapman will always use his best efforts to ensure the accuracy and timeliness of all information. The reader assumes all risk when trading in securities and David Chapman advises consulting a licensed professional financial advisor before proceeding with any trade or idea presented in this newsletter. David Chapman may own shares in companies mentioned in this newsletter. We share our ideas and opinions for informational and educational purposes only and expect the reader to perform due diligence before considering a position in any security. That includes consulting with your own licensed professional financial advisor.


Bitcoin Stalls Near $60K as Strategy Moves, ETFs Outflow, and EU MiCA Rules Take Effect
Bitcoin hovers near $60,000 with ETF outflows, while Strategy boosts reserves, sells BTC, and raises dividends to reassure investors. Ethereum...


Cannabis Dominates Global Drug Use: Trends, Risks, and Shifting Markets
Cannabis remains the world’s most widely used illicit drug, with 256 million users in 2024, surpassing all others combined. Growth...


Italy Approves First Hydrogen-Powered Train for National Rail Network
ANSFISA has approved Italy’s first hydrogen-powered train, the Alstom HMU214, for use on the Brescia–Iseo–Edolo line. Capable of 140 km/h,...


Cotton Market Weakness Persists Despite Brief Rebound
Cotton prices fell to new lows last week before a modest rebound. USDA data shows crop conditions remain worse than...


Eli Lilly Hits $1 Trillion Valuation Amid Strong Bullish Momentum
Eli Lilly stock hit a record high, surpassing $1 trillion market value after strong product demand. Shares surged over 7%,...
 |
|
 |  |
 |
|
-

 Impact Investing2 weeks ago
AI Adoption in Italian Retail Stalls Despite Strong Experimentation
-
 Cannabis21 hours ago
Cannabis Dominates Global Drug Use: Trends, Risks, and Shifting Markets
-

 Impact Investing7 days ago
EU Weighs More Free Emission Permits in ETS Review to Boost Industry Competitiveness
-

 Impact Investing2 weeks ago
SBTi Net-Zero Standard 2.0 Enhances Corporate Climate Action