Featured
A Look at Inflation and How Will Affect the Stock Markets
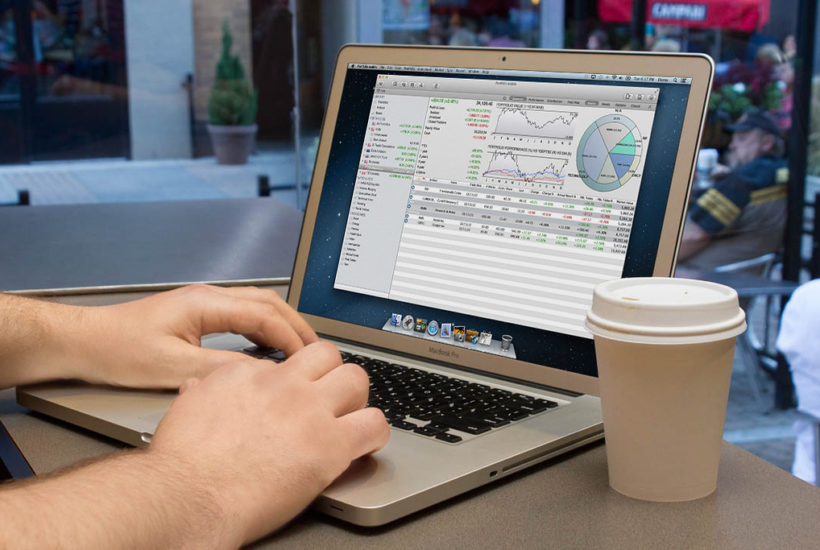
Inflation. It is on the tip of everyone’s tongue these days. Even hyperinflation although the use of the word hyperinflation is more like hyperventilation. If inflation persists interest rates could rise, the stock market could stumble but gold and commodities could rise. Our Chart of the Week is actually three charts and all have a longer term look at inflation.
Inflation in the U.S. just hit a 30-year high. The October month-over-month inflation rate was 0.9%, well above the expected 0.5%. As a result, the year-over-year inflation rose 6.2% above the forecast for 5.7%. Core CPI (less food and energy) rose 4.6% vs. the expected 4.1%. The result is that interest rates are now sharply negative to the rate of inflation. The U.S. 10-year treasury note was trading at 1.57% for a negative spread of 4.63% to the CPI and a negative spread of 3.03% to the core CPI.
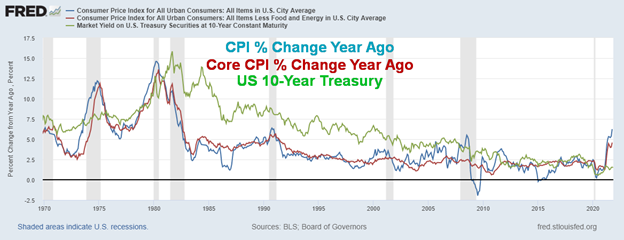
For the CPI it is the highest monthly level reported since a 6.4% reading in October 1990. Unlike today, however, the U.S. 10-year was trading then at 8.82%. The negative spread between the CPI and the U.S. 10-year is a record, higher today than during the 1970s, a period that saw the inflation rate reach a peak of 14.6% in April 1980.
Naturally, the high inflation number will bring out those screaming hyperinflation. They may have a point if inflation were to start to exceed levels seen during the 1970s. However, there is little argument that the year-over-year rate of 6.2% and the core CPI (which the Fed pays more attention to) of 4.6% are exceeding central bank targets of 2–3%. The question is, will inflation prove to be more than just transitory? Inflation is now beginning to look at least a little persistent.
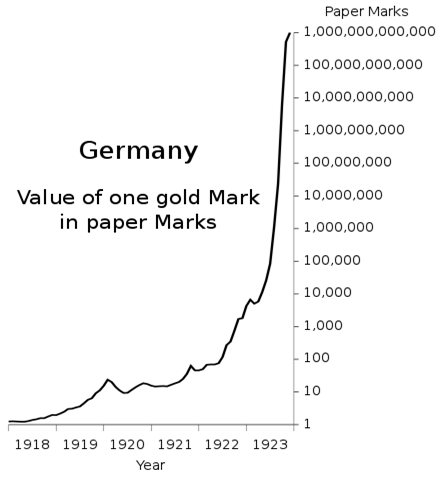
As to hyperinflation, well, we are far from that. The conventional definition of hyperinflation is 50% per month. In Hungary after World War II from 1945–1946 the daily inflation rate was 207%. In Zimbabwe from 2007–2008 the daily inflation rate was 98%. A third example was Yugoslavia following the breakup in 1992–1994 when inflation hit 64.6%, causing prices to double every 1.4 days. Then there was the most famous hyperinflation of all time: Weimar Germany in 1921–1923 where prices at their most severe in 1923 were doubling every 49 hours. That’s hyperinflation. What we have is hyperventilation, not hyperinflation. Perspective is everything. But it doesn’t stop those who call it hyperinflation.
This is What Hyperinflation Looks Like! Weimar Republic 1921–1923
Still, inflation is nothing to dismiss. During periods of inflation, bond yields tend to rise and eventually the monetary authorities start to (belatedly) hike interest rates. The stock market tends to underperform. Gold and commodities tend to outperform. This is what happened during the inflationary 1970s. Oh yes, the inflationary 1970s. Treasury Secretary Janet Yellen, who is also a former Chair of the Federal Reserve, is on record saying that “the Fed will not allow 1970s inflation to return”.
Maybe she is referring to the appointment of Paul Volker as the Chair of the Federal Reserve in August 1979 replacing William Miller. Mr. Volker promptly did a U-turn on how inflation was being handled and with inflation running at 14.8% he jacked the key Fed rate to 20%. The result was inflation was wrestled to the ground, but what followed was the extremely steep recession of 1980–1982 that actually lingered until at least 1985. Gold, which had soared to $875 by January 1980 crashed to $300 by 1985. The stock market made its final low in August 1982 and was off to new heights over the next 18 years, culminating in the high-tech/ dot.com bubble of the late 1990s. The current inflation is at a 31-year high, not a 40-year high. However, as we have noted, the Fed rate in 1990 was 8%, not 0.08% as it is today.
Inflation is best when no one really notices it. When inflation becomes noticeable as it is today, then it has the potential to cause monetary, political, and social problems. If inflation persists, the Fed may have to start hiking interest rates sooner than they planned. Some are now calling for hikes at least by July 2022 and three by the end of 2022. The Fed is already getting its taper underway and by next June there will be no taper left to do. So, do the daily reverse repos also come to a halt? So far, we’ve seen nothing.
But the reality is the spreads have never been as wide as they are now. With the official Fed rate at 0%–0.25%, the spread to inflation is an incredible 6%. It was never that wide during the 1970s. So, is there a Paul Volker waiting in the wings to become Fed Chair? The term for the current Chair, Jerome Powell, ends in February 2022. Janet Yellen has supported reappointing him. So, what would that mean? Continuing the same policies? Or should an inflation fighter be brought in?
Rising inflation is a political problem for the Biden administration and the Trudeau administration here in Canada. While they may say that inflation is a problem for people’s pocketbooks, the question is how much can they actually do? They can’t force down oil prices. It’s the job of the central banks to hike interest rates, something that could also cause a problem of a different sort. They may be trying to clear backlogs at ports, but they aren’t the ones who unload them and there is a limited amount they can do about labour shortages. There is little they can do about supply constraints as well given the global economy is intertwined. Certain goods are seeing empty shelves. It becomes a social problem if it sparks higher wages, thus triggering a wage-price spiral. Many are unable to keep up with inflation, thus triggering potential homelessness and further inequality.
The biggest contributors to the rise in inflation are energy, used cars and trucks, and food. We could also add medicine and rent to the list. Inflation is perking up more than it has over the past 30 years. Rising rents are a problem, suggesting that inflation could be more persistent. The economic rebound, while mixed overall, has been strong in the U.S. and even Canada, fueled by stimulus cheques. But what happens when the stimulus cheques stop?
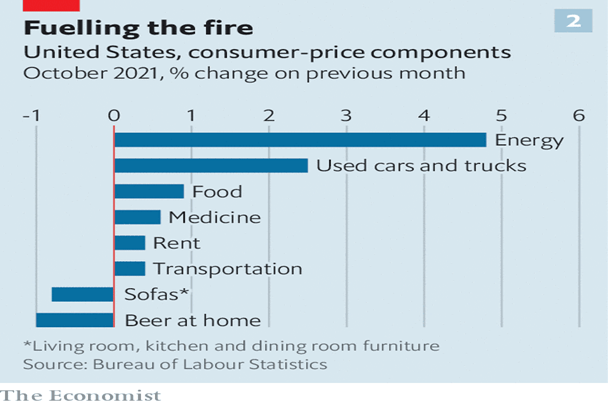
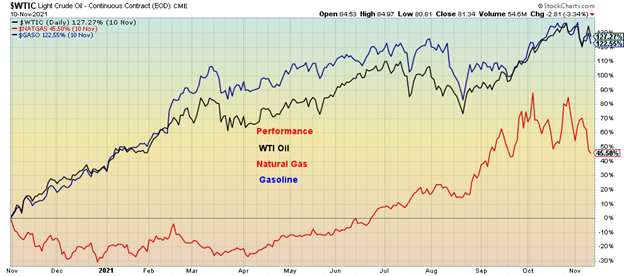
Used cars and trucks are feeling the pinch because of supply shortages of semi-conductors for new cars. With fewer new cars available, the demand for used cars and trucks has gone up. Apparently, they are 26% higher than a year ago. Gasoline prices are 123% higher as the price of oil has leaped 127% over the past year. Natural gas prices are 115% higher from lows seen in December 2020 although they have come down off their highs.
Price Performance WTI Oil, Natural Gas, Gasoline Nov 2020–Nov 2021
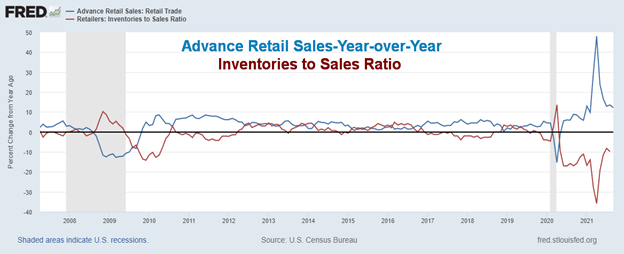
Surging retail sales have sparked shortages. The latest retail sales showed they jumped over 12% in the past year. However, the inventories to sales ratio is down almost 10%. Stimulus cheques sparked a rush in buying, much of it through retailers such as Amazon and delivered by the same as well as UPS and FedEx. Sales employing minimal human contact. As well, many of the goods were imported, helping to spark the record trade deficits. Never before had there been such a leap in retail sales. But inventories have been falling. The result is retailers don’t have a lot on the shelves going into the Christmas season and the rush for more goods that are experiencing shortages is sparking price increases. Apparently, retailers have barely a month of inventories.
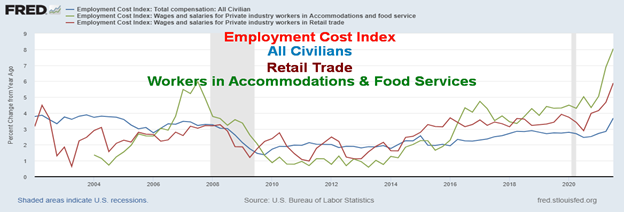
And this feeds on itself as the retailers need more staff and are having to pay higher wages to attract them. Notice the big jump in the past year for the Employment Cost Index. This one covers all civilians, the wages and salaries of all civilians and centers on the cost of workers in the accommodation and food industries. The latter has jumped 8% in the past year to Q3. For retail trade, their wages and salaries are up 5.9%. For all civilians it is 3.7%. All are probably higher now. The same is being seen for health care and education workers as well, plus a host of other workers to varying degrees.
Employment Cost Index 2002–2021
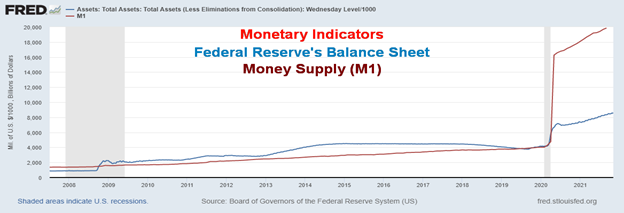
The big growth has been in some of the monetary indicators. Below shows the massive growth of the Fed’s balance sheet and money supply (M1), particularly since the pandemic got underway in 2020. The Fed’s balance sheet has grown since March 2020 by almost $4.4 trillion or 106%. Money supply (M1) has exploded even more, up $15.6 trillion or 364%. Not shown is the U.S. Federal Debt that has grown by $5.7 trillion or 24.7%. All of this contributes to monetary inflation. It’s no surprise then that the stock market (S&P 500) is up 112% from the pandemic depths of March 2020. Loan growth has been sluggish. All that money has to go somewhere. The stock market and savings have grown while consumers have to some extent been paying down debt.
Monetary Indicators – Fed Balance Sheet, M1 2008–2021
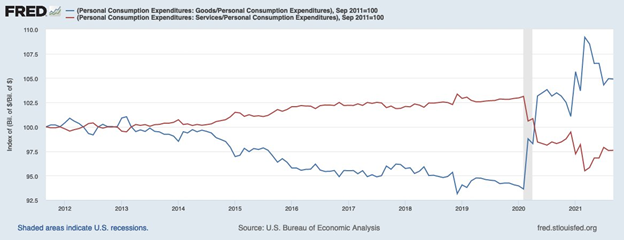
The surge in goods buying, accompanied by a big drop in services buying, helps explain why there are bottlenecks and disruptions. The chart below shows the 10-year relationship between the two. Note the surge in goods expenditures (blue line) vs. the drop in services expenditures (red line). Since March 2020 goods consumption has soared while services (restaurants, concerts, theatre, travel, etc.) has dropped sharply, although it is starting to pick up. This puts price pressure on the goods consumption side.
With inflation picking up and showing signs that it may not be as transitory as some would like coupled with the Fed tapering, it is no surprise that gold and silver have perked up. Sometime back we had noted that gold could be a classic “sell the rumour” (the Fed is going to taper) and “buy the news” (the Fed tapered). Since November 3 when the Fed announced the taper, gold has jumped $140 or 8.2% while silver is up over $2 or 9.4%.
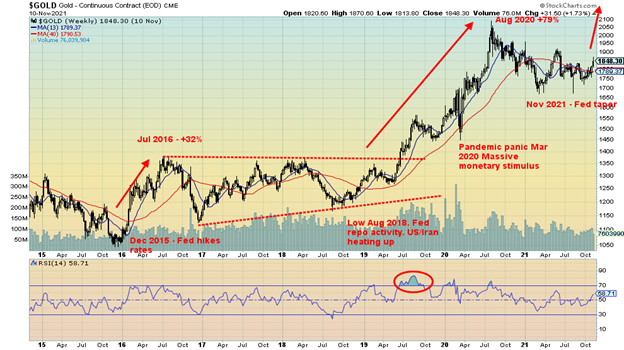
We are reminded of 2015/2016 when gold fell to a low $1,045 on rumours that the Fed was going to hike interest rates. In December 2015 the Fed announced its first interest rate hike since the financial crisis of 2008. Gold and silver took off and over the next six months gold rose over $300 or 31.8% while silver jumped $7.60 or 55.9%. A comparable move today could carry gold to $2,270 and silver to $36. The gold stocks as represented by the TSX Gold Index (TGD) also jumped, gaining 120%. A comparable move today could carry the TGD to 590.
Throughout history, gold has acted as a hedge against inflation, deflation, and geopolitical and macroeconomic uncertainty. It also acts as a portfolio diversifier and is negatively correlated to stocks and bonds. Since peaking in August 2020, gold has been in a corrective downtrend. Gold has underperformed and is under-owned. That may be about to change as inflation surges and macroeconomic uncertainty looms. There is also growing domestic political uncertainty and tensions (deep political polarization in the U.S. and elsewhere, January 6 committee, etc.) as well as geopolitical tensions (U.S./China/Russia). The next FOMC meeting on December 14–15, 2021 could prove to be quite interesting for a lot of reasons.
Chart of the Week
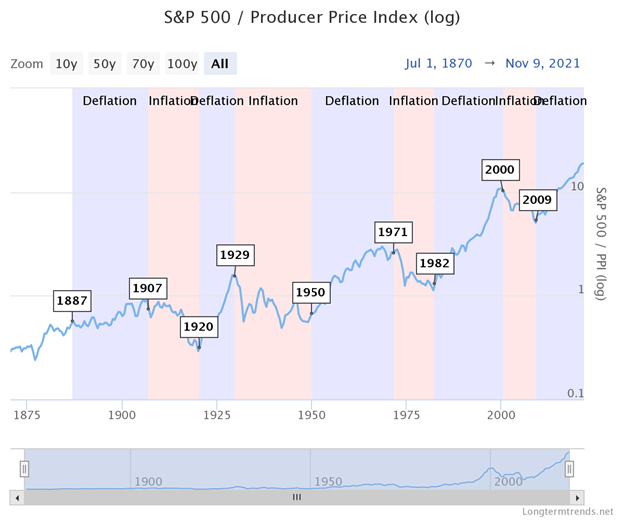
In keeping with our inflation theme, we found this very long-term chart of the S&P 500 relative to the Producer Price Index (PPI) of interest. The PPI can, in this case act as a proxy for commodities. Over the very long term the chart does confirm that stocks do outperform commodities. But then commodities do cover a wide range. There are two broad categories: hard and soft. Hard categories consist of two types—metals (precious and base) and energy. Softs are agriculture (wheat, coffee, soybeans, sugar, corn, cocoa, cotton, orange juice) and livestock (cattle, pork). All of these products trade on primarily four exchanges: the Chicago Mercantile Exchange (CME), New York Mercantile Exchange (NYMEX), Intercontinental Exchange (ICE), and London Metal Exchange (LME). While there are numerous exchanges in other countries on six continents, they are not as well known.
Stocks and commodities are for the most part negatively correlated. The two act differently during the credit cycle. What is interesting is the study above found that, generally speaking, periods of inflation and deflation follow roughly 18-year cycles. However, periods of deflation and inflation are not equal. Since 1887 the chart shows four periods of deflation (not counting the current one) and four periods of inflation. The deflationary years averaged 22 years while the inflationary years averaged 13.5 years. The average of the two was 17.75 years. The longest deflationary period was 21 years (1950–1971) while the longest inflationary period was also 21 years (1929–1950). The shortest deflationary period was nine years (1920–1929), and the shortest inflationary period was also nine years (2000–2009). The current deflationary period has been ongoing now for 12 years (2009–2021). But, given the recent rise in inflation, could we be entering an inflationary period?
Periods of deflation are characterized by a boom in stocks and generally sound money; i.e., the gold standard of 1879, Bretton Woods after World War II. Periods of inflation include inflationary events like Roosevelt’s revaluation and nationalization of gold in 1934 and Nixon closing the gold window in 1971. Inflationary periods are also characterized by war—World Wars I and II, Vietnam, Iraq/Afghanistan.
None of this is to suggest that we are about to enter a period of inflation. So far, they are calling inflation transitory, although many believe it will persist. Nor has there been any suggestion that gold might once again play a role—despite gold having a long history of providing sound money and having been used as money and currency for 5,000 years, that central banks continue to hold gold, and that the Basel III pegs gold as a Tier 1 asset for banks’ capital requirements.
One thing is for certain, however, and that is the purchasing power of the U.S. dollar just keeps on going down. This is what inflation does.
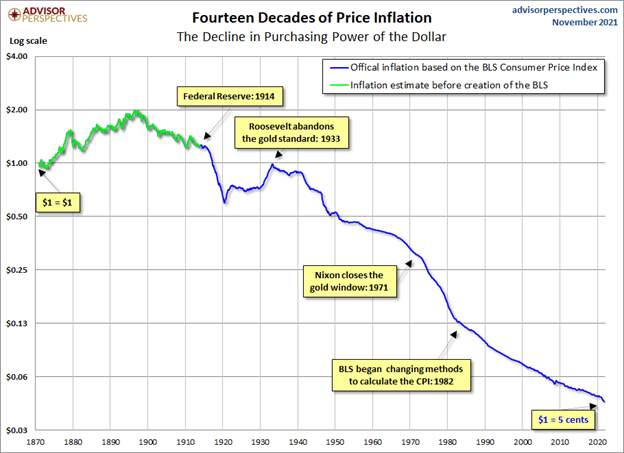
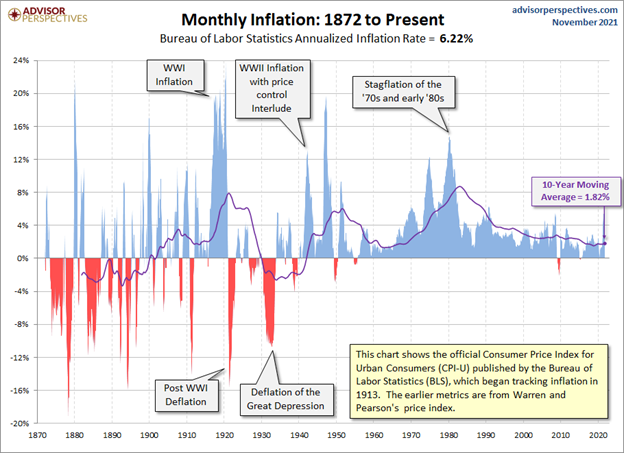
Our last inflation chart from Advisor Perspectives (www.advisorperspectives.com) shows monthly inflation going back to 1870. With a 10-year moving average of 1.82%, the current rate of inflation at 6.2% exceeds that. Again, the argument is: is inflation transitory or is this something that is going to persist going forward? We’ll get a better sense when we see the November CPI and PPI numbers. And as we noted before, the December 14–15 FOMC meeting is shaping up to be potentially very interesting.
MARKETS AND TRENDS
| % Gains (Losses) Trends | ||||||||
| Close Dec 31/20 | Close Nov 12/21 | Week | YTD | Daily (Short Term) | Weekly (Intermediate) | Monthly (Long Term) | ||
| Stock Market Indices | ||||||||
| S&P 500 | 3,756.07 | 4,682.85 | (0.3)% | 24.7% | up | up | up | |
| Dow Jones Industrials | 30,606.48 | 36,100.31 | (0.6)% | 18.0% | up | up | up | |
| Dow Jones Transports | 12,506.93 | 16,759.85 | (0.5)% | 34.0% | up | up | up | |
| NASDAQ | 12,888.28 | 15,860.96 | (0.7)% | 23.1% | up | up | up | |
| S&P/TSX Composite | 17,433.36 | 21,768.53 (new highs) | 1.5% | 24.9% | up | up | up | |
| S&P/TSX Venture (CDNX) | 875.36 | 1,023.07 | 3.9% | 17.0% | up | up | up | |
| S&P 600 | 1,118.93 | 1,455.51 | (0.7)% | 30.1% | up | up | up | |
| MSCI World Index | 2,140.71 | 2,378.42 | (0.7)% | 11.1% | up | up | up | |
| NYSE Bitcoin Index | 28,775.36 | 63,125.27 (new highs) | 3.7% | 119.4% | up | up | up | |
| Gold Mining Stock Indices | ||||||||
| Gold Bugs Index (HUI) | 299.64 | 278.09 | 7.4% | (7.2)% | up | neutral | up (weak) | |
| TSX Gold Index (TGD) | 315.29 | 306.06 | 7.5% | (2.9)% | up | neutral | up (weak) | |
| Fixed Income Yields/Spreads | ||||||||
| U.S. 10-Year Treasury Bond yield | 0.91 | 1.57% | 8.3% | 72.5% | ||||
| Cdn. 10-Year Bond CGB yield | 0.68 | 1.67% | 5.0% | 145.6% | ||||
| Recession Watch Spreads | ||||||||
| U.S. 2-year 10-year Treasury spread | 0.79 | 1.05% | flat | 32.9% | ||||
| Cdn 2-year 10-year CGB spread | 0.48 | 0.68% | 1.5% | 41.7% | ||||
| Currencies | ||||||||
| US$ Index | 89.89 | 95.13 (new highs) | 0.9% | 5.8% | up | up | neutral | |
| Canadian $ | 0.7830 | 0.7966 | (0.8)% | 1.7% | down | neutral | up (weak) | |
| Euro | 122.39 | 114.43 | (1.1)% | (6.5)% | down | down | neutral | |
| Swiss Franc | 113.14 | 108.58 | (1.0)% | (4.0)% | neutral | neutral | up | |
| British Pound | 136.72 | 134.19 | (0.5)% | (1.9)% | down | down | up | |
| Japanese Yen | 96.87 | 87.79 | (0.5)% | (9.4)% | down | down | down | |
| Precious Metals | ||||||||
| Gold | 1,895.10 | 1,868.50 | 2.9% | (1.4)% | up | up | up | |
| Silver | 26.41 | 25.35 | 4.9% | (4.0)% | up | neutral | up | |
| Platinum | 1,079.20 | 1,089.20 | 5.2% | 0.9% | up | down (weak) | up | |
| Base Metals | ||||||||
| Palladium | 2,453.80 | 2,117.70 | 4.4% | (13.7)% | up | down | neutral | |
| Copper | 3.52 | 4.45 | 2.5% | 26.4% | up (weak | up | up | |
| Energy | ||||||||
| WTI Oil | 48.52 | 80.79 | (0.6)% | 66.5% | up (weak) | up | up | |
| Natural Gas | 2.54 | 4.79 | (13.2)% | 88.6% | down | up | up |
Source: www.stockcharts.com, David Chapman
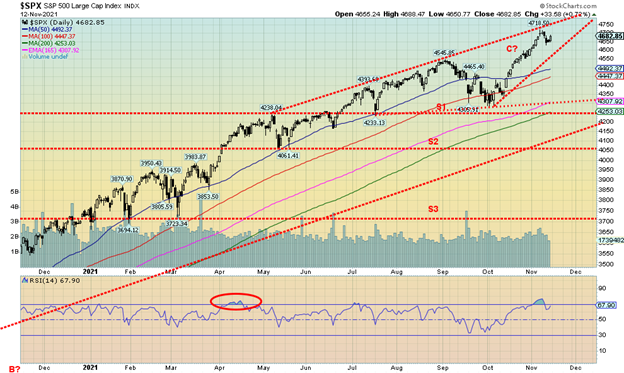
For the moment, the string of new all-time highs is on pause once again. It was correction week. The S&P 500 fell a small 0.3% while the Dow Jones Industrials (DJI) dropped 0.6% after making new all-time highs on Monday. Is this a reversal? The Dow Jones Transportations (DJT) was off 0.5% and the NASDAQ fell 0.7%. The catalyst was the higher-than-expected inflation numbers. However, the markets gained on Friday, saving what might have been a deeper drop. There is a growing realization that, despite the higher inflation numbers, interest rates are not going to rise anytime soon, and that is music to the stock market. The charts continue to look mixed, with some suggesting they could go higher and others like the S&P 500 above appearing to form an ascending wedge triangle which is bearish. The S&P 600 small-cap didn’t buck the trend, falling 0.7%. The S&P 500 Equal Weight Index SPXEW did gain about 0.2%, so maybe there remains hope for the markets yet. The Wilshire 5000 made new all-time highs before closing down 0.3%. We note as well that the Russell 2000 made all-time highs this past week as well before closing down 1.0%.
Elsewhere, not everyone followed the U.S. markets down. Canada’s TSX Composite made new all-time highs again, rising 1.5%. The TSX Venture Exchange (CDNX) rose 3.9%. In the EU, the London FTSE was up 0.5%, the Paris CAC 40 hit new all-time highs, up 0.7%, and the German DAX was up 0.3%. In Asia, China’s Shanghai Index (SSEC) rose 1.4% but the Tokyo Nikkei Dow (TKN) was effectively flat on the week. The MSCI World Index fell 0.7% on the week. Bitcoin enjoyed another good up week with a gain of 3.6% and even hit a record level once again near 69,000. We discuss Bitcoin further on.
Our expectation here is that the markets could rise to new heights once again. Despite the inflation scare and the Fed tapering there is still a lot of money sloshing around in the hands of the banks and big funds, hedge funds, etc. As well, the market realizes that the Fed is caught between a rock and hard place regarding interest rates. They hike interest rates at the peril of tipping the economy over into recession. With no timeline in sight for interest rate hikes—although many expect them by mid-2022—low negative interest rates are music to the stock market. Looming, however, as we have noted, is the FOMC of December 14–15. Naturally, we need to see new highs once again, possibly as early as this week and the S&P 500 must hold above 4,600. If we break that level the S&P 500 could be breaking an ascending wedge triangle and project down towards 4,200.
But signs of mania continue. A new company Rivian (RIVN), an electric vehicle company, debuted this past Wednesday and by Friday the stock was up 67% in only three days. Rivian is now the biggest U.S. company by market cap with no revenue. That’s mind-boggling. But with markets not really giving us any sell signals the mania could continue. The NYSE advance/decline line continues to make records and while the put/call ratio and the VIX Volatility Index remain positive, there are only small negative divergences so far. Ditto for the bullish percent indices. Yes, there are some negative divergences but those can continue for some time.
Break points are more important. Daily, weekly, and monthly lows are key. When markets break previous lows, then the odds favour further declines. For the S&P 500 the last daily low to watch was at 4,525. The last key weekly low was at 4,280 and the monthly low also at 4,280. 4,280 becomes the ultimate line in the sand. Below that level a bigger decline could get underway.
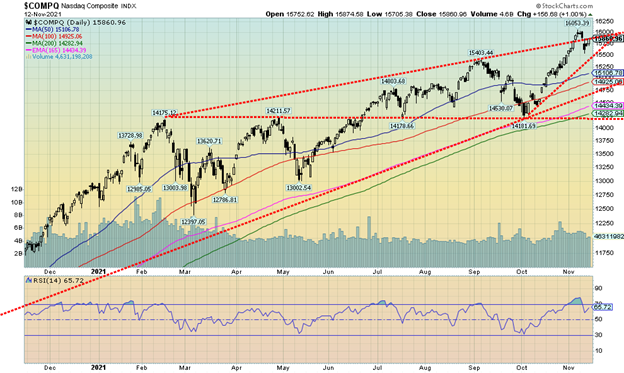
The NASDAQ followed the other indices lower this past week, losing 0.7%. In doing so the NASDAQ fell back under our possible breakout line of a possible ascending triangle. The drop also cooled the market as overbought levels over 70 RSI fell back to just under 66. Friday’s 1% gain, however, bodes well going into the coming week. The FAANGs that dominate the NASDAQ were mixed, with winners and losers. The big loser was Tesla, falling 15.4% on the week following Elon Musk declaring he was going to sell stock. Apparently, he did, up to $5.7 billion or 5.1 million shares. Apparently, much of this stemmed from stock options that mature in the coming year that he had to exercise. Except those options, 22.8 million of them, were at $6.24 vs. the stock trading at over $1,000. That’s a lot of potential taxes at 50% or roughly $15 billion. Okay, chump change for a man worth an estimated $300 billion. Other FAANGs were as follows: Facebook (Meta) down 0.1%, Apple down 0.9%, Amazon +0.3%, Netflix +5.7%, Microsoft +0.2%, Twitter -1.7%, Baidu +7.9%, Alibaba +5.0%, and Nvidia +2.2% making new all-time highs.
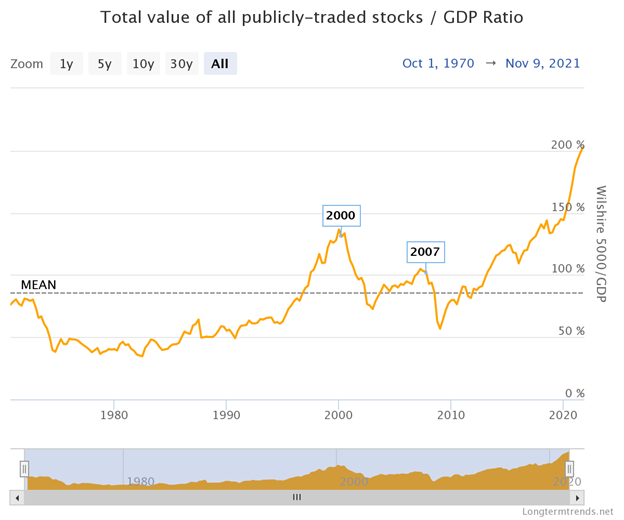
Warren Buffett loves it. As to everyone else? Meh! Buffett has called Market Cap to GDP “probably the best single measure of where valuations stand at any given moment.” To capture the market cap of as much of the market as possible, the numerator is the Wilshire 5000 Index. Today’s valuation at roughly 200% makes the peak at the time of the dot.com bubble and the housing bubble that triggered the 2008 financial crisis look puny even irrelevant. Clearly investors just don’t care and are ignoring the potential risks. But with inflation rising they have to at least start to think about it. What’s key, of course, is the Fed and as long as the Fed doesn’t hike interest rates the motto is “buy, buy, buy.” But what happens if they do? Again, more importance now on that December 14–15 FOMC meeting.
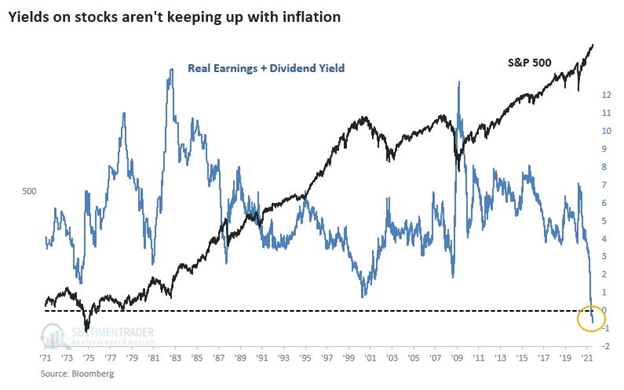
This is an interesting chart. It is telling us that stock markets are producing a negative total earnings yield for the first time ever, or at least from 1971. This chart is from Bloomberg (www.bloomberg.com) and suggested by Jonathan Baird of the Global Investment Letter (www.globalinvestmentletter). Total earnings return on equities (inverse of PE ratio plus dividends) is negative. This has happened because of a prolonged period of negative interest rates and record valuations in the stock market. As Baird suggests, either interest rates have to go up or the stock market has to fall—or a combination of both, which is the most likely outcome. Baird goes on to suggest that volatility could rise as we go into 2022 and risks will rise. This fits with our own thoughts as well.
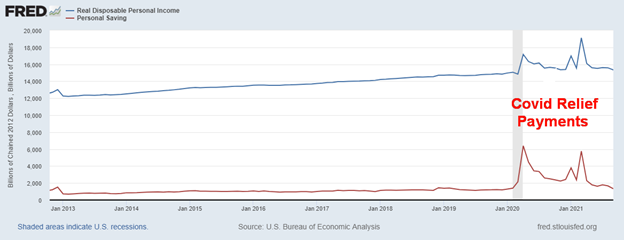
Real Disposable Personal Income, Personal Savings 2013–2021
Personal Savings as a Percentage of Personal Disposable Income 2013-2021
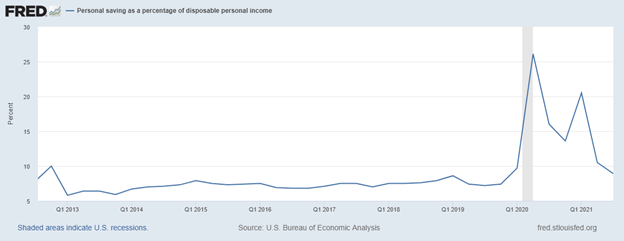
Here is a really interesting chart. We are showing in one chart real disposable personal income and personal savings. The second chart shows personal savings as a percentage of real disposable personal income. All of them are falling. What it also tells us is that the initial burst of GDP may not have been sparked by the Fed and QE but instead was sparked by COVID relief payments. Now those payments are running out and ending. As well, personal savings as a percentage of real disposable income is also falling. So where is the stimulus going to come from for future economic growth? And again, we ask, how does the Fed hike interest rates if the economy starts to slow yet inflation remains high?
Quits (blue line), Job Openings (red line) 2019–2021
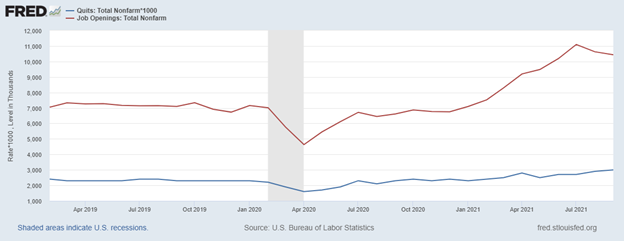
Here is another one to ponder. In September, a record 4.4 million quit their jobs according to JOLTS. Employers are offering elevated wages to attract workers. But at the same time the number of job openings eased to 10.4 million. That suggests for every unemployed person there were 1.4 job openings. Nonfarm payrolls are still roughly 4 million below the level seen in February 2020. As well, the labour force participation rate is as low as it has been in years. Many older workers managed to take retirement packages and just left the work force. A problem is there is a mismatch between those wanting jobs and the jobs being offered. Not enough are willing to take the low-level jobs where many of the openings are. Is it any surprise then that consumer sentiment is falling? All this is happening against the backdrop of rising inflation and the potential for declining consumer spending.
U.S. Michigan Consumer Sentiment and Current Economic Conditions 2012-2021
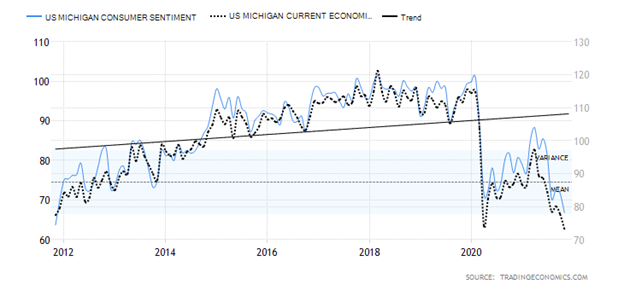
The Michigan Consumer Sentiment Index disappointed, coming in at 66.8 when the market was expecting a reading of 71. The Michigan Consumer Economic Expectations Index was also subpar at 62.8 when they expected a reading of 67. The two were at 71.7 and 67.9 respectively the previous month. Falling consumer confidence bodes poorly for the economy given that the consumer is upwards of 70% of the economy. High inflation coupled with stagnating economic activity spells stagflation. The Michigan consumer indicators are at their lowest level in a decade. The question now is, will it go even lower or have we seen the worst?
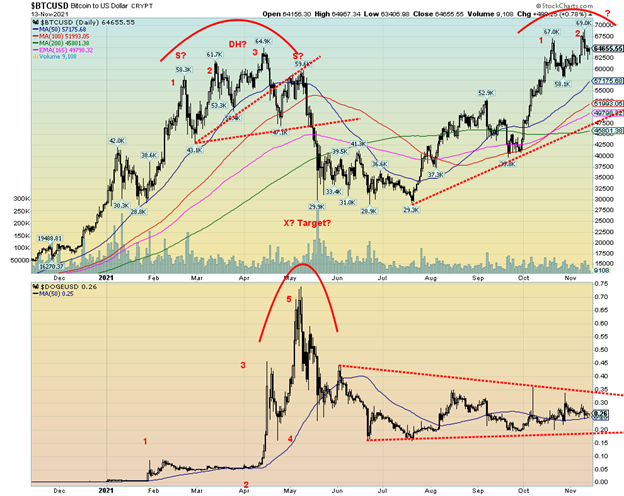
Once again Bitcoin hit new all-time highs at almost 69,000 this past week. Bitcoin promptly fell sharply after before closing lower but still up 3.7% on the week. Our favourite Dogecoin (DOGE) is well down from its all-time high. A possible divergence? However, others were soaring, with a number hitting record highs. We look at the chart of Bitcoin and wonder if we are going to see a repeat of what occurred earlier in the year when Bitcoin made what we call three thrusts to a high. That pattern sees three consecutive highs, each one only marginally higher than the previous one. It is ultimately a bearish pattern as witnessed by the trading action last February, March and April. After that Bitcoin fell 55%. Given the recent high near 69,000 was only slightly above the October high of 67,000, there is a possibility that we could see yet another new high say up to 71,000 or 72,000 before the market once again goes into a swoon. There is potential for up to 74,000. If Bitcoin should rise well beyond that level, then the odds of a decline would lessen. The market cap of all the cryptos just keeps on rising, currently about $2.8 trillion. With a market cap of $1.2 trillion Bitcoin represents 42.8% of the entire market. That’s actually lower than it has been, as at one point Bitcoin was more than 60% of the market. Still, Dogecoin sits at number 9 with a market cap of $34.4 billion. There are over 14,000 cryptos trading on over 400 exchanges.
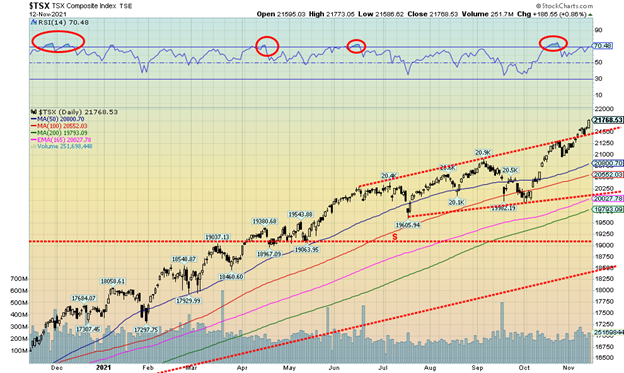
The TSX is the star. Bucking the trend this past week to a small down week, the TSX Composite soared once again to new all-time highs with a gain of 1.5%. The TSX was the only major North American Index to do so. Ten of the 14 sub-indices were up on the week and three of them made new highs. One of them making new highs was Energy (TEN); however, it didn’t hold and the TEN closed down on the week, losing 1.6%. The other losers were Real Estate (TRE) off 1.0%, Utilities (TUT) down 0.7%, and Income Trusts (TCM) down 1.4%. Higher interest rates would negatively impact all of them. The big winner on the week was Health Care (THC) with a gain of 11.1%. Other big winners were Golds (TGD) up 7.5%, Metals & Mining (TGM) up 5.9%, and Materials (TMT) up 5.6%. Others making new highs were Financials (TFS) up 0.9% and Industrials (TIN), basically flat on the week up a tiny 0.04%. Of all the indices, the TSX is breaking out of what appears to us as a rising or ascending triangle, suggesting that the next move could be a strong upward move. Naturally, we’d prefer to see the TSX remain above 24,500 but especially above 21,000. Below that we could see further declines. Potential targets for the TSX could be up to 25,800.
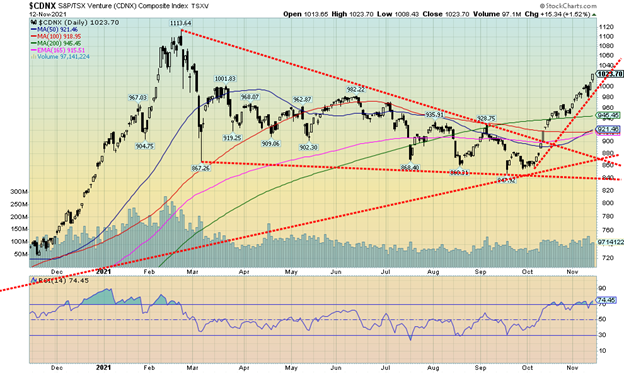
A significant bull rally appears to be underway for the TSX Venture Exchange (CDNX). Since a low in September the CDNX is up roughly 176 points or almost 21%. The CDNX is now up on the year by almost 17% after being down on the year at one point. The gain on the week was 3.9%. The CDNX is more than 50% junior mining stocks, mostly junior gold miners. As we have seen many times before, the CDNX tends to have strong moves both up and down. A doubling, tripling, or more for the CDNX to the upside is not unusual. To the downside, losses of 70% to 80% are also not unusual. The CDNX is currently flashing overbought but that is merely a state. Look back at late 2020/early 2021 and the RSI remained above 70 for the better part of three months. The RSI is only now starting to build over 70. A move above 1,050 would suggest to us that we should then take out the February 2021 high of 1,113. We are not that far from that level. A move back under 1,000 would be negative, at least for the short term, but there is considerable support down to 950.
U.S. 10-year Treasury Bond/Canadian 10-year Government Bond (CGB)
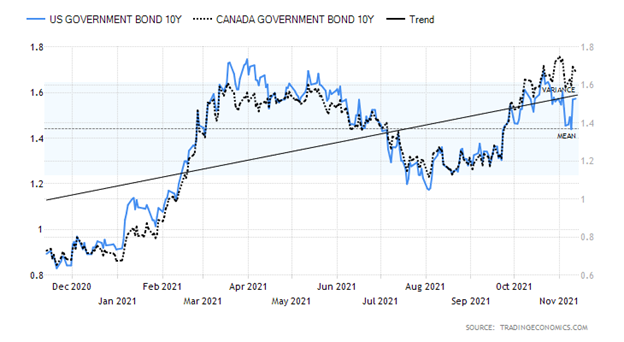
Given higher than expected inflation numbers this past week it should not be a surprise that bond yields rose. The U.S. 10-year treasury note rose to 1.57% from 1.45%. The Canadian 10-year Government of Canada bond (CGB) rose to 1.67% from 1.59%. Generally, yields were up across the board as the 2–10 spreads remained relatively flat on the week. The U.S. 2-10 was unchanged at 1.05% while the Canadian 2–10 spread rose slightly to 0.68% from 0.67%. While the story of the week was the PPI and CPI coming in stronger than expected, the overlooked story may have been consumer confidence that we noted earlier.
Other than the inflation numbers and the consumer sentiment numbers, it was a pretty quiet week for numbers. The big numbers this coming week are retail sales and industrial production. We’d also want to watch the retail inventory numbers. The latter part of the week sees housing starts for October and a host of manufacturing indices (Philly, Kansas City, New York, etc.). Canada’s big numbers include the inflation numbers on Wednesday and retail sales on Friday.
What’s key now for bond yields is, will the 10-year take out the recent high at 1.68%? A failure to take out that level would suggest that the next move was down in yield (up in price as prices move inversely to yields). The recent high itself was below the March 2021 high of 1.74%. That too could be construed as potentially bullish as yields would fall not rise as many expect.
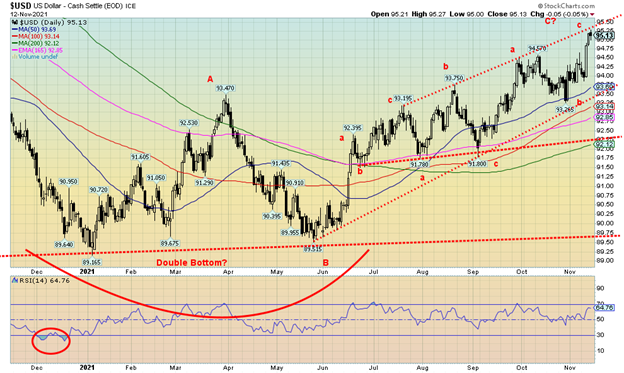
The US$ Index soared to a 52-week high this past week as the higher-than-expected inflation numbers helped suggest that interest rates would rise, thus helping push up the U.S. dollar. The US$ Index was up 0.9% on the week and 5.8% on the year. The euro fell a sharp 1.1% while the Swiss franc was off 1.0%. The pound fell 0.5% as did the Japanese yen. The Canadian dollar dropped 0.8% on the week as oil prices eased.
When we look at the chart of the US$ Index, all we see are series of zig-zag patterns. These patterns consist of corrective waves of abc, either in pairs or even triples. We labeled the move from the May low of 89.51 as a triple abc-abc-abc. Earlier patterns were either a double up and single abc down. All abc type moves are corrective and not the start of a new impulse wave to the upside. We also note that the US$ Index appears to have hit the top of the current channel. A break above 95.50 and especially above 95.75 would be far more bullish and bust the pattern. However, we are not expecting that. To the downside, we won’t be confident of a good down move until we break back under 94 as a minimum. A major break comes under 93.50. But the final nail in a bear move doesn’t come until we break under 92.
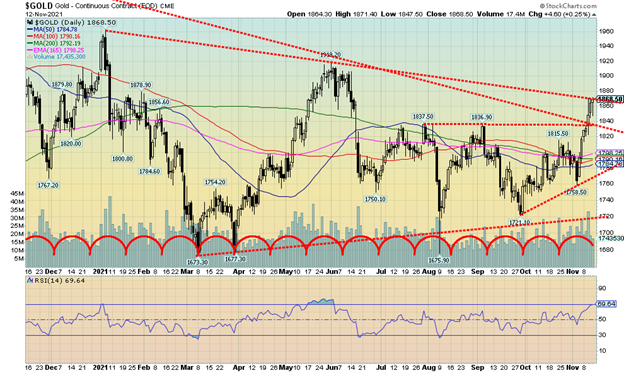
Gold put in its second consecutive weekly gain and in the process cleared over resistance seen at $1,840/$1,850 with a close on the week at $1,868.50. Gold gained 2.9% this past week while silver was up 4.9%. Platinum fared even better, up 5.2%. Not to be outdone, the near precious metals also gained. Palladium was up 4.4% while copper gained 2.5%. But that was not the best part. The best part is that gold and the precious metals rose despite a rise in the US$ Index over 95. Normally, when the US$ Index rises, gold falls and vice-versa. Gold rallying in the face of a rising US$ Index can be construed as quite bullish. Gold is now up $147 since the September low of $1,721. Gold could be construed to have completed an inverse head and shoulders pattern; however, it is a very awkward-looking one. Nonetheless, there was a neckline at $1,840 and the firm break over that level projects gold up to at least $2,000. There is resistance here at $1,870 but once we clear that level the next resistance doesn’t come in until $1,900/$1,920. What’s key is we hold above $1,840 preferably. The rally would be considered over if we ever broke down again under $1,760. We are seeing other forecasts for gold to rise to as high as $2,300 and $2,600. Currently, we can calculate a potential target zone of at least $2,000 but not beyond at the moment. Key will be first breaking and holding above $1,870, then above $1,920. The other metals also look bullish and the gold stocks enjoyed a strong up week, suggesting they are leading the way. The Gold Bugs Index (HUI) jumped 7.4% while the TSX Gold Index (TGD) was up 7.5%.
Helping to push gold prices was the higher-than-expected inflation numbers, coupled with weaker consumer confidence. That’s a combination that could suggest stagflation. Stagflation is good news for gold. As well, while the Fed has announced its taper plans, they have given no guidance as to interest rate hikes although some believe they will hike in 2022. Inflation, coupled with a weak economy, puts the Fed in a difficult place in terms of hiking interest rates. Hence, our focus now on the December 14–15 FOMC meetings which could be quite key. We also learned that Russia is buying gold again to ensure their reserves are flush with at least 20% gold. The Russians, flush with cash from the high oil prices, purchased 3.1 metric tonnes in both July and September. Another interesting bullish sign we spotted was the commercial COT for the Japanese yen is the most bullish we have seen in over two years. Gold and the Japanese yen generally have a positive correlation in that as the yen rises gold rises. The euro commercial COT is also at its highest level in two years as well. All of that could be suggesting that the US$ Index’s next move will be down.
Speaking of the COT, there is no COT this week as the November 11 bank holiday has pushed the CFTC to releasing its report this Monday, November 15. We’ll report any interesting results on Twitter.
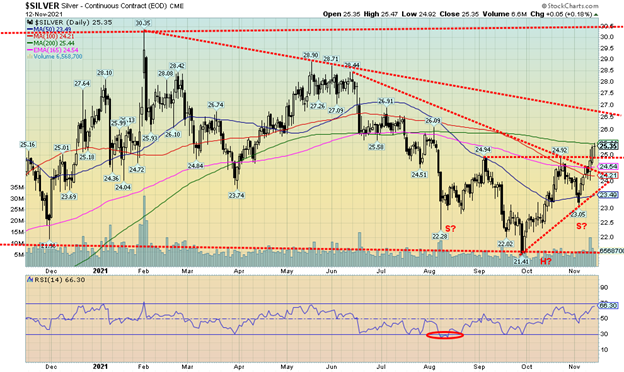
Silver is doing what it is supposed to do: lead. This past week silver jumped $1.19 or 4.9% one of its best moves in weeks. We have now reached the highest levels since July 2021. We also broke a downtrend line from highs seen back in May 2021. However, we also ran into the 200-day MA, currently near 25.40 (high on the week was $25.47). If we can clear over $25.50, then the next hurdle we see is up at $26.50. Once over $26.50 we see a clearer way to the February 2021 highs of $30.35. Minimum targets for silver, based on the inverse head and shoulders pattern, are at least up to $28.50. Once we break above the February 2021 high of $30.35, potential targets are up to $39 with interim objectives at $36. Key, of course, is that on any pullback we do not break down under the right shoulder low of $23.05. After rising from $11.64 in March 2020 to a high of $29.92 in August 2020, silver has undergone a significant 15-month correction. The low of $21.41 seen in September corrected just under 50% of the up move. We challenged but never seriously broke solidly under $22. Still, that remains a line in the sand. Right now, we’d be concerned if silver slipped back under $24.50 and especially under $24. Volume has picked up on this move which is another positive.
As with gold there is no COT this week.
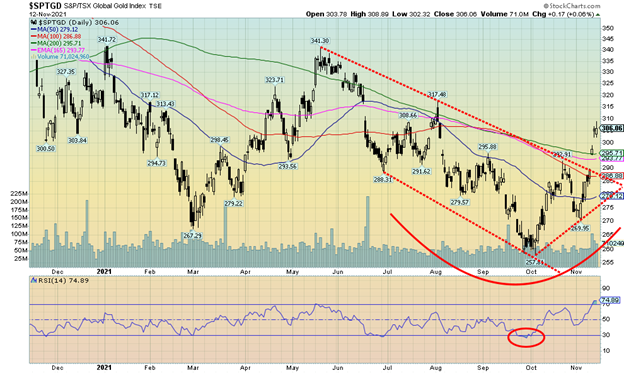
The gold stock indices had an excellent week with the TSX Gold Index (TGD) jumping 7.5% while the Gold Bugs Index (HUI) was up 7.4%. They have now reached their highest levels since July. In some respects that has pushed some indicators into overbought territory. Note the RSI for the TGD is now at about 75. But in strong moves in the past, the indicator has remained overbought for weeks. The Gold Miners Bullish Percent Index (BPGDM) is only up to about 47. That has considerable room to rise further. A level of 100 would be extreme and rarely happens but when it does, one is advised to take profits.
What is interesting about the TGD chart above is that it gapped higher, then gapped higher again. The initial gap higher is called a breakaway gap but the second gap suggests we could be in the process of creating running gaps or measuring gaps. A running gap is quite bullish and suggests we are still early in a potential strong upward move. The TGD did form what looks like a very awkward inverse head and shoulders reversal pattern. The pattern suggests a minimum objective of about 330 which is about 8% higher. Support is now at least the bottom of the breakaway gap near 295 which also coincides with the 200-day MA.
Overall, this is a pretty bullish chart. Next resistance is around 317/320, then up at 330 to 340. A firm break over 341 would have the TGD making fresh 52-week highs. The TGD has crawled back and is now down only 2.9% on the year while the HUI is down 7.2%. But if these kinds of moves can be sustained, we could soon be in the green for 2021.
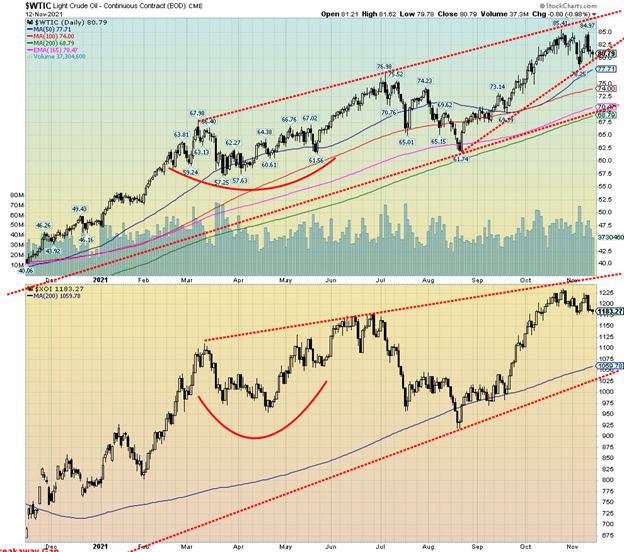
For the third successive week, oil prices have fallen. Warm weather, OPEC cutting its demand forecast, and the Biden administration releasing reserves from the Strategic Petroleum Reserves (SPR) are helping prices to soften. As well, the EIA reported that crude inventories rose 1 million barrels on the week. While below expectations, it nonetheless puts supplies in a good position. down only 7% below the five-year average.
WTI oil fell 0.6% this past week to close at $80.79. Brent crude fell to $82.16 down 0.5% on the week. Natural gas (NG) fell sharply (see next comment), dropping 13.2%. The energy indices were not spared. The ARCA Oil & Gas Index (XOI) dropped 1.7% while the TSX Energy Index (TEN) was off 1.6% after making a new high for the move.
Failure to see new highs on the recent rebound is almost invariably a “kiss of death.” The next move is to take out the recent low and the swing decline could take WTI oil down to about $71. A decline like that would also provide welcome relief at the gas pumps. So far, the energy indices are hanging in but if WTI oil breaks its recent low at $78.25 and NG cracks what we believe is a double top, then the energy indices could crack as well.
There is considerable wrestling going on at COP26 over the capping of emissions and the phasing out of fossil fuels, or at least phasing out subsidies. Not all countries are on board, particularly coal-producing countries.
One thing that has been going on almost openly now is Iran and China snubbing U.S. sanctions on Iran, as China is buying upwards of 500,000 bpd from Iran over the past couple of months. The oil flows through the Malacca Straits, either directly or by ship-to-ship transfer. That has helped supply, however, and is another reason why prices have softened. The other side of this is that it raises geopolitical tensions.
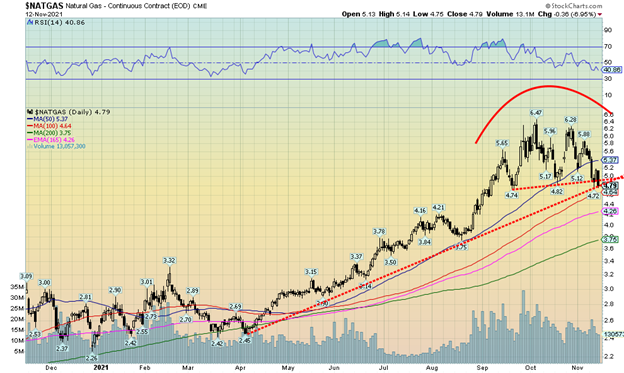
Natural gas (NG) prices have been falling. That could provide some welcome relief. Prices are falling because of the warm fall weather, resulting in a rebuilding of supplies that is calming thoughts of shortages during the winter. NG can be somewhat volatile in the fall as it is a swing season between summer and winter. That hasn’t completely eased the supply problems in the EU, but the price drop should help. Nonetheless, the EU is a special problem, particularly with Belarus being a major transit point from Russia. Because of the refugee dispute, Belarus is threatening to cut off gas supplies to the EU. NG fell 13.2% this past week. The chart is now suggesting a potential double top. NG sits on the cusp of breaking the neckline and the uptrend line from April 2021. Targets could be down to around $3.25 which is slightly below the 200-day MA currently at $3.75. We’d have to regain back above $6 to begin to suggest that instead of falling we could see new highs. The chart above is telling us that scenario is unlikely.
__
(Featured image by OTA Photos CC BY-SA 2.0 via Flickr)
DISCLAIMER: This article was written by a third party contributor and does not reflect the opinion of Born2Invest, its management, staff or its associates. Please review our disclaimer for more information.
This article may include forward-looking statements. These forward-looking statements generally are identified by the words “believe,” “project,” “estimate,” “become,” “plan,” “will,” and similar expressions. These forward-looking statements involve known and unknown risks as well as uncertainties, including those discussed in the following cautionary statements and elsewhere in this article and on this site. Although the Company may believe that its expectations are based on reasonable assumptions, the actual results that the Company may achieve may differ materially from any forward-looking statements, which reflect the opinions of the management of the Company only as of the date hereof. Additionally, please make sure to read these important disclosures.
David Chapman is not a registered advisory service and is not an exempt market dealer (EMD) nor a licensed financial advisor. We do not and cannot give individualised market advice. David Chapman has worked in the financial industry for over 40 years including large financial corporations, banks, and investment dealers. The information in this newsletter is intended only for informational and educational purposes. It should not be considered a solicitation of an offer or sale of any security. Every effort is made to provide accurate and complete information. However, we cannot guarantee that there will be no errors. We make no claims, promises or guarantees about the accuracy, completeness, or adequacy of the contents of this commentary and expressly disclaim liability for errors and omissions in the contents of this commentary. David Chapman will always use his best efforts to ensure the accuracy and timeliness of all information. The reader assumes all risk when trading in securities and David Chapman advises consulting a licensed professional financial advisor before proceeding with any trade or idea presented in this newsletter. David Chapman may own shares in companies mentioned in this newsletter. We share our ideas and opinions for informational and educational purposes only and expect the reader to perform due diligence before considering a position in any security. That includes consulting with your own licensed professional financial advisor.


Tilray Acquires HelloMD to Expand Medical Cannabis Digital Platform
Tilray Brands acquired HelloMD, a digital healthcare and medical cannabis platform, pending court approval on June 29, 2026. The deal...


Spanish Crowdfunding Market Reaches Record €761.6M in 2025, Driven by Real Estate and Crowdlending Growth
Spanish crowdfunding market reaches record €761.6M in 2025, driven by strong real estate dominance and rapid crowdlending growth, while donations...


Swedish fintech Lysa is preparing to enter the European ETF market
Swedish fintech Lysa is entering the European ETF market, registering its first ETF and expanding beyond its robo-advisor model. Managing...


Bitcoin Stalls Near $60K as Strategy Moves, ETFs Outflow, and EU MiCA Rules Take Effect
Bitcoin hovers near $60,000 with ETF outflows, while Strategy boosts reserves, sells BTC, and raises dividends to reassure investors. Ethereum...


Morocco’s Growth Holds at 4.6% as Agriculture Offsets Economic Pressures
Morocco’s economy grew 4.6% in Q1 2026, driven by a strong agricultural rebound offsetting declines in industry. Services expanded moderately...
 |
|
 |  |
 |
|
-

 Crypto1 week ago
RLUSD Launch in Japan Amid XRP Price Decline and Uncertain Outlook
-

 Crypto2 weeks ago
Crypto Market Stays Stable as Bitcoin and Ethereum See Mild Declines
-
 Business4 days ago
Dow Jones Near Highs Signals Strength Until Volatility Returns
-

 Africa1 week ago
Moroccan Bond Market Shows Mixed Signals as Primary Eases and Secondary Pressures Persist