Business
A look at peak debt
Corporate debt is the biggest threat worldwide, specially in the emerging world that used cheap printed dollars from the developed countries, to fund a debt binge concentrated in the corporate sectors. Stockman remarked that, consumers had transitioned from a more historical level of debt of 80% up to 180% and business debt up by nearly $10 trillion since the turn of the century.
David Stockman, Dr. Lacy Hunt and I agreed on a lot of things last week at the seventh annual Irrational Economic Summit in D.C.
In the September issue of Boom & Bust, I talked about corporate debt being the greatest threat globally this time around. The worst is in the emerging world that used cheap printed dollars from the developed countries, primarily the U.S, to fund a debt binge concentrated in the corporate sectors. But our corporate sector also added a lot to their debt and only 39% of their bonds are investment grade, with 39% BBB and 22% junk.
Last time the bigger binge was by consumers playing the great housing bubble. With low rates and a good economy, why not buy a bigger house, or a vacation house, or speculate in a few to rent out and/or flip.
Consumer debt
So, I’ll start with consumer debt and a slide from David Stockman’s presentation at our recent IES conference in D.C.
Peak debt: Household leverage went from historic 80% of Wages & Salaries to 180% — today 90% of households too broke to get “stimulated” by Fed’s cheap rates.
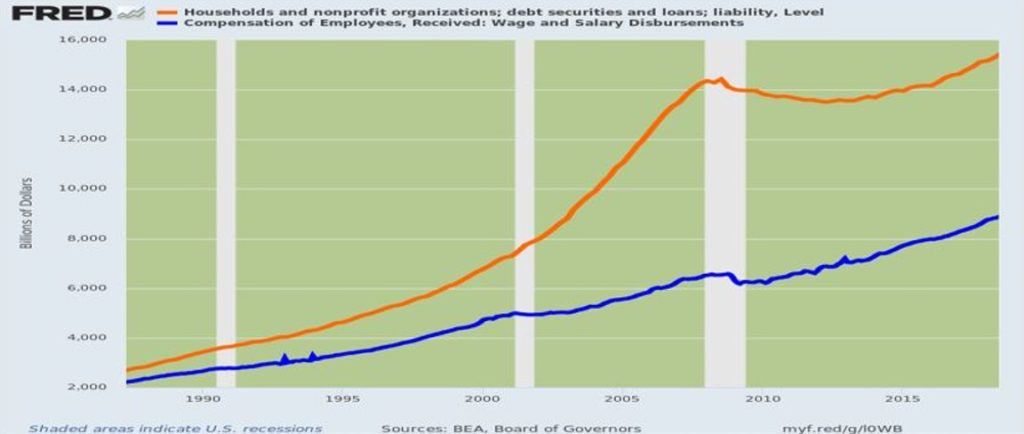
Stockman remarked that consumers had transitioned from a more historical level of debt leverage of 80% up to 180%. In this chart, total consumer debt has grown 505% today at $15.5T (trillion) from its $2.6T in 1987. In the 13 years up until 2000, it grew 162% to $6.8T.
Then the real bubble hit starting in 2000 when stocks crashed and people switched to speculation in real estate . Their debt grew 112% in just 8 years to $14.4T in 2008. It backed off with minor deleveraging to $13.5T in 2012 and then grew a much more sober 17% into now, 2019.
Hence, households have not been the big borrowers this time around.
The corporate side
Peak debt: Business debt up by nearly $10 trillion since the turn of the century —But overwhelmingly funded financial engineering and recycle to Wall Street, not productive assets on main street.
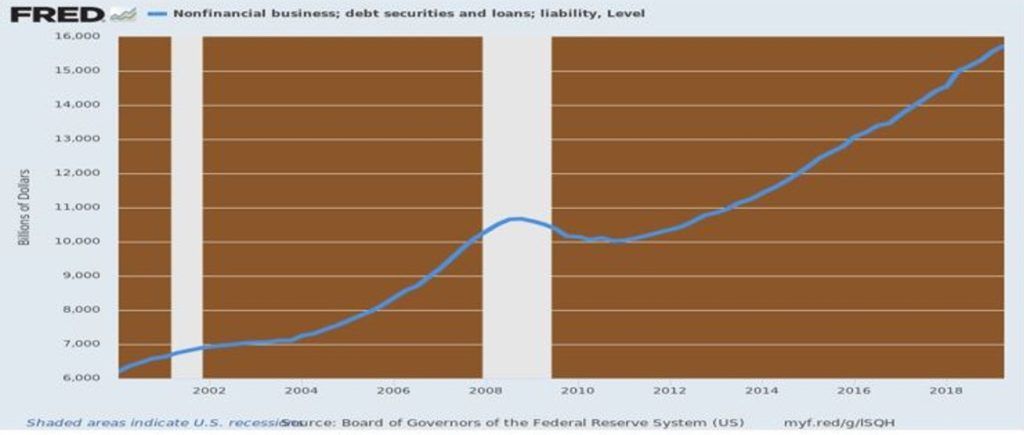
(Source)
This chart goes back to 2000. In the last bubble corporate debt went from $6.2T in 2000 to $10.6 in 2008, up 71% and less than that 112% for consumers. That debt fell modestly to $10.0T and then grew a not sober 57% to $15.7T. It is now near total consumer debt at $15.8.
But the growth rate since 2000 has been higher overall for the corporate sector, 153% vs. 132% for consumers.
Again, consumer debt grew more from 2000 to 2008 and corporate debt more from 2010 to 2019. Consumers speculated more on housing in the first bubble and corporations did worse this time around. They speculated on their own stocks: $5.7T since 2009! Oh, that’s the exact amount of the net debt increase since then.
Housing fell 34% last time and could fall closer to 50% this time. But those corporate stocks could fall 80%+. How foolish the corporate CEOs and boards will look… the dumbest money in history – not for shoe shine boys anymore.
So, who’s going to be more in trouble this time around with 61% of their corporate bonds not investment grade – BBB or less including 22% junk bonds?
—
(Featured picture by Pixabay via Pexels)
DISCLAIMER: This article expresses my own ideas and opinions. Any information I have shared are from sources that I believe to be reliable and accurate. I did not receive any financial compensation for writing this post, nor do I own any shares in any company I’ve mentioned. I encourage any reader to do their own diligent research first before making any investment decisions.


The TopRanked.io Weekly Affiliate Marketing Digest [The Top VPN Affiliate Programs Roundup]
Want to be let in on a little secret about two massive affiliate opportunities you can take advantage of today?...


Sustainable Finance Faces Hurdles as Green Asset Ratio Reforms Fall Short of Full Transparency
The Green Asset Ratio (GAR) measures banks' alignment with the EU Taxonomy but remains low due to methodological flaws and...


XRP Hits New All-Time High Amid U.S. Crypto Policy Shift and Ripple’s Expansion
XRP surged past its 2018 all-time high, reaching $3.65 amid renewed political support for crypto in the U.S. under Trump....


Germany Moves to Curb Medical Cannabis Abuse, Sparking Access Concerns
Medical cannabis imports in Germany have surged, but health insurance-covered prescriptions remain low. Easy online access raises concerns about abuse...


JPMorgan’s Data Fees Shake Fintech: PayPal Takes a Hit
JPMorgan Chase will charge fintechs for customer data, threatening business models reliant on free access. PayPal’s stock plunged 5.7% after...
 |
|
 |  |
 |
|
-

 Africa1 week ago
BLS Secures 500 Million Dirhams to Drive Morocco’s Next-Gen Logistics Expansion
-
 Fintech2 weeks ago
Ripple Targets Banking License to Boost RLUSD Stablecoin Amid U.S. Regulatory Shift
-

 Impact Investing3 days ago
Sustainable Investments Surge in Q2 2025 Amid Green and Tech Rebound
-

 Biotech1 week ago
Biotech Booster: €196.4M Fund to Accelerate Dutch Innovation