Featured
A Primer on the Bear’s Eye View (BEV)
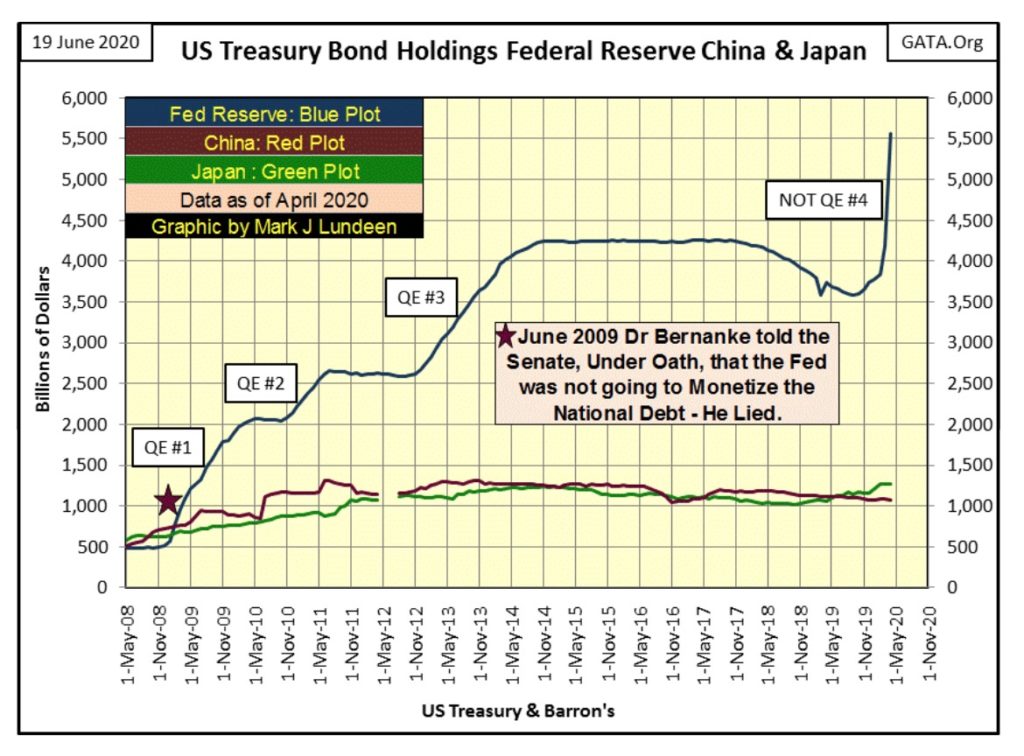
Twelve years ago in May 2008, both China and Japan held more Treasury debt than did the Federal Reserve; but not anymore. As of April 2020 the FED’s holdings are 238% larger than the combined totals for both China and Japan. Why this huge increase? This was the price paid for the “policy makers” continuing campaign to “stabilize market valuations” since the 2007-09 sub-prime mortgage debacle.
I usually begin with a Bear’s Eye View or BEV chart of the Dow Jones, but exactly what is a BEV chart? It’s a view of the Dow Jones as Mr Bear sees it; with each new all-time high registering as a 0.00%, aka BEV Zero. That is how Mr Bear sees new all-time highs; each being only a Big-Fat Zero to him. All other data points not a BEV Zero are percentage claw backs from their last all-time high.
In effect the Bear’s Eye View of any market series compresses data into a strict range of only 100 possible percentage points:
- BEV Zero (0.00%) = New All-Time High
- BEV -100% = Total Wipe Out in Valuation
The Bear’s Eye View (BEV) is NOT a tool for studying bull-market advances. Rather it is a display of new all-time highs and percentage claw backs from them, and that’s it. Still, this can be quite handy during bull market advances, as all bull markets have corrections, or percentage pullbacks from their all-time highs.
Here’s the Bear’s Eye View of the Dow Jones going back to 1885. Before 1900 the Dow Jones typically closed below 80. In 2020 the Dow Jones now closes above 25,000. How can one compare the market performance in the Dow Jones of the late 19th century with that of the early 21st century? In an hour today, the Dow Jones can easily change 160 points; a value that’s twice total valuation of the Dow Jones before 1900.
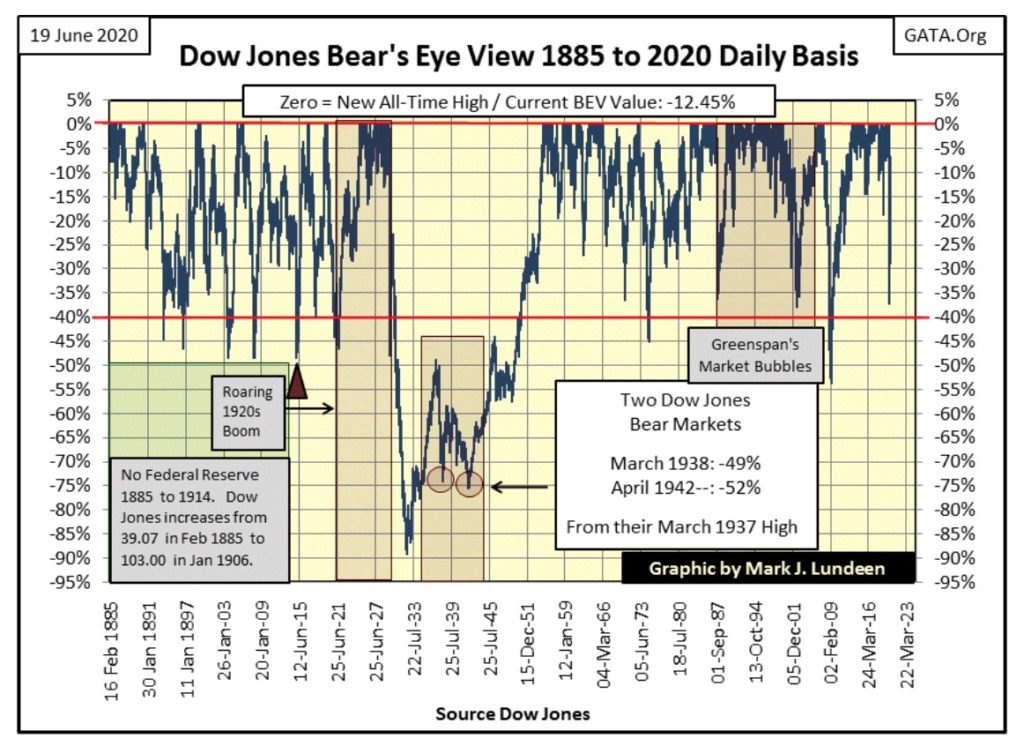
Comparing any period of the past 135 year history of the Dow Jones to any other is simple with the above BEV chart. For example, take the BEV Zero of 04 June 1890 when the Dow Jones closed at a new all-time high of 61.80. The Dow Jones would not see another new all-time high again until 09 January 1899 (61.98); nine years later. In between these BEV Zeros was a 46.64% bear market bottom on 08 August 1896. This bear market bottom is the first time the Dow Jones broke below its BEV -45% line in the BEV chart above.
For investors of the late 19th century; how is a 45% market decline different from a 45% market decline during the 20th or 21st centuries? There is no difference, no matter what dollar value the Dow Jones’ last all-time high was! So the Bear’s Eye View can also be seen as the market’s impact on portfolios’ valuation from one market era to another.
Also, in the Bear’s Eye View chart above, we see why the Great-Depression crash remains the preeminent market event in Dow Jones history since 1885.
I’ve highlighted the BEV -40% line in red as the Bear’s Eye View has teased out of the Dow Jones Daily data set an interesting historical fact: since 1885, whenever the Dow Jones has seen a -40% decline from a BEV Zero, the bear market decline has for the most part become a spent force.
By this 135 year rule-of-thumb, with the Dow Jones making a -37% bottom on March 23rd the stock market should now be a safe place to place one’s money. The only exception to this long held rule was the Great-Depression crash. Go back to the above BEV chart and look at the crater it left behind – what’s with that?
That’s a simple question to answer. The Federal Reserve was created in 1913 by an act of Congress and signature by President Wilson. It took only sixteen years before these wonder lads of “monetary policy” inflated a massive bubble in the stock market; the Roaring 1920s bull market. The Great Depression 89% market crash was the deflation that followed.
Everyone who lived through the depressing 1930s was psychologically scarred by them, including the “policy makers.” So for the next fifty years the stock market was for the most part left alone – then in August 1987 came Alan Greenspan whose “monetary policy” focused on the stock market.
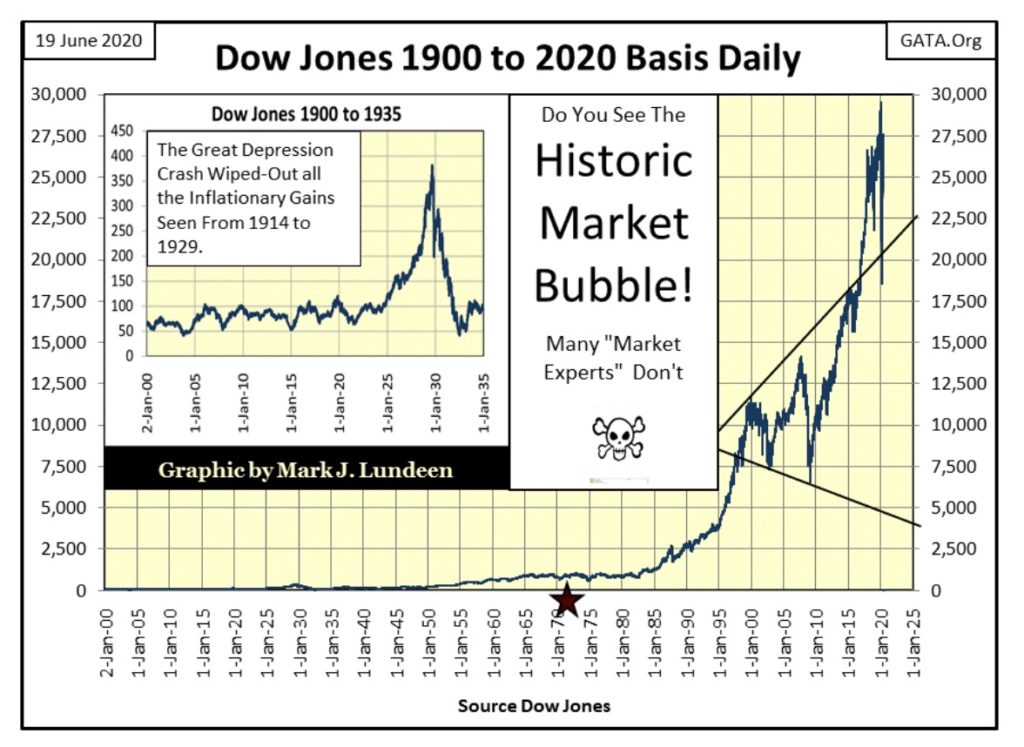
And exactly what did Alan Greenspan do? As seen in the chart below he began inflating a bubble in the market that is many times worse anything that happened in the 1920s. I’m of the opinion that exactly as the depressing 1930s followed the Roaring 1920s, the inflation seen below (from 1987 to today) must be followed by a massive deflationary event as happened in the 1930s.
No “market expert” I know of in the financial MSM looks at the stock market this way. But I do, and this bearish bias of mine dominates my weekly market commentary.
Am I right? We’ll all find out together if I am or not. But I’m showing you my work, which you can agree with or not, that we are headed into another deflationary decade similar to the 1930s.
So much for that; let’s move on.
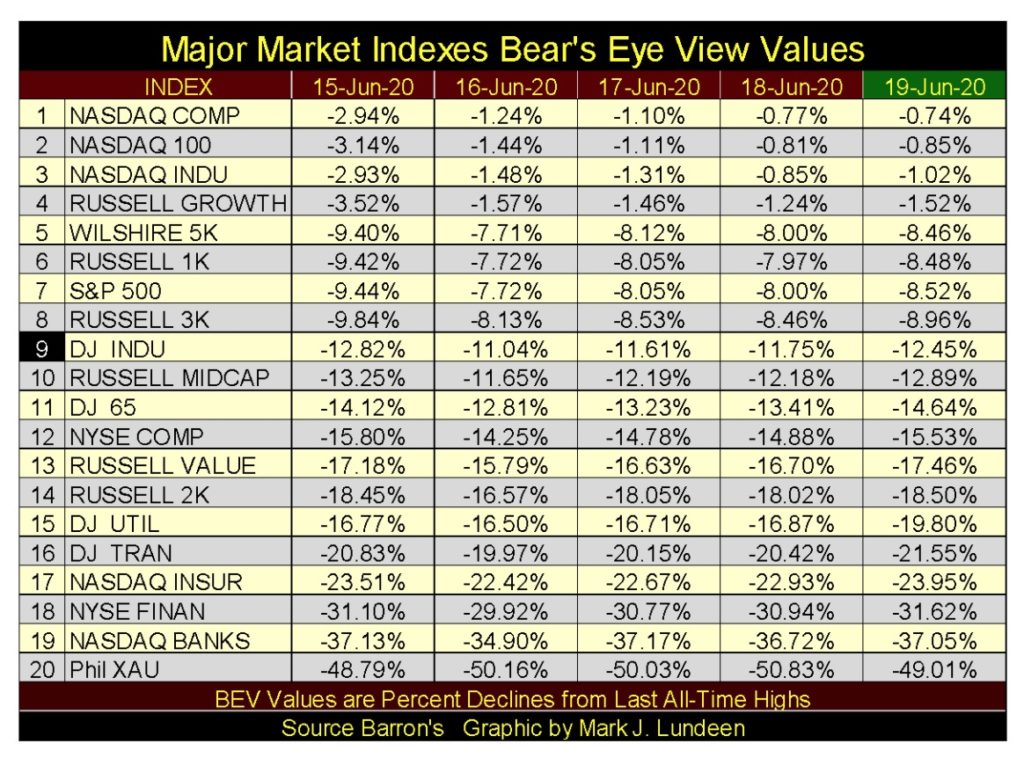
The Bear’s Eye View also allows us to compare one market series with another, as I do weekly with my Major Market Indexes BEV Table below. Today, the NASDAQ Indexes are where the action is (#1-3), as long as they are not insurance or banking indexes (#17 & 18). The Dow Jones (#9) as intended, is acting as a proxy for the broad market. But then so is the S&P 500 (#7).
The Dow Jones; comprised of thirty large dividend paying blue chip stocks, hasn’t been an index of glamour stocks since the Roaring 1920s bull market when high-tech was a shiny new Chrysler and vacuum tubes manufactured by Radio Corporation of America (RCA).
I get letters from readers asking why I don’t provide a running commentary on Dow Theory, or gauging the market’s future prospects by comparing the Dow Jones Industrials with the Dow Jones Transports. Well it’s not what I do, and I don’t know how good I’d be at it.
As I see it, unless I can contribute something new and unique on the markets, I’m just taking something from someone else without giving them proper credit for their work. Still, using the Bear’s Eye View of the markets in the table above, my readers can do their own Dow Theory analysis by just looking at the BEV values for the Dow Jones (Industrials / #9) and the Dow Jones Transport Average (#16).
The industrials are almost in single digit BEV values, while the transports are in the low -20%. Just this could be taken as a bearish Dow Theory signal. But when we look at when these averages saw their last BEV Zeros (last all-time highs):
- 12 Feb 2020 for the industrials (four months ago)
- 10 Sept 2018 for the transports (twenty-two months ago)
It’s apparent the Dow Theory is flashing a very strong sell signal, or should be I would think. Not that the FOMC cares as they are doing all they can to make sure that doesn’t happen.
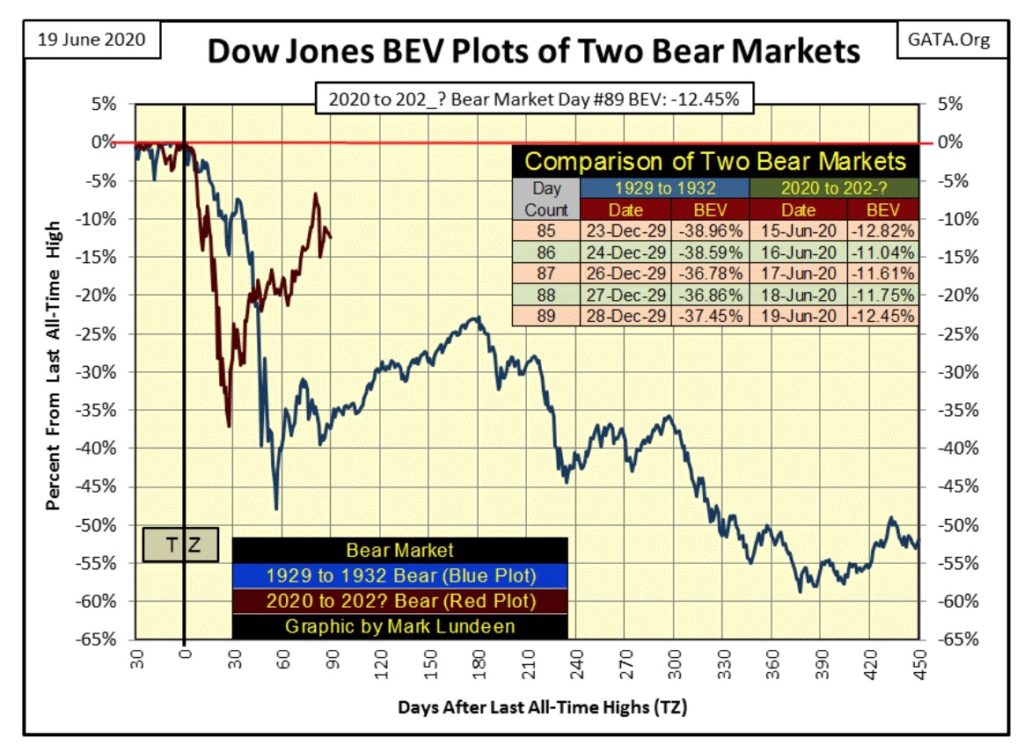
Here’s the BEV comparison between the Dow Jones Great-Depression crash and our current market decline. The Great-Depression Crash will continue its dead-cat bounce until day 180 of its bear market, then slips into the abyss.
But what of our market decline? Will the Dow Jones take out its BEV -6.70% it made on day 80 before it goes on to a new BEV Zero, or maybe this advance off of the BEV -37.09% of day 27 is all the bulls have in them – then what?
What do I think? I think it’s best not to make market predictions while the FOMC is still “stabilizing market valuations”, even with a strong Dow Theory sell signal.
Still, I find this comparison entertaining for now, and in time possibly prescient should the Dow Jones take out the low from day 27 without first making a new BEV Zero.
Looking at Mr Bear’s report card below, again in week 17 of this bear market the Dow Jones saw another 2% day on Tuesday. The Dow Jones’ 8 count has remained above a zero value for now over four months as its 200 count is now at 41. That’s a lot of volatility during a seventeen week period, and Dow Jones’ bear markets are volatile markets.
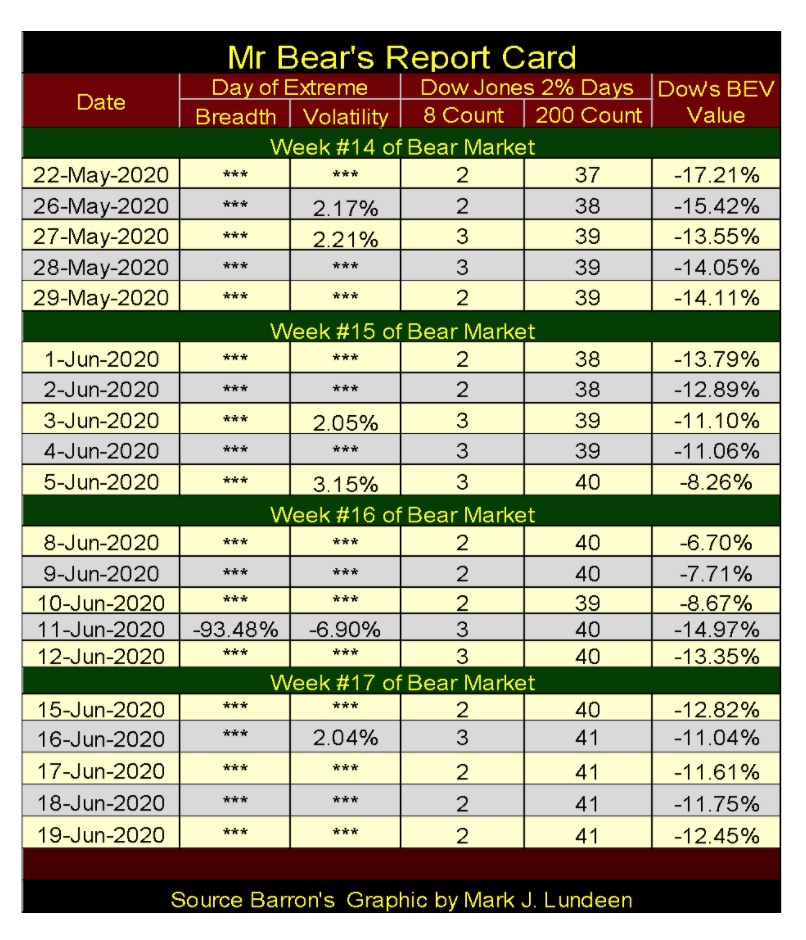
If the FOMC announced they would suspend their “market stabilization” program for the next two months, and made sure everyone knew they meant it, the stock, bond and real estate markets would be in a state of collapse before they returned.
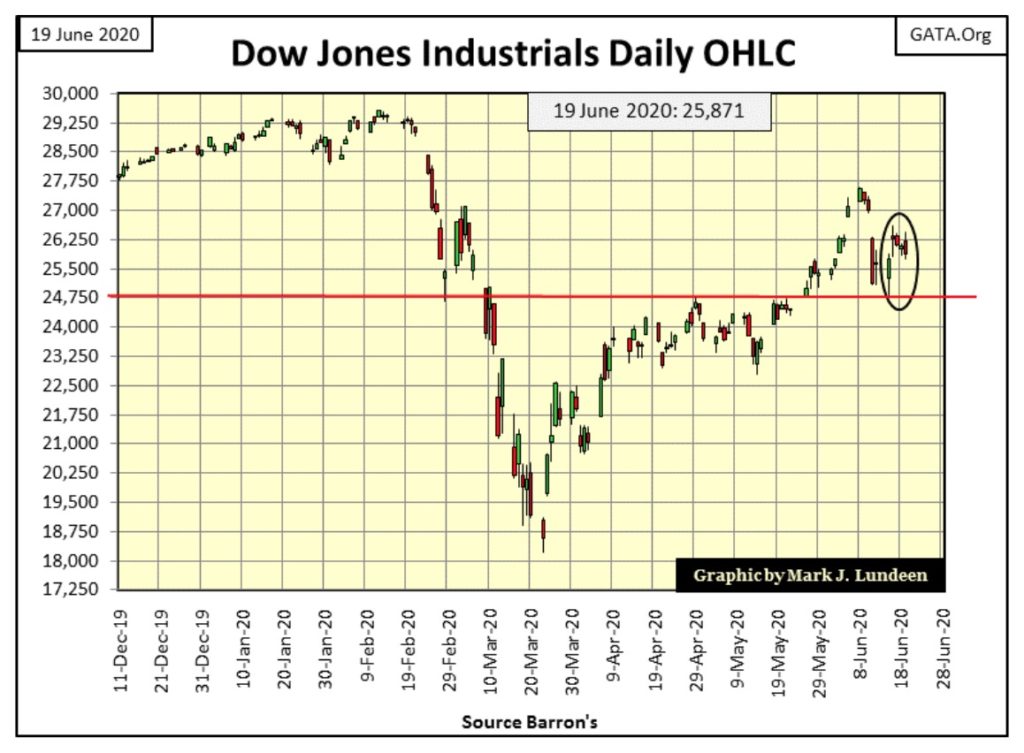
So much for Mr Bear’s views on the stock market, let’s move on to the Dow Jones in daily bars. This week saw a nice rebound from the lows of last week. Should it take out the highs of early June sometime in early July, the game will once again be afoot.
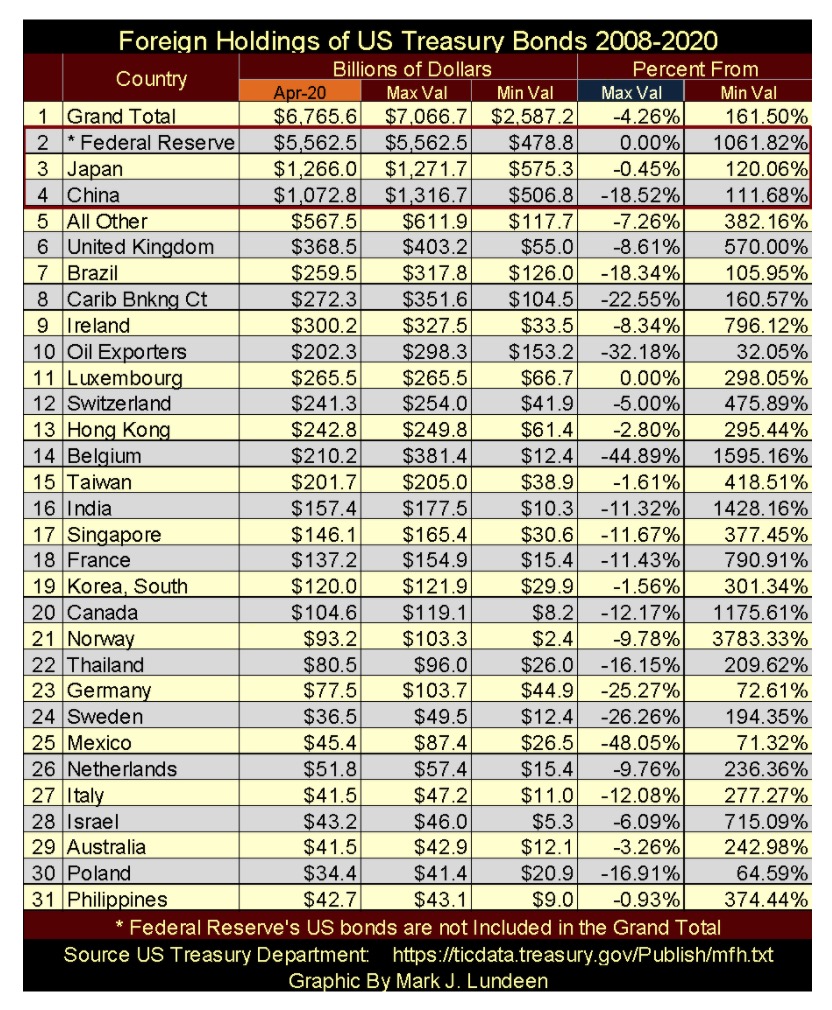
Let’s take a look at foreign holders of US Treasury debt in the table below (data from the US Treasury and the Federal Reserve). The columns are as follows from left to right:
Billions of Dollars
- Apr-20: (April 2020 the latest update). The table is sorted on this column. Data on the Federal Reserve isn’t included in the Treasury’s data set, or in the grand total, hence the *. But I have it so I include it.
- Max Val: or maximum holding since May 2008, when I first began compiling this data set.
- Min Val: or minimum holdings since May 2008, which typically is the data posted for May 2008, but not always.
Percent From
- Max Val: Bear’s Eye View value or the percent decline from the maximum holdings. A 0.00% (or BEV Zero) is a new all-time high.
- Min Val: the percent increase for April 2020 from the minimum holding, which is typically May 2008, but not always.
I’ve enclosed within a red box the three largest holders of US Treasury debt:
- Federal Reserve
- Japan
- China
Twelve years ago in May 2008, both China and Japan held more Treasury debt than did the Federal Reserve; but not anymore. As of April 2020 the Federal Reserve’s holdings are 238% larger than the combined totals for both China and Japan.
Why this huge increase? This was the price paid for the “policy makers” continuing campaign to “stabilize market valuations” since the 2007-09 sub-prime mortgage debacle. However, the ultimate bill for all of this won’t be presented to the FOMC, but to people who define their wealth in US Dollar terms sometime in the not to distance future, if not now in June 2020.
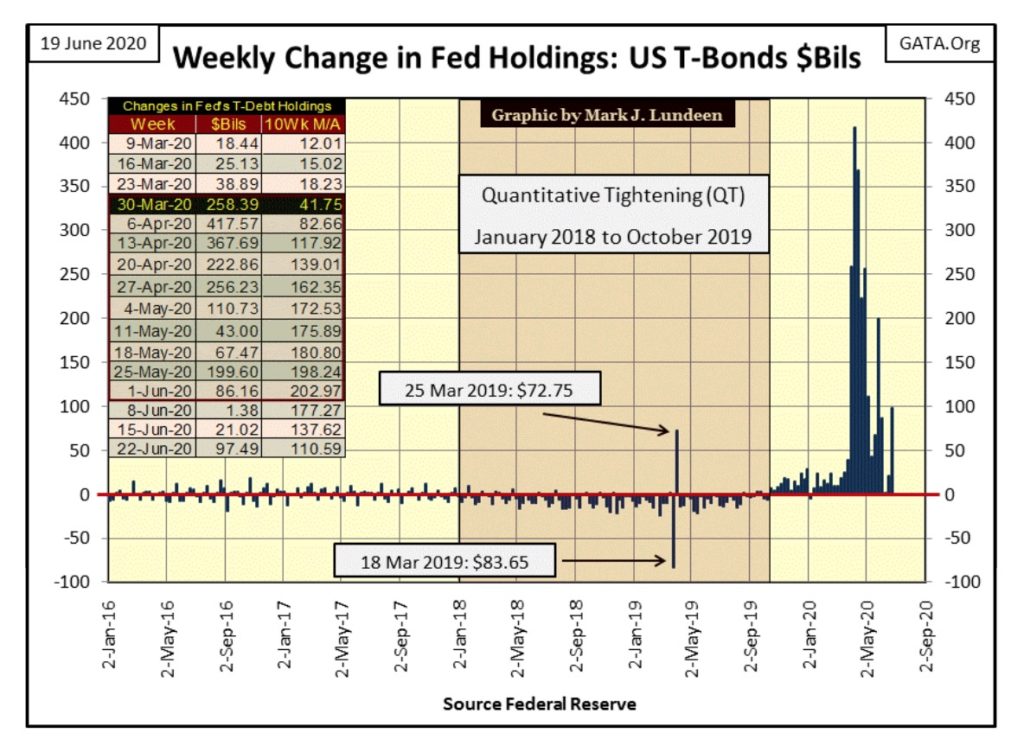
The next chart plots the holdings of US T-debt by the Federal Reserve, China and Japan since May 2008. This dramatic graphic needs little comment from me.
I’ve placed a red star to mark June 2009 when Fed Chairman Bernanke was asked under oath in the Senate whether the Federal Reserve was going to monetize the national debt.
(When asked directly during congressional testimony if the Federal Reserve would monetize U.S. government debt, the Fed Chairman responded) “The Federal Reserve will not monetize the debt.”
– Doctor Benjamin Bernanke: June 03, 2009
Asking the Fed Chairman such a question shows the ignorance of things “monetary” by most members of the Senate, as it’s been widely known that since the end of WWII the Federal Reserve has been monetizing the national debt.
* Monetizing the national debt is what “open market operations” is all about! *
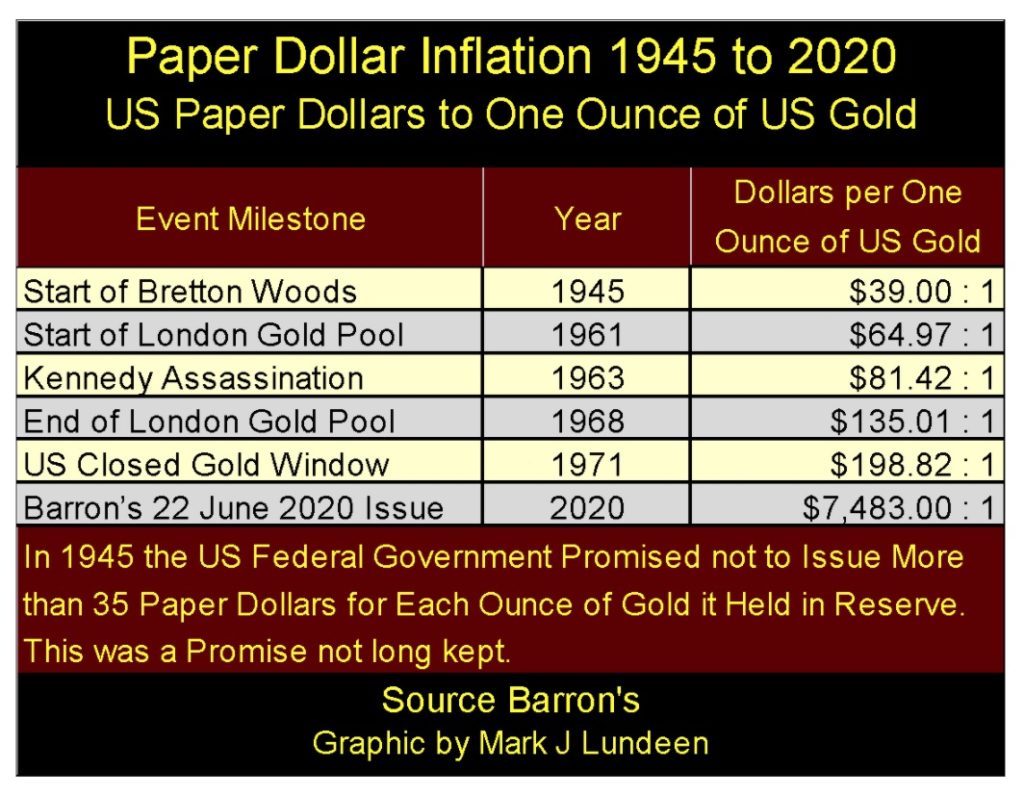
By August 1971 they had monetized so much of the national debt their “monetary policy” knocked the US Dollar off the Bretton Wood’s $35 gold peg.
Using data Barron’s has been publishing since the 1930s, by August 1971 in the table below the FOMC had issued $198.82 dollars for every ounce of US Treasury gold. It goes without saying this is no way for a central bank to manage a $35 gold peg.
The run on the US Gold Reserves that began in 1958 came to a climax as foreign central banks presented their dollars to the US Treasury, expecting an ounce of gold for each $35 dollars presented. This was impossible as the Treasury would run out of gold long before the foreign central banks ran out of dollars; so the Treasury “closed the gold window” in August 1971.
Much is made how the US Treasury has never defaulted on its obligations to its creditors, but that is not true. By act of law, before August 1971 the dollar was defined in terms of gold. In fact, technically it still is. The only authority the Treasury had in closing its gold window was an executive order by then President Nixon, which allowed only a “temporary” suspension of the $35 gold peg. That temporary suspension has superseded both US law and the Bretton Woods International Monetary Treaty for the past half a century.
The US Treasury’s first default occurred in 1934 when it devalued the dollar from $20.67 to $35.00 an ounce. This 69.24% devaluation was in any sense of the term a default to holders of the US Treasury’s debt and the Federal Reserve Notes we call dollars.
The US Treasury’s second default occurred in August 1971 when it refused to exchange its gold for its paper dollars held by foreign central banks. There is a third default pending, when the US Treasury finds it necessary to payback only a fraction of the face value of its maturing debt.
Too many people today see the world like a football game. A whistle blows followed by one hour of play time after which the game is over. However, some things take many decades to play out. Here’s a prophetic quote from the old gang at Barron’s:
“We hope that the government of the United States, despite the big spenders, and the gold tinkerers, maintain a sound dollar, a dollar worth saving, a dollar worth earning, and a dollar that can be traded in any part of the civilized world.”
– Barron’s World at Work, 02 January 1950 issue, Front Page
This quote is from seventy years ago. Did they know something that has been forgotten now in the 21st century? I believe they did!
All you need to know to prove that is in Barron’s 22 June 2020 issue: the FOMC has currently issued $7,483 in CinC for every ounce of Treasury gold that by statute is fixed at $42.22 an ounce. Except for me, who follows this anymore or even cares?
Something else no one cares about is the status of the US Gold Reserves, which we’re told are 261 million ounces. I hope there are in fact 261 million ounces of gold bullion in the Treasury’s gold reserves, but the Treasury has never allowed a proper * INDEPENDENT * audit of what the Treasury admits is the American people’s gold. So, for decades whether the gold is there or not is only a matter of opinion, and that is a sad state of affairs for the issuer of the global reserve currency.
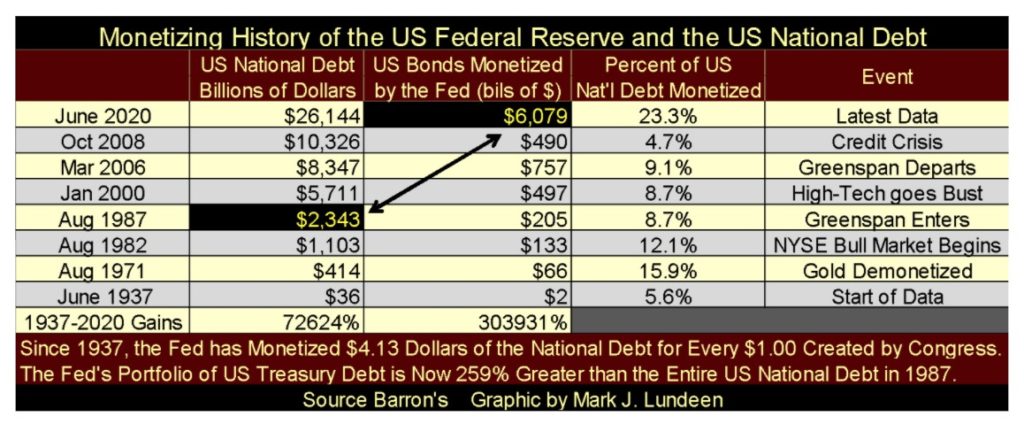
Somehow I came off the topic of foreign holders of US Treasury debt, but I’ve said what I wanted to say about that. So, I’m going to show one more graphic on the “monetizing” history of the Federal Reserve, which has to be the most corrupting institution ever devised by members of the US Congress.
* Yes they did this to us. *
Look at the national debt in June 1937 and the Federal Reserve’s holding of Treasury debt: $36 and $2 billion, but not anymore.
Here’s an item that really bugs me. When Alan Greenspan became Fed Chairman in August 1987 the entire US national debt was $2,343 billion dollars. This week the Fed’s portfolio of Treasury debt at $6,079 billion is now 259% larger than the entire national debt of August 1987, that plus the FOMC has monetized 23.3% of the current national debt.
“The last duty of a central banker is to tell the public the truth.”
– Alan Blinder, Vice Chairman of the Federal Reserve, June 1994
So why isn’t gold now trading over $5,000 and silver $250? Don’t ask Fed Chairman Powell, who like Alan Blinder knows why but would never tell the public the truth of their massive efforts to suppress the prices of the old monetary metals their paper and digital dollars have replaced as money.
The Federal Reserve took over “monetary policy” way back when gold was fixed by law at $20.67 an ounce. Seeing gold now trading at something over $5000 would be an embarrassment, something that might cause some people to think members of the FOMC are either incompetent, totally corrupt or both.
Take a good look at the table above. It’s only a matter of time before gold and silver see their day in the sun. But when? I don’t know, but I think long before the FOMC monetizes 50% of the national debt.
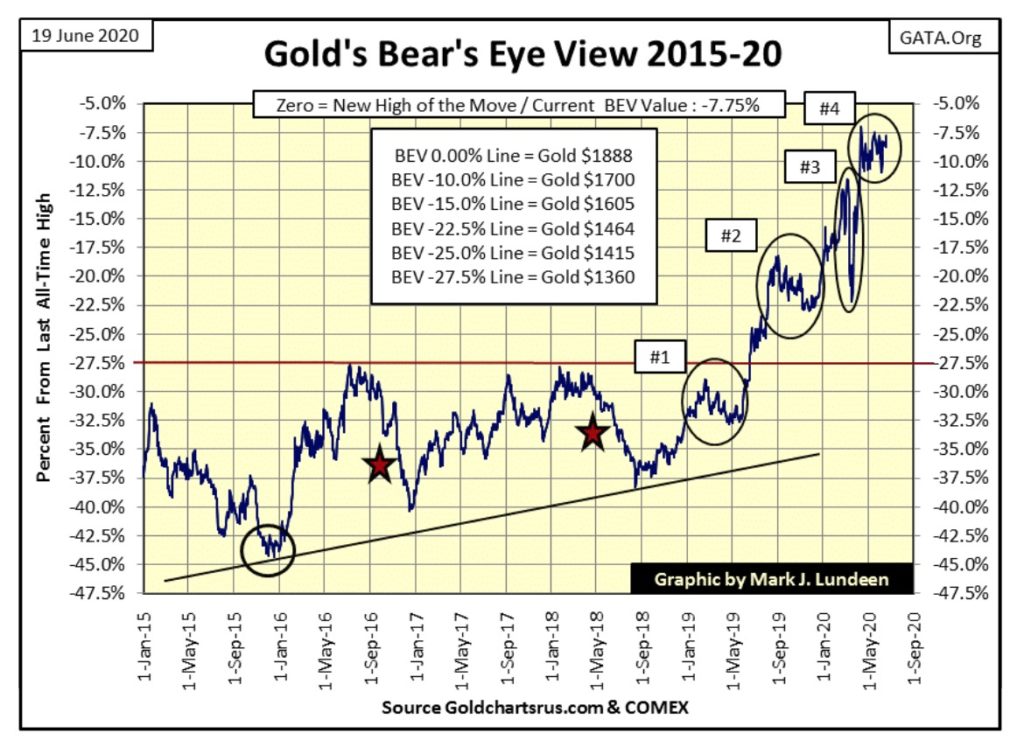
So how has gold performed this past week? Looking at its BEV chart below (#4), much the same as it has these past nine weeks; it can’t break above and stay above its BEV -7.5% level, and can’t break below and stay below its BEV -10% level. So gold has been in a trading range of about 2.5% since mid-April.
Gold won’t stay in this trading range forever. Hopefully gold has some good things coming later this summer, but who can say? Considering the massive inflation the current dollar has suffered at the hands of the “policy makers” since 1971 (see table above), when gold does make its big-breakout advance it will be an advance for the record books. The same or even better goes for silver.
Actually, just the expansion of the FOMC’s balance sheet seen below since last October is enough to drive the prices of gold and silver far above their current levels of $1700 and $17.
But it’s pointless getting upset that precious metals haven’t yet done what we’ve expected them to do. That’s how it’s going to be for as long as the “policy makers” have their meat hooks in their COMEX futures markets, but this too shall pass.
Do what I do to keep things in perspective; pour yourself a generous glass of Old Crow straight Kentucky bourbon, or Wild Turkey 101 if needed and watch this episode of “Car 54 Where are you?” Where Toody and Muldoon Meet the Russians.
Do this before bedtime and get yourself a good night’s sleep safe in the knowledge that all that must happen will eventually happen, but only when it’s ready to. Until then, here are another ninety-six episodes of Car 54 to watch.
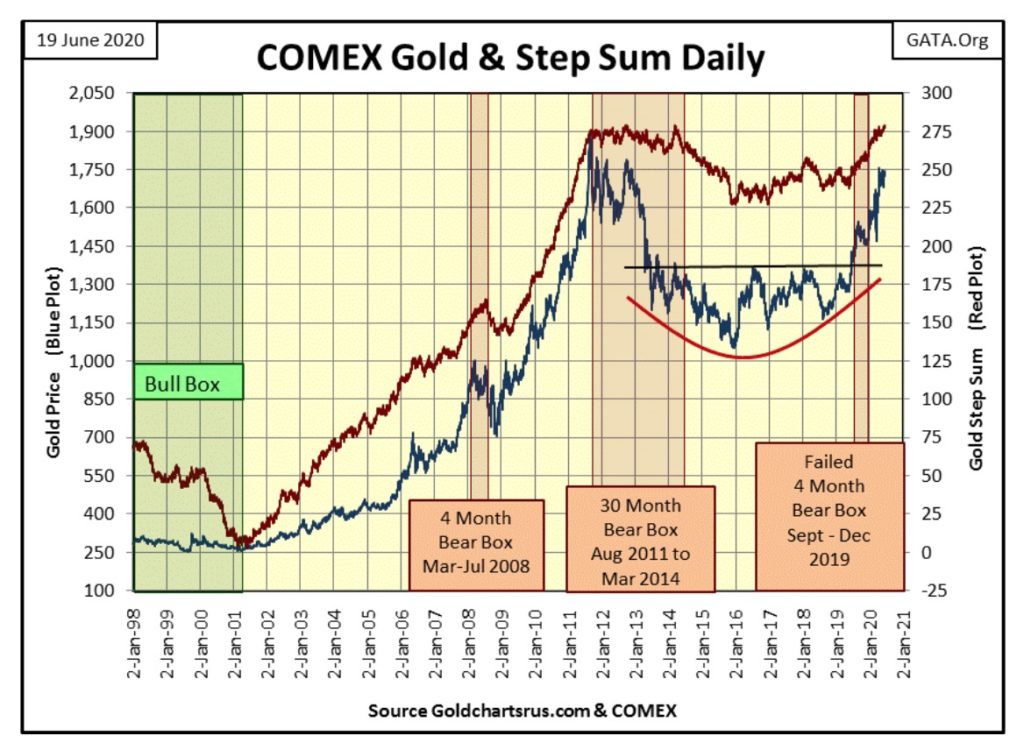
Same story for gold and its step sum. Market sentiment (the step sum plot) continues advancing as market reality (the price of gold) can’t break into the $1800s. It’s been like this since mid-April.
Gold’s last all-time high is $1888. Obviously seeing gold with a handle of $1800 is something the “policymakers” will not tolerate, and currently have the means to prevent.
Not IF, but WHEN gold does rises above $1800 it should indicate the “policy makers” have lost their grip on the price of gold, and we should expect some excitement in the gold and silver markets. Hopefully by this autumn or early Winter.
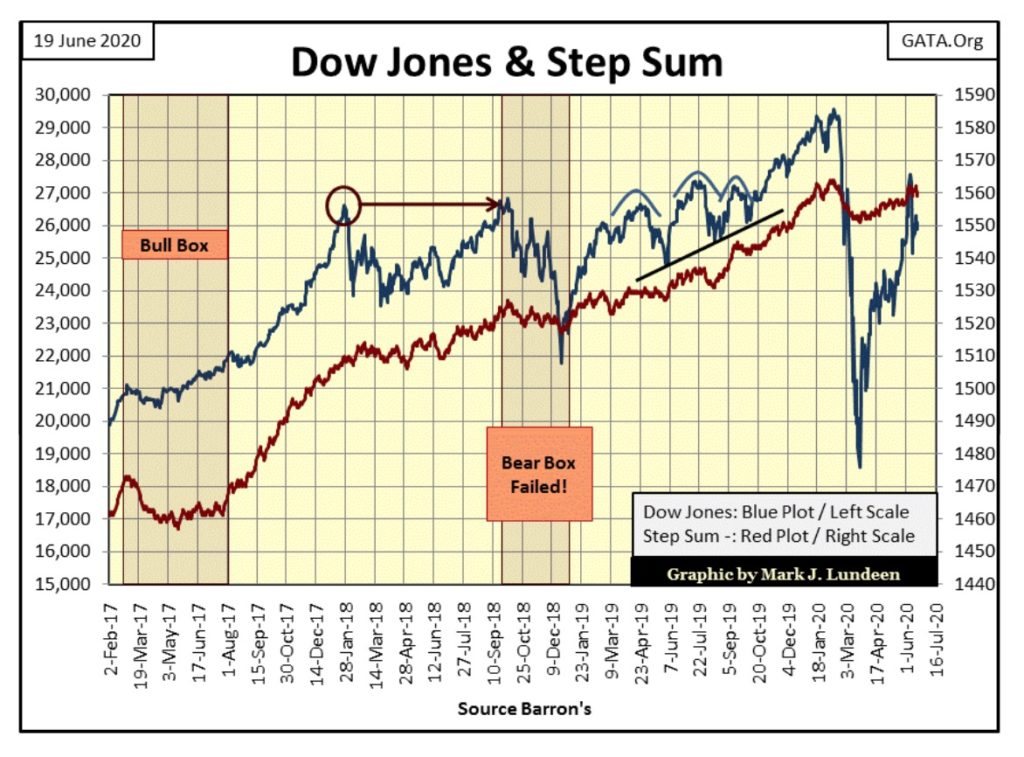
In the Dow Jones’ step sum chart below market sentiment (the step sum) continues trending upward. But until the Dow Jones breaks above its 27,572 of June 8th, or breaks below its 25,128 of June 11th it’s difficult speculating on what’s next to come for the stock market.
Sometimes it’s wise admitting one doesn’t know; and for the Dow Jones this seems like one of those times.
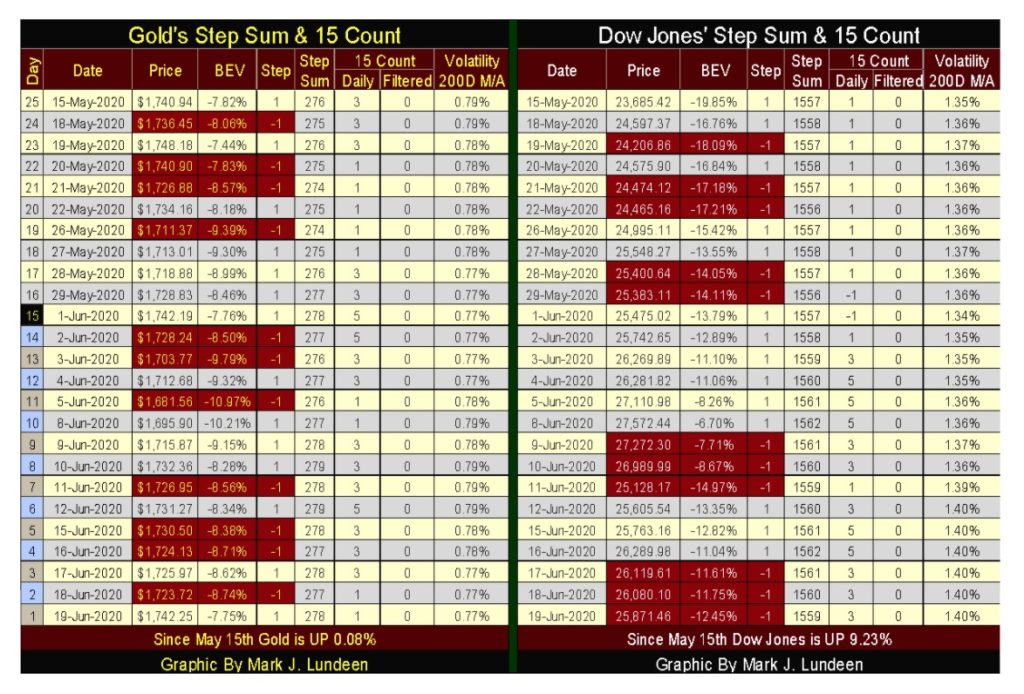
In the step sum table below, gold continues seeing its step sum advancing even as its 15 count has fallen from a +5. It has also advanced in price by 0.08% in the past twenty-five trading sessions. This correction may yet have some more to go. But the bull inside of me tells me good things are coming in the weeks to come.
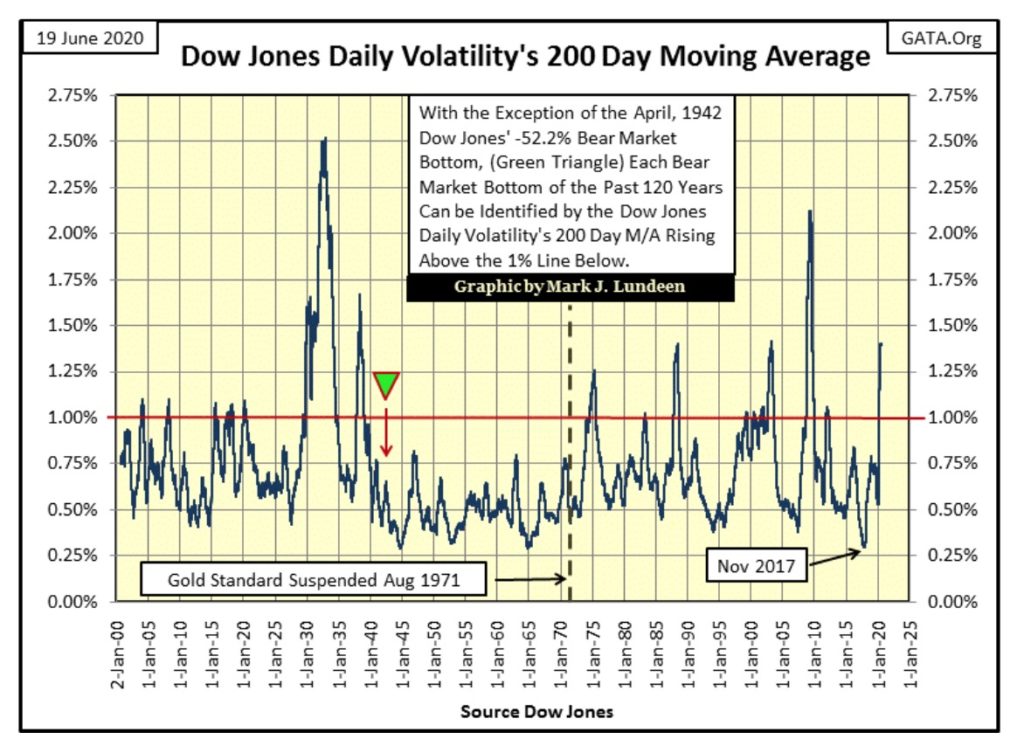
The BIG THING for the Dow Jones is its daily volatility’s 200 day M/A is now at 1.40%. Looking at the chart below we can understand why that is important.
There are only three other bear markets whose volatility has exceeded 1.40%; the two from the 1930s and the 2007-09 sub-prime mortgage bear market. The 1988 and 2002 peaks in volatility were just short of 1.40%. So, everything is in place to call the -37% market decline of March 23 a bear market bottom, if only daily volatility doesn’t continue increasing.
But should daily volatility collapse and the Dow Jones goes on to a new all-time high, it merely postpones the inescapable deflation of the massive inflationary bubble we call our Dow Jones bull market.
Here’s an alarming video that begs the question: Do Black Lives Matter? Watch and you tell me.
This guy will be in big trouble when Al Sharpton and the BLM movement sees this, and then maybe not.
—
(Featured image by Burak K via Pexels)
DISCLAIMER: This article was written by a third party contributor and does not reflect the opinion of Born2Invest, its management, staff or its associates. Please review our disclaimer for more information.
This article may include forward-looking statements. These forward-looking statements generally are identified by the words “believe,” “project,” “estimate,” “become,” “plan,” “will,” and similar expressions. These forward-looking statements involve known and unknown risks as well as uncertainties, including those discussed in the following cautionary statements and elsewhere in this article and on this site. Although the Company may believe that its expectations are based on reasonable assumptions, the actual results that the Company may achieve may differ materially from any forward-looking statements, which reflect the opinions of the management of the Company only as of the date hereof. Additionally, please make sure to read these important disclosures.


Bitcoin Stalls Near $60K as Strategy Moves, ETFs Outflow, and EU MiCA Rules Take Effect
Bitcoin hovers near $60,000 with ETF outflows, while Strategy boosts reserves, sells BTC, and raises dividends to reassure investors. Ethereum...


Cannabis Dominates Global Drug Use: Trends, Risks, and Shifting Markets
Cannabis remains the world’s most widely used illicit drug, with 256 million users in 2024, surpassing all others combined. Growth...


Italy Approves First Hydrogen-Powered Train for National Rail Network
ANSFISA has approved Italy’s first hydrogen-powered train, the Alstom HMU214, for use on the Brescia–Iseo–Edolo line. Capable of 140 km/h,...


Cotton Market Weakness Persists Despite Brief Rebound
Cotton prices fell to new lows last week before a modest rebound. USDA data shows crop conditions remain worse than...


Eli Lilly Hits $1 Trillion Valuation Amid Strong Bullish Momentum
Eli Lilly stock hit a record high, surpassing $1 trillion market value after strong product demand. Shares surged over 7%,...
 |
|
 |  |
 |
|
-

 Crowdfunding2 weeks ago
Temotiva Launches Crowdfunding Campaign to Advance Preventive Mental Health
-
 Crypto7 days ago
Bitcoin Holds Steady as Microtransactions Surge and ETF Inflows Continue
-

 Biotech2 weeks ago
AseBio 2025 Report Highlights Growth and Future Potential of Spanish Biotechnology
-
 Cannabis5 days ago
Tilray (TLRY) Falls as Bearish Momentum Persists Despite Marketing Push