Featured
A Volatile Week on the Stock Markets Has Nothing Good to Bring
The U.S. passed $31 trillion in federal debt. We have a look at that and attempt to explain what it means. Credit Suisse is touted as being on the brink of collapse, the next Lehman Brothers. But its numbers say it is unlikely. Credit Suisse is the subject of our “Chart of the Week.” The job numbers, while coming in largely as expected, received a frosty reception from the stock market and gold.

U.S. federal debt just surpassed $31 trillion. For those that like zeros that’s $31,000,000,000,000. No other country is even remotely close. The closest is Japan with roughly $15.3 trillion in debt. Two-thirds of the U.S. debt, $20.3 trillion, has been acquired since the 2008 financial crisis. GDP, on the other hand, has grown by only $10.7 trillion, implying that it has taken $1.90 of new federal debt to acquire $1 of GDP. It gets worse. Total debt for governments at all levels (federal, state, municipal) corporate non-financial, and financial, and consumers/households have seen their total debt increase by $41.7 trillion. That implies that it took $3.90 of new debt to purchase $1 of GDP. Arguably, it could be unsustainable. Pay it back? Not likely.
U.S. Debt by Sector: 2000–2022
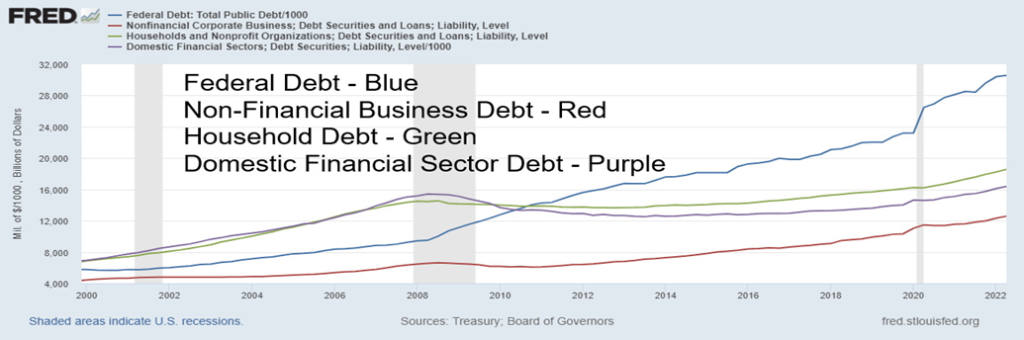
As disturbing as all that sounds, investors should maintain some perspective. First, the U.S. dollar is the world’s reserve currency. What that means is that the U.S. can effectively export its debt to others. Central banks around the world maintain the bulk of their reserves, currently estimated at about 60% in U.S. treasury securities. Second, while the cost of borrowing has gone up as a result of recent interest rate hikes, the rate of inflation is still sharply higher. That continues to make borrowing relatively cheap vis-à-vis inflation. Inflation also helps lower the real value of the debt, but because of the lack of inflation indexing it increases the tax burden on capital investment. Effectively they monetize the debt. Nonetheless, the recent rise in interest rates could add upwards of $1 trillion annually to the treasury’s interest payments.
Roughly $6.8 trillion of the U.S. federal debt is owned by other U.S. federal agencies such as the Social Security Trust Fund that dispenses old-age security cheques and more. The remaining $24.3 trillion is held by the public. But the public is led by foreign and international investors who currently hold roughly $7.6 trillion. The bulk of that is held by central banks. Japan is the largest foreign holder, last at $1.2 trillion. The Federal Reserve holds some $5.6 trillion of U.S. treasury securities. Much of this was purchased during the multiple rounds of quantitative easing (QE) after the 2008 financial crisis and the pandemic crisis of 2020. The remainder is held by mutual funds, pension funds, insurance companies, U.S. savings bonds, brokers and dealers, banks, trust companies, corporate and non-corporate businesses, and even individuals. The U.S. treasury market is the deepest and the most liquid bond market in the world.
Debt to GDP is also important and here the U.S. is a leader with a current federal debt to GDP of 125%. No, it is not the highest in the world. Japan holds that distinction with a federal debt to GDP of 289%. If one takes into consideration all U.S. government debt—federal, state, and municipal—the debt to GDP ratio is 139%. Canada’s government debt (all levels) debt to GDP is 106%. But the federal portion of debt to GDP is 63%, given recent increases in federal debt. The remainder is held by the provinces and municipalities.
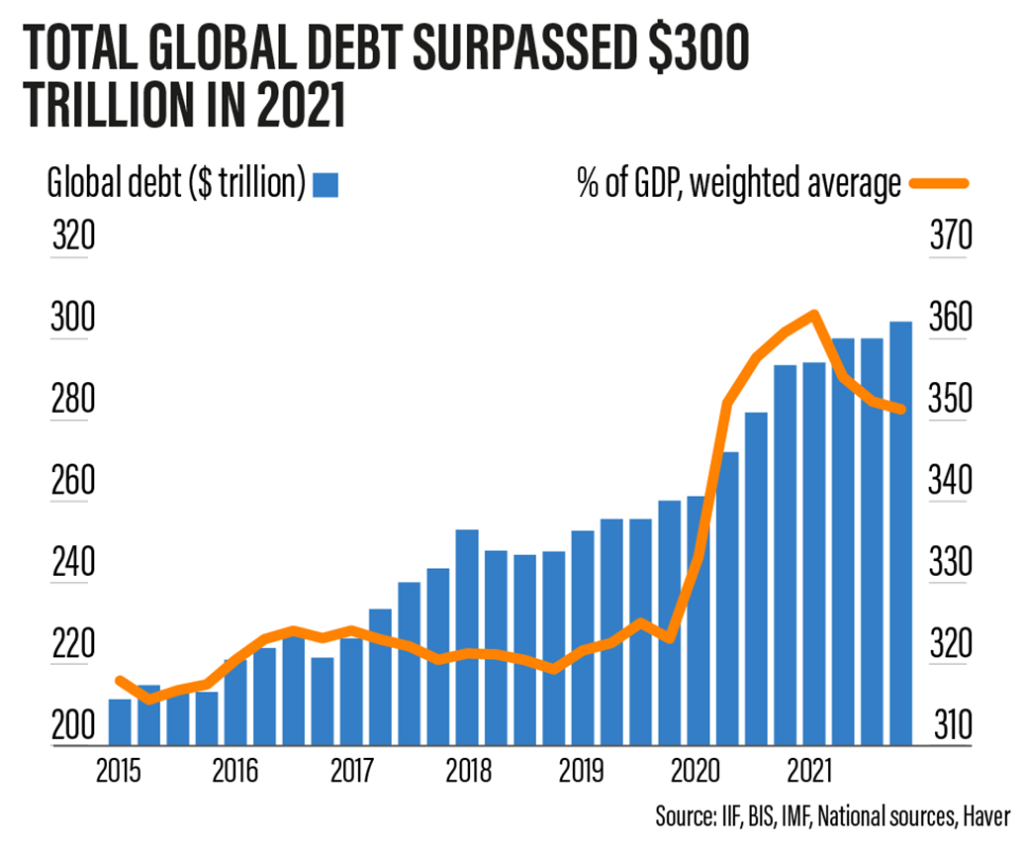
Global debt surpassed $300 trillion in 2021 and continues to climb. Global debt has more than doubled since the 2008 financial crisis. Global debt includes all debt of governments including federal, state or provinces, and municipalities, non-financial corporate debt (i.e., technology companies, mining companies, etc.) plus household debt which includes mortgages, consumer loans, credit cards, and student loans. Sovereign debt gets the most attention and the risk of sovereign default is high in a number of cases.
A number of countries including Lebanon, Sri Lanka, Suriname, Russia, and Zambia are already in default. Ukraine is also technically in default with its debt downgraded by both Fitch and S&P to junk/default status. Others are not far behind including Argentina, Belarus, Pakistan, Kenya, Tunisia, Ghana, Egypt, Venezuela—we could go on. While a few suggest that the U.S. is at risk of default, the odds of that happening are actually slim to none, other than technical defaults if the U.S. failed to pass debt ceilings. The U.S.’s S&P rating is AA+. Few have an AAA rating but that list does include Germany, Australia, Canada, Switzerland, Denmark, Luxemburg, Netherlands, Norway, Liechtenstein, Sweden, and Singapore.
Only two U.S. corporations hold an AAA credit rating: Microsoft (MSFT) and Johnson & Johnson (JJJ). A BBB rating is the lowest investment grade, and it is telling that in the U.S. some 77% of corporations are rated BBB, the lowest investment grade possible. The risk of numerous corporations falling below the investment grade
BBB rating is high, given higher interest rates accompanied by a recession. That could force mass selling of bonds as pension funds and others are forced to divest themselves of anything below investment grade. Household debt is also a big worry and here the five highest countries in the world with household debt to GDP in excess of 100% are Switzerland, Australia, Canada, South Korea, and Netherlands.
The list of sovereign debt crisis is lengthy. Since 2000, we’ve had more than two dozen with the most recent being the high-profile debt default by Russia, even if that default was engineered by the U.S. in refusing to accept payments. We’ve also seen more than three dozen major corporate collapses since 2000, including high-profile ones such as Lehman Brothers, Nortel, Enron, and the high-profile accounting firm Arthur Anderson.
The 2008 financial crisis was just another banking crisis in a long list of banking and financial crisis that have been ongoing for centuries. Now we’ve had stock markets falling for ten months and we still haven’t had a banking crisis. The question is not whether will it happen, but when will it happen. The risks of a banking and debt crisis remains high. Our Chart of the Week notes the recent problems with Credit Suisse (CS/NYSE). Already we are reading about insurance companies nearing collapse as a result of Hurricane Ian. There is a list of at least 27 insurance companies that the Florida Office of Insurance has deemed financially unstable. Some could fail. Apparently, six have already declared bankruptcy this year. Could that play into a bigger financial crisis?
There is little indication that the central banks are going to slow interest rate hikes. The September job numbers put an end to any thought that the Fed and others might ease off. Fed Chair Jerome Powell and BofC Governor Tiff Macklem have as much as said so. Their aim is to bring down the rate of inflation and they seem to fully realize that it could cause a recession. Of course, they are hoping for a soft landing. As Macklem has said, conquering inflation with higher interest rates still takes priority despite potential costs. While it is not the case in Canada, other countries, particularly in the EU and Asia, are facing a currency crisis because they are not raising their rates fast enough. The result is the U.S. dollar is rising sharply. That in turn could trigger a currency crash as we saw in 1997 when the Thai Bhat collapsed, triggering what became known as the Asian flu crisis.
The combination of rising inflation, rising interest rates, a rising U.S. dollar, sinking currencies, geopolitical tensions, domestic political tensions plus the effects of climate change triggering super-destructive storms, fires, etc. could spark a bigger financial crisis and even a stock market crash to come. Liquidity is becoming a concern. As we note, the question is not if, the question is when.
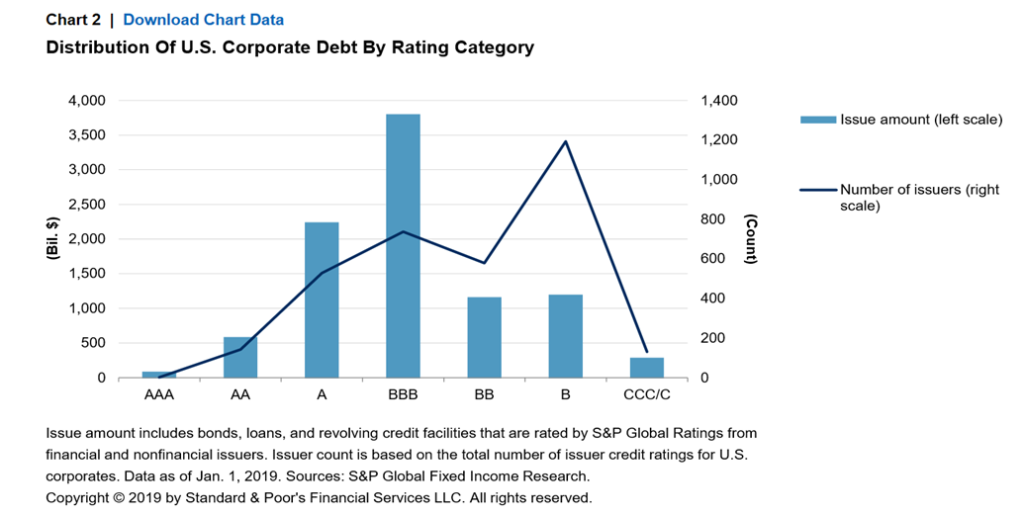
Chart of the Week
Credit Suisse 2019–2022
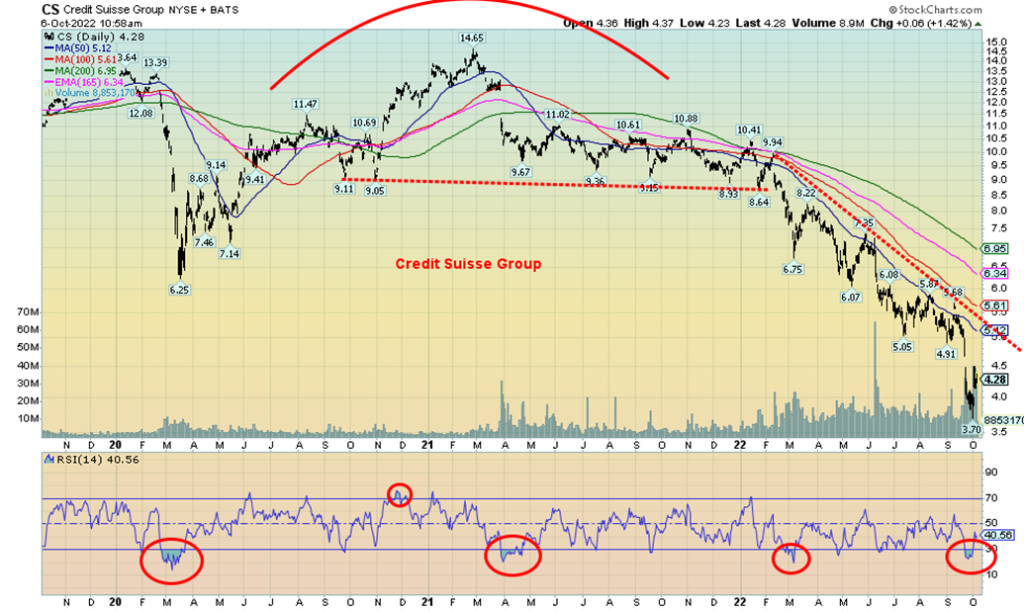
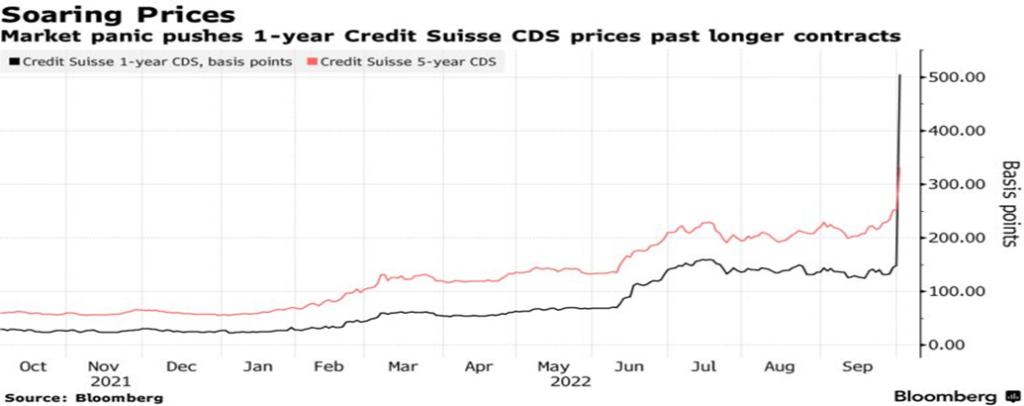
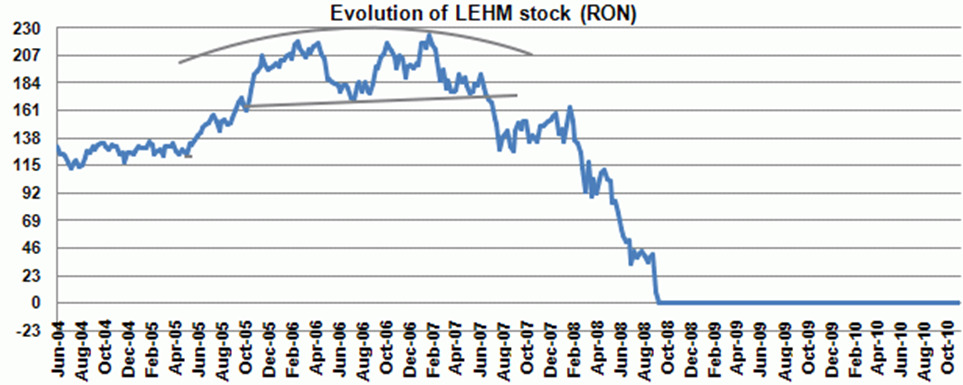
Is Credit Suisse (CS/NYSE) the next Lehman Brothers? This is a question that is being asked, given the circus of scandals, and departures that have plagued the bank over the past year. Its stock, once priced at a lofty $52 way back in 2006, has fallen to around $4.25, a decline of about 92%. CS is down 55% so far in 2022. Its market cap has fallen to around $11 billion. Quite the comedown for what was once one of the most prestigious banks in the world.
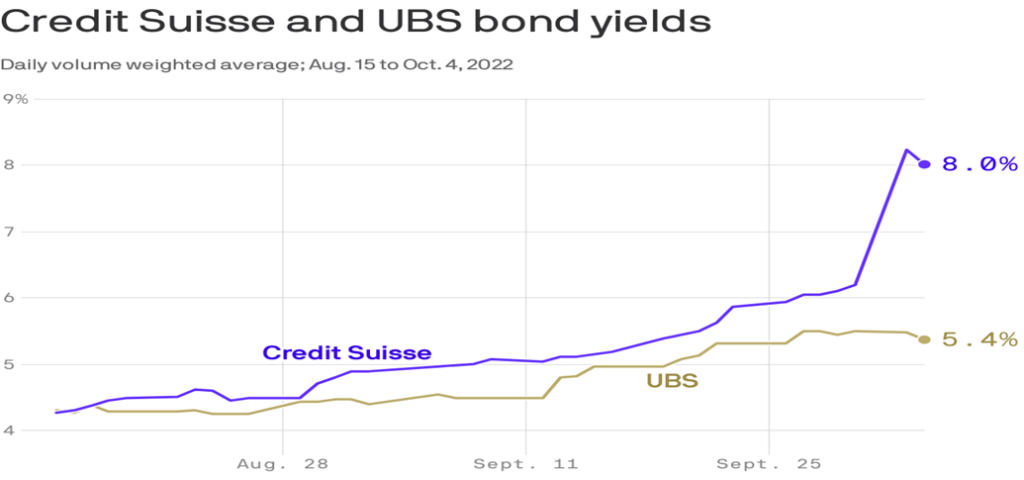
CS’s credit spreads have exploded to the upside. What was once thought impossible is now possible. One-year CDs are quoted at 500 bp over and the 5-year bond at 300 bp over. Credit Suisse is now making the problems of Deutsche Bank and Barclays PLC look miniscule. The credit spreads are saying there is a 23% chance of default of its obligations over the next five years. Credit Suisse’s bond yields are also widening with respect to its peers. (See charts on the next page.)
We suppose, then, it’s no surprise to hear that Credit Suisse is looking for a large investor. Warren Buffett? But the weird part of all of this is that it all seems to be a bit overblown. CS actually has a decent capital position.
Its market cap is down to $11 billion, but that’s roughly only a quarter of its book value. CS also has Sfr37 billion of tier-one capital and Sfr15.8 billion of a contingent convertible bond that would automatically convert
to equity if the bank was in serious trouble. CS also has Sfr44.2 billion of “going concern capital.”
Credit Suisse Credit Spreads 2021–2022
Credit Suisse Bond Yields
All of that contingent capital totals up to Sfr97 billion of capital that CS would need to plow through if necessary. Also, CS is in the category of “too big to fail.” So, would the state enter the picture if necessary? Credit Suisse may have some problems, but it also appears that the fear may have become overblown. Nonetheless, it is important to note these problems. Some 14 years ago, the problems at the banks and dealers concerning sub-prime mortgages and more did not get the look they should have. The downfall of Lehman Brothers (and even AIG) came as a shock. But the problems at Credit Suisse appear to be only for Credit Suisse, whereas 14 years ago the potential was there for systemic failure to spread to the entire banking system.
Problems in the investment banking arm got Credit Suisse in trouble. It has a lot of investments that went south. The most notable was CS’s $5.5 billion loss in the collapse of Archegos Capital Management, the large family office. But Credit Suisse has a huge wealth management arm with some Sfr1.5 trillion of assets under management and that is one of its best units. Problems are afoot at one of the world’s largest and most prestigious banks. But other than maintaining a watch on CS, the danger of an imminent collapse appears to be overdone.
That said, there is considerable danger in the European banking system as a result of the ongoing war in Ukraine and the energy crisis that is engulfing the EU. That is where the real danger lies. Credit Suisse may just be a symptom of bigger problems elsewhere.
Lehman Brothers 2004–2010
Markets & Trends
| % Gains (Losses) Trends | ||||||||
| Close Dec 31/21 | Close Oct 7/22 | Week | YTD | Daily (Short Term) | Weekly (Intermediate) | Monthly (Long Term) | ||
| Stock Market Indices | ||||||||
| `S&P 500 | 4,766.18 | 3,639.66 | 1.5% | (23.6)% | down | down | neutral | |
| Dow Jones Industrials | 36,333.30 | 29,296.79 | 2.0% | (19.4)% | down | down | neutral | |
| Dow Jones Transport | 16,478.26 | 12,477.32 | 3.5% | (24.3)% | down | down | neutral | |
| NASDAQ | 15,644.97 | 10,652.40 | 0.7% | (31.9)% | down | down | down (weak) | |
| S&P/TSX Composite | 21,222.84 | 18,583.13 | 0.8% | (12.4)% | down | down | neutral | |
| S&P/TSX Venture (CDNX) | 939.18 | 608.02 | 2.3% | (35.3)% | down | down | down | |
| S&P 600 | 1,401.71 | 1,093.73 | 2.7% | (22.0)% | down | down | neutral | |
| MSCI World Index | 2,354.17 | 1,755.04 | 3.7% | (25.5)% | down | down | down | |
| Bitcoin | 47,907.71 | 19,655.55 | (1.5)% | (59.0)% | down | down | down | |
| Gold Mining Stock Indices | ||||||||
| Gold Bugs Index (HUI) | 258.87 | 197.80 | 1.8% | (23.6)% | down | down | down | |
| TSX Gold Index (TGD) | 292.16 | 243.43 | 0.5% | (16.7)% | down | down | down | |
| % | ||||||||
| U.S. 10-Year Treasury Bond yield | 1.52% | 3.89% | 1.6% | 155.9% | ||||
| Cdn. 10-Year Bond CGB yield | 1.43% | 3.39% | 3.9% | 137.6% | ||||
| Recession Watch Spreads | ||||||||
| U.S. 2-year 10-year Treasury spread | 0.79% | (0.42)% | 4.5% | (153.2)% | ||||
| Cdn 2-year 10-year CGB spread | 0.48% | (0.66)% | (4.8)% | (237.5)% | ||||
| Currencies | ||||||||
| US$ Index | 95.59 | 112.68 | 0.5% | 17.9% | up | up | up | |
| Canadian $ | .7905 | 0.7285 | 0.6% | (7.8)% | down | down | down | |
| Euro | 113.74 | 97.39 | (0.7)% | (14.4)% | down | down | down | |
| Swiss Franc | 109.77 | 100.52 | (0.9)% | (8.4)% | down | down | down | |
| British Pound | 135.45 | 110.80 | (0.6)% | (18.1)% | down | down | down | |
| Japanese Yen | 86.85 | 68.79 | (0.4)% | (20.8)% | down | down | down | |
| Precious Metals | ||||||||
| Gold | 1,828.60 | 1,709.30 | 2.2% | (6.5)% | down | down | neutral | |
| Silver | 23.35 | 20.25 | 6.4% | (13.3)% | up | down | down (weak) | |
| Platinum | 966.20 | 917.90 | 6.8% | (5.0)% | up | down | down (weak) | |
| Base Metals | ||||||||
| Palladium | 1,912.10 | 2,191.30 | 0.4% | 14.6% | up | neutral | neutral | |
| Copper | 4.46 | 3.39 | (0.6)% | (24.1)% | down | down | neutral | |
| Energy | ||||||||
| WTI Oil | 75.21 | 92.64 | 16.5% | 23.2% | up | down | up | |
| Nat Gas | 3.73 | 6.75 | (0.3)% | 81.0 | down | neutral | up | |
New highs/lows refer to new 52-week highs/lows and, in some cases, all-time highs.
U.S. Job Numbers
The verdict was swift. The markets didn’t like the job numbers, even as they came in largely as expected (expected was 250,000 to 275,000). The stock market fell sharply, gold and silver fell, gold stocks took a hit, and the US$ Index leaped. Oh, and oil prices were rising again as well. If there were any thoughts that the Fed and the other central banks might ease up on their interest rate hikes, the September job numbers have probably put that thought to rest.
Nonfarm payrolls rose 263,000 in September, which was slightly better than the expected 250,000 gain. In a bit of irony (is that the right word?), nonfarm payrolls at a total of 153,018 thousand are up only 514,000 from February 2020. The unemployment rate (U3) fell to 3.5%, which is the same as it was in February 2020 but down from 3.7% seen in August. It shouldn’t be a surprise, really, as the labour force actually shrunk by 57,000. That in turn is only 106,000 higher than what was seen in February 2020. All of this is interesting because the population of those 16 years of age and older is up by only 172,000 in September but up 4,728,000 from February 2020. No surprise then that the number for those not in the labour force was up 229,000 in September and up 4,622,000 since February 2020. Not everyone is retired and not everyone has to stay at home to take care of kids or act as a caregiver to the sick or elderly.
With the number in the labour force shrinking, it was no surprise to see the labour force participation rate slip to 62.3% from 62.4%. In February 2020, it was 63.4%. The employment-population rate was unchanged at 60.1% and it was 61.2% in February 2020.
Markets don’t focus on these other numbers. It’s the headline number that matters and what they see is that the job market grew faster than expected in September. That in turn keeps the pressure on for continuing interest rate hikes and quantitative tightening (QT). The gain in nonfarm may have been the lowest in months, but it was still high enough to spook the markets. The gain was the smallest seen since April 2021. The Fed may be trying to avoid a recession, but the other side here is that it is trying to also bring down the rate of inflation.
The U6 unemployment rate (the U3 rate plus short-term discouraged workers and other marginally attached workers forced to work part-time but seeking full-time) fell to 6.7% from 7%. Again, that was as a result of the shrinkage of the labor force and it was the same as February 2020. The Shadow Stats www.shadowstats.com unemployment (which is U6 plus long-term discouraged workers unemployed over one year and those defined out of the labour force in a revision in 1994) slipped to 24.4% from 24.6%. In February 2020 the Shadow Stats rate was 21.3%.
The biggest job gains were seen in education and health care as well as in leisure and hospitality. Government jobs were the weakest, falling by 25,000. Wage growth continued as the average hourly earnings rose 5% year-over-year. But the inflation rate is 8.3%. So, it is still below that rate. It was also below the 5.2% seen in August.
Full-time employment rose 326,000 while part-time employment was down 7,000. From February 2020, full-time employment is up 1,822,000 and part-time employment is down 1,618,000. That also helps keep upward pressure on wages.
U.S. Inflation Rate vs. Average Hourly Earnings 2012–2022
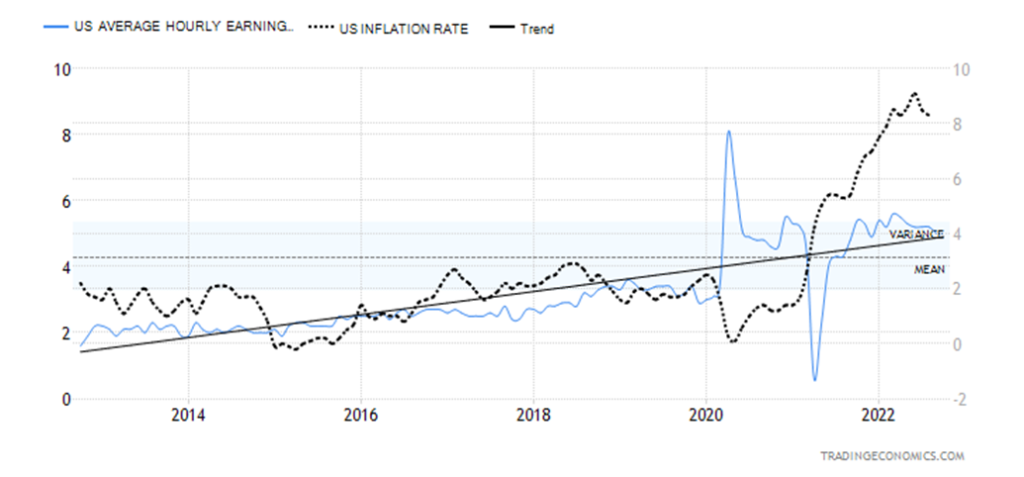
The bottom line is, while the rate of job growth appears to be slowing, it is not slowing fast enough to change the course of the Fed. The economy is still not shedding workers to any extent. All this may be against the backdrop of a sinking stock market and a teetering housing market, but it is not stopping the 10-year U.S. treasury note from continuing to rise (last at 3.88%). And it is not going to deter the Fed from its goal of bringing down inflation through interest rate hikes and QT. Expectations are for at least a 50 bp rate hike in November and December. Could they go 75 bp instead? It wouldn’t be a surprise.
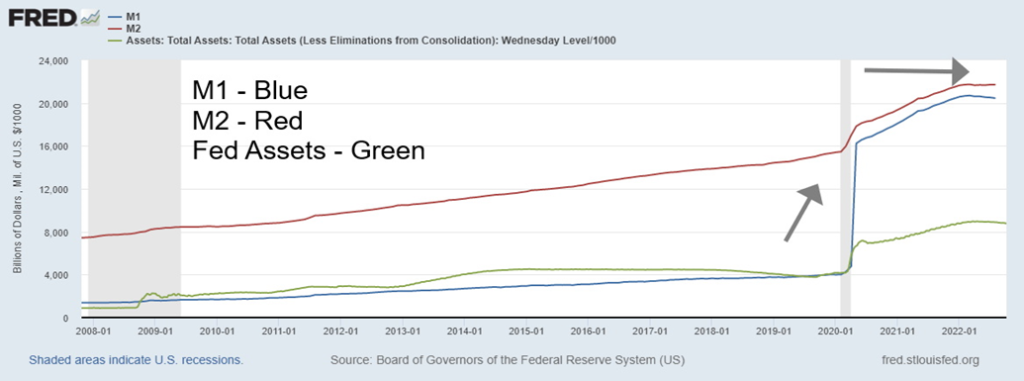
And also lurking in the background is a shrinking money supply. Since peaking, M1 has fallen $684 billion, M2 is down $449 billion, and the Fed’s balance sheet has contracted by $206 billion. The Fed continues to drain the financial system. Could that in turn spark a financial crisis as liquidity dries up? That remains possible.
Money Supply M1, M2 plus Fed Assets 2007–2022
Canada Job Numbers
Canada – Employed persons vs. Unemployed persons 2012–2022
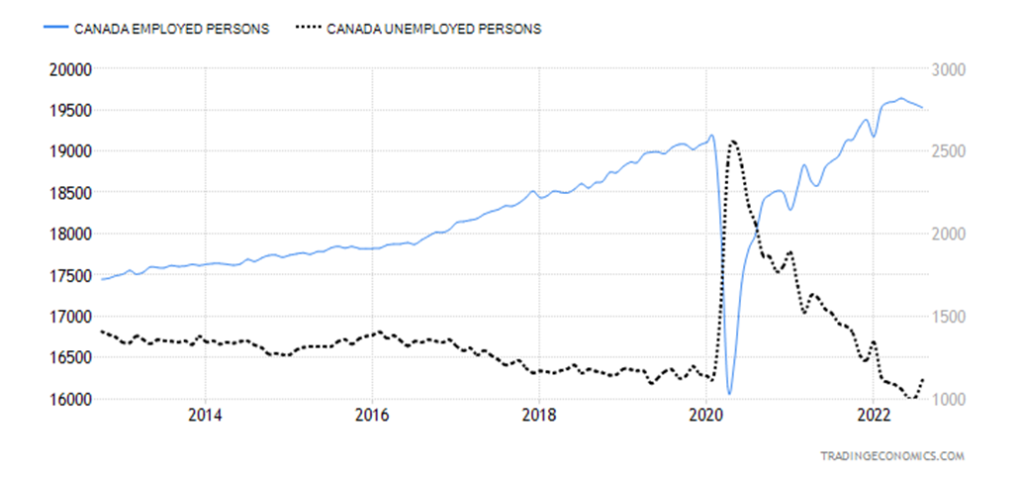
Canada saw a rise in jobs in September for the first time in four months. Canada added 21,000 jobs which was slightly above the consensus of 20,000 jobs. The unemployment rate fell to 5.2% from 5.4%, thanks in part to a contraction in the labor force that saw it shrink 20,300. The labor force has shrunk by some 80,000 since May. The labor force participation rate slipped to 64.7% from 64.8% while the employment-population ratio remained unchanged at 61.3%. Not only did the main unemployment rate fall but the R8 unemployment rate, which is the highest level reported by Statistics Canada, fell to 6.3% from 7.9%. The R8 rate includes discouraged workers along with involuntary part-time workers.
The jump in employment in September ended three consecutive months of declines. During that time the Canadian economy shed 113,000 jobs. Despite all of that, BofC Governor Tiff Macklem still sees the Canadian labour market at or near full capacity with wage growth still rising and inflation still being pressured upwards. It is unlikely to change the course of the BofC, which next meets on October 26. It is widely expected that at least another 50 bp hike is coming with some expecting another 75 bp. The main beneficiary of jobs in September was in the education sector as schools reopened. Employment increases were seen in B.C. and other provinces, but both Ontario and P.E.I. lost jobs.
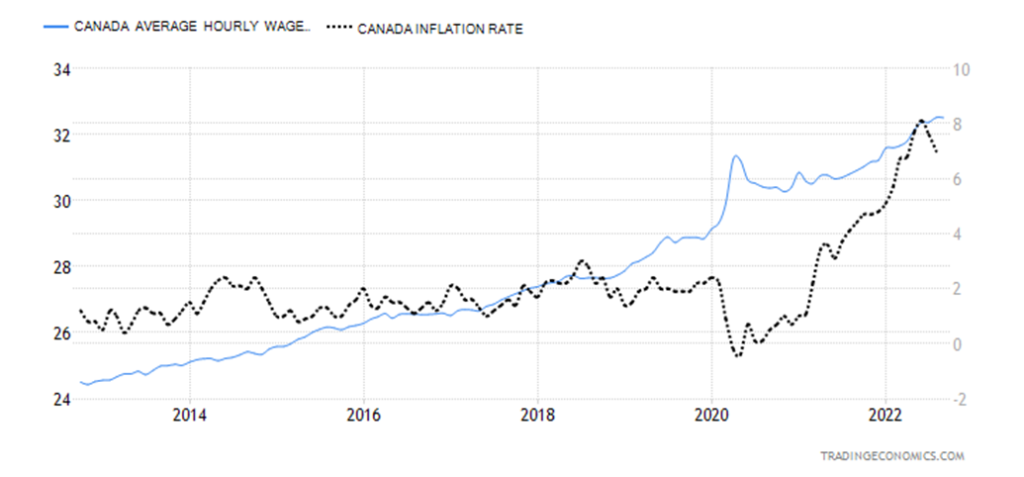
Average hourly wages increased year-over-year 5.2% but a reminder that inflation was last reported at 7%. None of these changes the outlook we see for rate hikes. Note that M1 money supply continues to contract as is the case in the U.S. The Bank of Canada’s balance sheet also continues to contract, having fallen $57.3 billion since December 2021. Nonetheless, it is still some $289 billion above the level seen at the beginning of March 2020. Interest rate hikes and QT are a reality in Canada as well.
Canada, Average Hourly Wage Gains vs. Inflation Rate 2012–2022
Are we on crash alert for the stock markets? Elliott Wave International (www.elliottwave.com) seems to believe it could happen and put out an interim bulletin of the Elliott Wave Theorist this week, outlining their thoughts. After all, October is known as the crash month: October 1929, 1987 plus other lesser-known ones in October 1997, 1978, 1979, the Friday the 13th collapse in 1989, and the Lehman Brothers meltdown in September/October 2008. But October is also the bear killer, ending 12 bear markets: 1946, 1957, 1960, 1966, 1974, 1987, 1990, 1998, 2001, 2002, and 2011. October 7, 2007 was the top of the 2007–2009 bear market. As well, the worst six months of the year end in October. In other words, October may be the crash month, but it’s also a great month to buy. The question is, which comes first? The crash or the buying opportunity? The buying opportunity would come after the crash. We might be wary of October 19–21 as that is the 35th anniversary of the 1987 crash. Sometimes history repeats itself.
It was in some respects quite a week with the U.S. federal debt surpassing $31 trillion, OPEC and its 2 million bpd cut in production, somewhat better than expected September job numbers (where’s the job slowdown?), bulls wanting the Fed to slow down its rate hikes, Russia threatening nuclear war, North Korea launching missiles, Biden claiming Armageddon is coming, Russia’s bridge link to Crimea suffering severe damage following a truck bombing, probable sabotage on Nord Stream 1, the uprising in Iran, the ferocity of Hurricane Ian, and the Blue Jays losing the opener in their playoff series, then being eliminated in the second game after being up 8-1. Ouch!
Some time back we claimed that the Fed was caught between a rock and hard place. Hike interest rates to combat inflation but still try to keep the economy from falling into recession and the financial system from a meltdown. The two are in conflict with each other. The Fed, of course, is counting on a soft landing for the economy and that the financial system does not come apart at the seams.
The U.K. has some recent experience with things coming apart at the seams. Their recent attempts at tax cutting in the face of inflation blew up in their face as the gilt market began to implode, the pound sunk towards par, pension funds teetered, and the BOE was forced to come to the rescue. The U.K. government, with considerable egg on their face, did a 180-degree reversal. No more tax cuts. But in that short space they almost brought down the U.K. financial system. That in turn could have sparked a global contagion.
On the week, the markets had gains despite Friday’s meltdown. The S&P 500 gained 1.5%, the Dow Jones Industrials (DJI) was up 2.0%, the Dow Jones Transportations (DJT) up 3.5%, the NASDAQ up 0.7%, the S&P 600 small cap up 2.7%, and the S&P 400 mid cap up 2.9%, the Wilshire 5000 up 1.6%, the S&P 500 Equal Weight Index up 2.3%, and the NY FANG Index down 1.1%, making it an exception. In Canada, the TSX Composite gained 0.8% and the TSX Venture Exchange (CDNX) was up 2.3%. In the EU, the London FTSE gained 1.4%, the Paris CAC 40 was up 1.8%, and the German DAX was up 1.3%. In Asia, China’s Shanghai Index was closed for a week-long national holiday but the Tokyo Nikkei Dow (TKN) gained 4.6%. The MSCI World Index gained 3.7% on the week. Bitcoin was a loser, off 1.5%.
The S&P 500 is down 23.6% on the year and 24% from its all-time high. Bear markets abound. Sentiment is poor. The Fear and Greed Index was last at 22, extreme fear. Okay, a week ago it was at 15. Hedgeye Risk Management CEO Keith McCullough says the coming recession could be the biggest ever. He recommends prayer. Martin Armstrong of Armstrong Economics is warning of us to “beware of November” with his warning centering around the November elections in the U.S. Others are claiming that World War III is already underway as things deteriorate between the West and Russia/China.
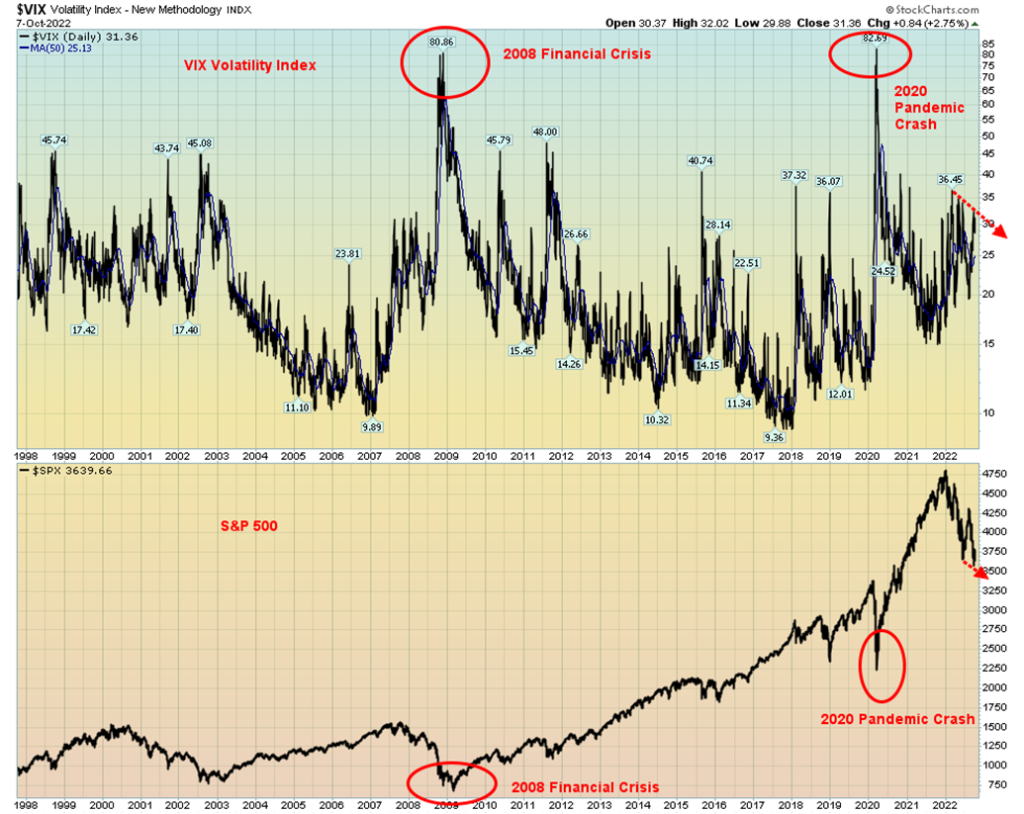
Indicators we follow all are at or near extreme bearish levels. Contrarians usually take note and read it as a sign that we could be making a bottom. The VIX Volatility Index is diverging with the price action and sits well below levels seen in 2008 and 2020. Our chart of the VIX on the next page shows the extremes it reached in 2008 and 2020. It’s small in the corner but the VIX has been making lower highs while the S&P 500 makes lower lows. A divergence.
Despite markets being up on the week it has not been a good week. There are those that expect worse to follow. Be warned.
VIX Volatility Index 1997–2022
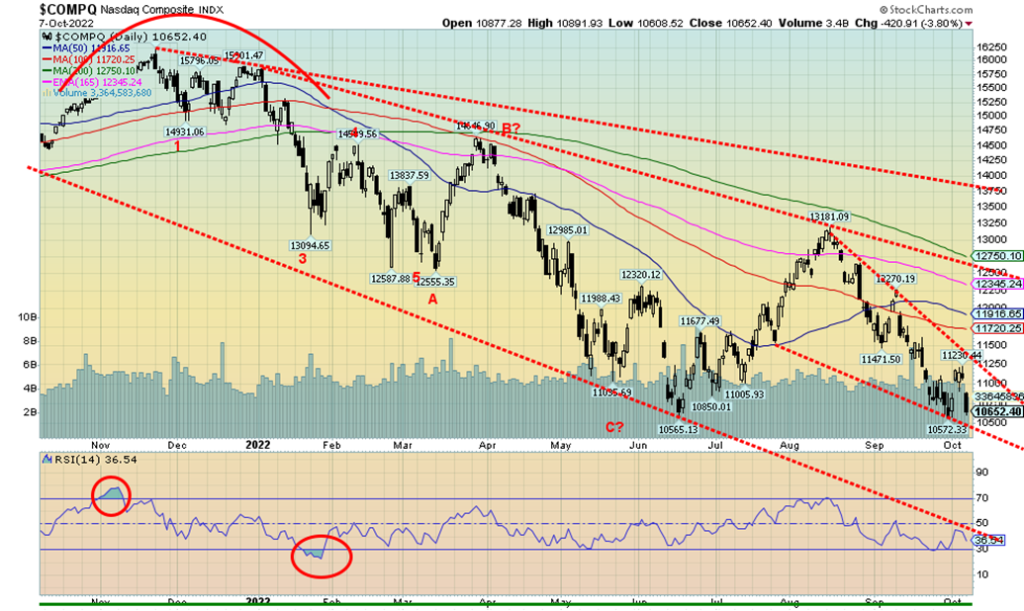
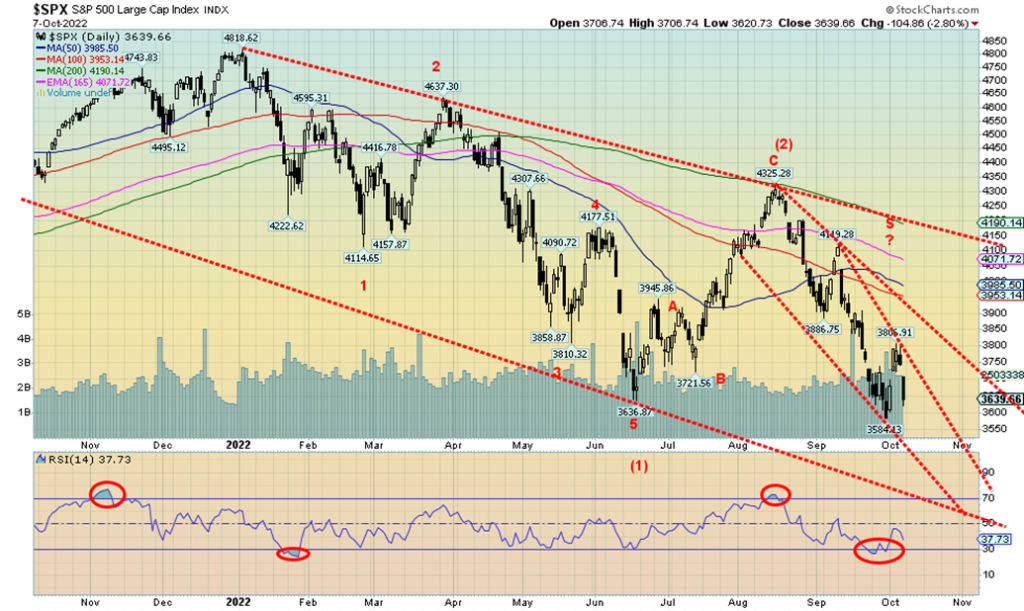
So far, the NASDAQ has held above its most recent 52-week low (10,565), but barely. Once again, it appears to be taking a run at that low. The NASDAQ was the weakest of the major indices this past week, gaining 0.7% thanks to a strong rebound earlier in the week. On Friday, following the job numbers, the NASDAQ fell 420 points or 3.8%. New lows appear to be on the horizon. Our favorite FAANGs saw only one new 52-week low, META. The NY Fang Index was down 1.1% on the week. The components were mixed with Twitter, Apple, Amazon, Baidu, Alibaba, and Microsoft all seeing gains. Twitter led the way with a gain of 12.2%. But the losers META, Netflix, Tesla, and Nvidia seemed to overtake them. Tesla fell 15.9% and Netflix dropped 4.5%. We would not be surprised at new lows this coming week. Regaining above 11,250 would be positive, but we really need to take out 12,750 to convince us that this might have further legs to the upside.
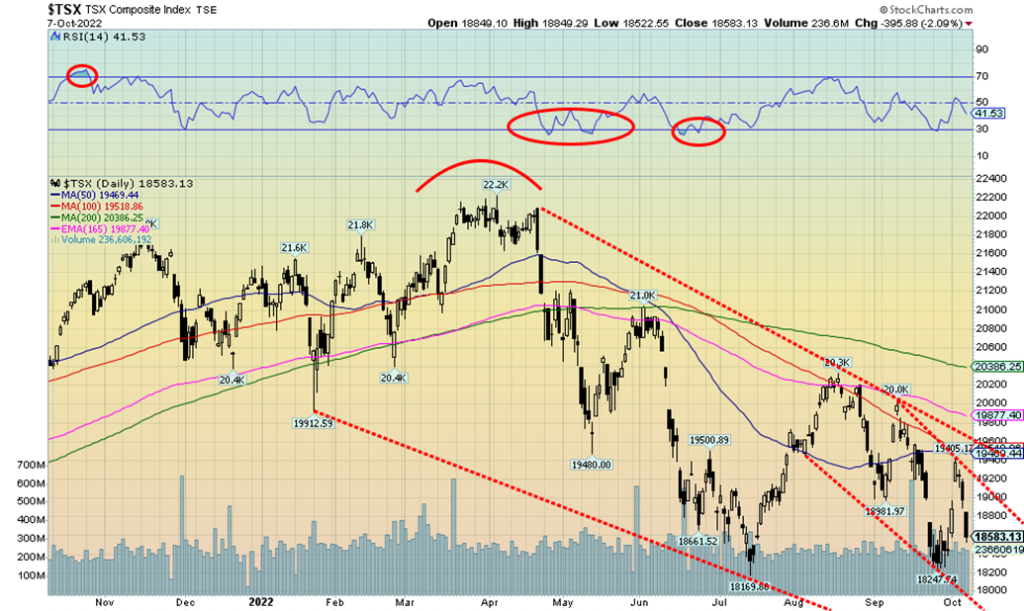
Despite Friday’s sharp drop in the stock markets where the TSX Composite fell almost 400 points or 2.1%, the TSX did close higher on the week by 0.8%. The TSX Venture Exchange (CDNX) gained 2.3% despite falling 2.2% on Friday. Markets gapped down on Friday. Either we are in the process of testing the recent lows or we are poised to make new lows. The early part of the week saw a sharp rally but it ended abruptly. Volatility reigns. Of the 14 sub-indices, seven were up and seven were down. Leading the way was Energy (TEN) with a big 15.1% gain on the week. It was a long drop to the next best, Metals & Mining (TGM), up 2.3%. The biggest loser was Utilities (TUT), down 3.9% and new 52-week lows. Telecommunications (TTS) also made new lows, down 0.9% and Income Trusts (TCM) also made new lows, down 2.6%. All three are interest rate sensitive and, with bond yields rising, their prices fell but their dividend yields would go up. From our perspective, we could see new lows this coming week as we believe we’ve passed the point that would suggest new lows. But we could also be forming a bottom pattern. There are numerous positive divergences between the price action and the indicators that continue to make higher lows even as the TSX makes lower lows. First, we need to regain above 19,200 and especially above 19,600 to suggest to us that we may have made a bottom. Otherwise, the bottom of our channel is currently down around 18,000.
10-year Treasury Bond/Canadian 10-year Government Bond (CGB)
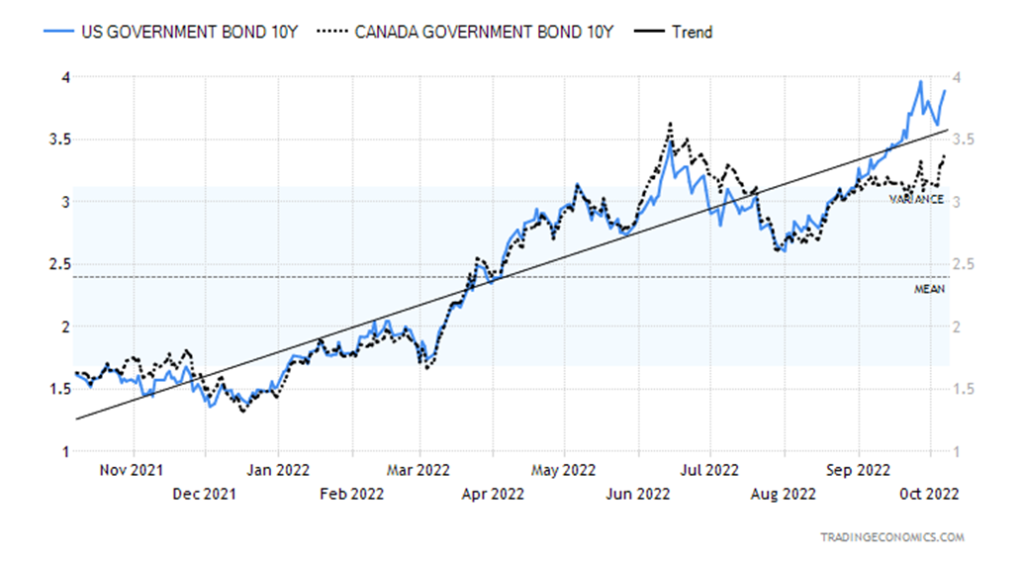
The pain in the bond market continues. This week, the U.S. 10-year treasury note saw its yield rise to 3.89%, just shy of the high of 3.96% seen on September 27. This was thanks to the strong job numbers, OPEC cutting 2 million bpd in production, sparking another rise in oil prices, and heightening inflation fears. The 10-year U.S. treasury note is up in yield in 2022 by 156%. In terms of price, UST the 10-year is down 14%, USB the 30-year is down 22.5%, and USTU the 2-year is down 5.9%. Fed Funds has gone from 0–0.25% to 3.25%. Mortgages have soared over 6%. The story is the same in Canada with the 10-year Government of Canada bond (CGB) up 137% in yield terms this week, jumping to 3.39% from 3.17%. The 2–10 recession watch spread is now at negative 42 bp in the U.S. and negative 66 bp in Canada. The spread continues to predict that a recession is coming, if it is not already here. However, the job numbers belie that thought. As well, many other economic numbers are not indicating recession as industrial production remains positive although slowing. However, manufacturing indices are turning negative and the recent reading on the Chicago PMI saw it fall under 50, indicating recession conditions. Others like the NY Empire Index, the Dallas Fed Manufacturing Index, and the Philly Fed have all turned negative. The ISM Manufacturing Index sits at 50.9, just above falling below 50 and indicating a recession. But employment, while slowing, remains positive. Could layoffs be coming?
More fun is coming this week. On Tuesday we get the PPI with expectations that the September PPI is up 0.2%. Wednesday comes the CPI and the expectation is that the September CPI is also up 0.2% and year-over-year will come in at 8.1%. That would be an improvement from the August year-over-year of 8.3%. Despite the bond yields pushing higher, they continue to remain below the rate of inflation.
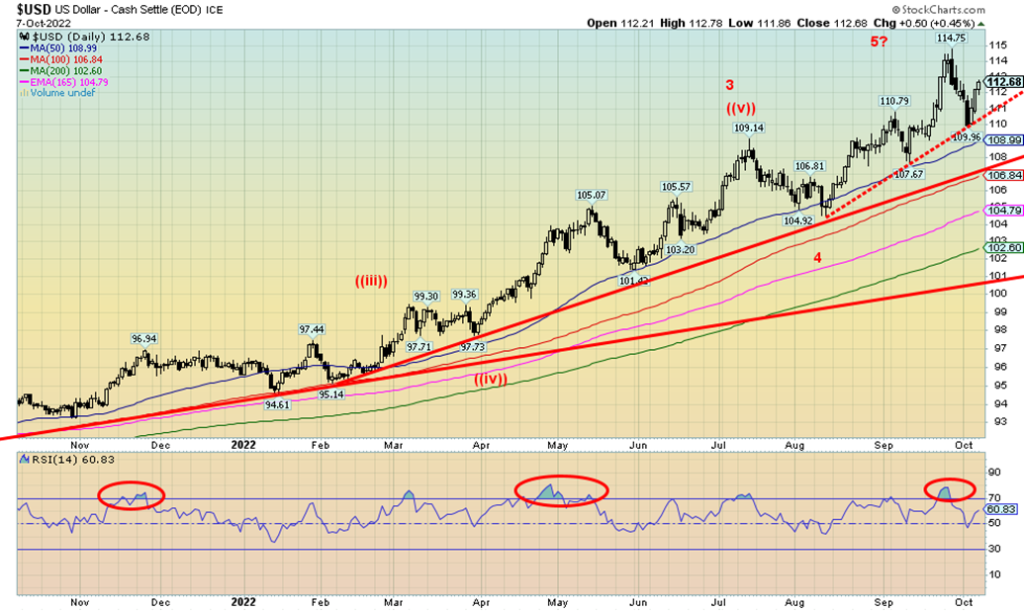
Is the US$ Index headed back for the highs? The US$ Index gained 0.5% this past week, most of it as a result of the job numbers that came out on Friday. The rise for the US$ Index was also helped by rising bond yields and threats of nuclear weapons to be used in the Russia/Ukraine war along with missile launches by North Korea. Rising inflation fears once again dominated as well, given the 2 million bpd cut by OPEC and oil prices soaring over 16% on the week. Other currencies fell with the euro off 0.7%, the Swiss franc down 0.9%, the pound sterling dropping 0.6%, and the Japanese yen down 0.4%. Bucking the trend was the Cdn$, up 0.6% thanks to rising oil prices.
So far, at least, the US$ Index has held our uptrend line at 110 (low of the week was 109.96). As long as that line holds, the trend remains up. But even if it broke there is a slower uptrend below, currently near 107. Under that level, things might break further and a fall towards major support currently near 101 could be underway. In some respects, we did achieve targets with the recent high at 114.75. Our target was at least 115, so it is possible we just fell short. If we do break out above 115 the next target level would be 118. As long as the US$ Index keeps rising, the odds of gold rising much are low. However, as we note, gold is rising in other currencies. Just not in U.S. dollars.
It is also possible we make a double top or a slightly higher high and actually hit 115 or marginally above. That remains to be seen. But the low this week at 110 emphasizes the support zone and it is now the break point.
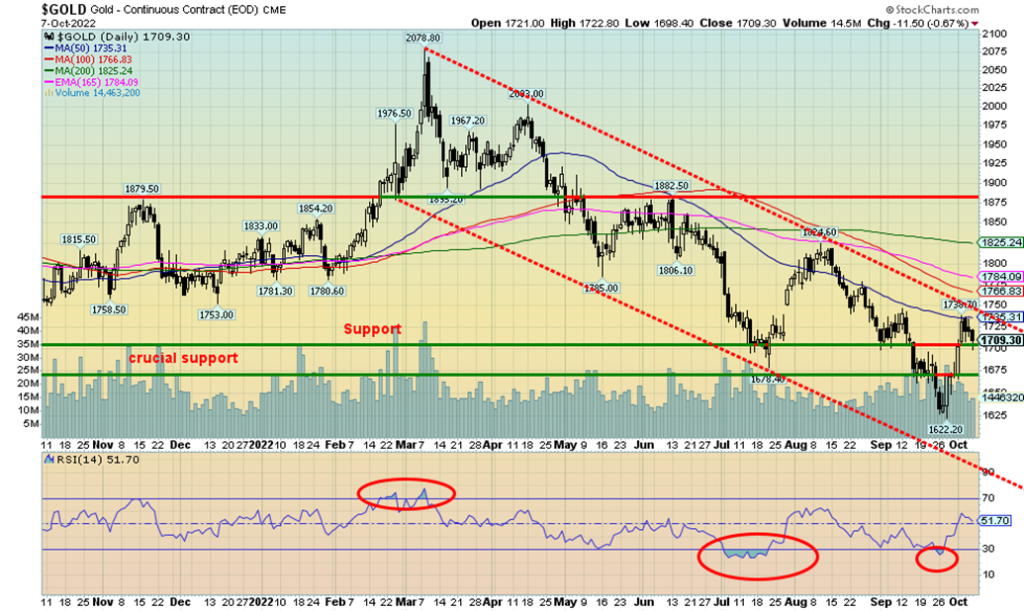
Gold (and silver and especially gold stocks) have a tendency to decline along with the stock market if there is a crash. We saw that, especially during the 2020 pandemic crash. It’s largely because in a crash everything gets tossed. But gold can separate itself as well and sometimes even separate itself from the US$ Index. Normally gold falls if the US$ Index goes up and vice versa. But this past week the US$ Index went up 0.5% while gold gained 2.2%. Silver did even better, up 6.4%. Platinum gained as well, up 6.8%. Even palladium rose up 0.4% but copper faltered (fear of recession?), off 0.6%. The gold stocks all gained as well, despite the pullback on Friday following the job numbers. Everything was hit on Friday including gold which fell 0.7%.
This week we managed to clear one of our hurdles at $1,700, but before we get too celebratory, a reminder we have a lot more work to do. More important than $1,700 is breaking above $1,750, then above $1,825. That August high was at $1,824.60. While it was good that we held $1,700 this past week, we need to continue to hold that level. Below $1,650 new lows are probable. Interim support is at $1,690 and $1,670. What’s key is that gold detaches itself from the market and goes up even as the market goes down. Gold going up and the US$ Index going up is also a positive sign.
Nonetheless, we are positive on gold going forward here. Normally gold correlates negatively with stocks and bonds, but it not always the case. Note that gold started its rally from a bear market in 2008 before the stock market made its final low, and it started to rally sooner out of the 2020 pandemic crash than did the
market. Possibly gold is suggesting there could be a stock market rally as well, but that remains to be seen. The stock market did rise this past week along with gold. The bottom line is, a move above $1,750 is needed to confirm the next move up, but a breakdown under $1,670 would signal trouble ahead.
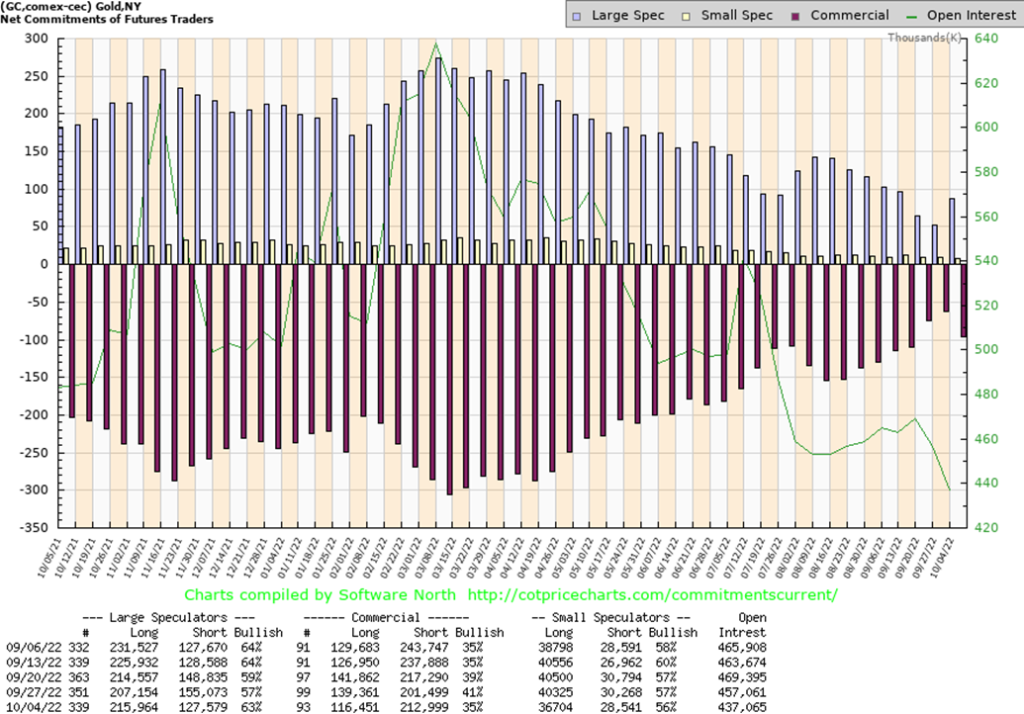
The gold commercial COT (bullion companies and banks) took a hit this past week with gold prices rising. The commercial COT slipped to 35% from 41% as long open interest fell a sharp 23,000 contracts while short open interest rose just over 11,000 contracts. The large speculators COT (hedge funds, managed futures, etc.) rose to 63% from 57% as they added over 8,000 longs and shed over 27,000 shorts (short covering, it appears). Overall, open interest fell roughly 20,000 contracts, suggesting that the rally thus far was based on short covering and not new longs. It doesn’t change the bullish stance, at least not yet. But we’d prefer not to see this slide back in the 20s.
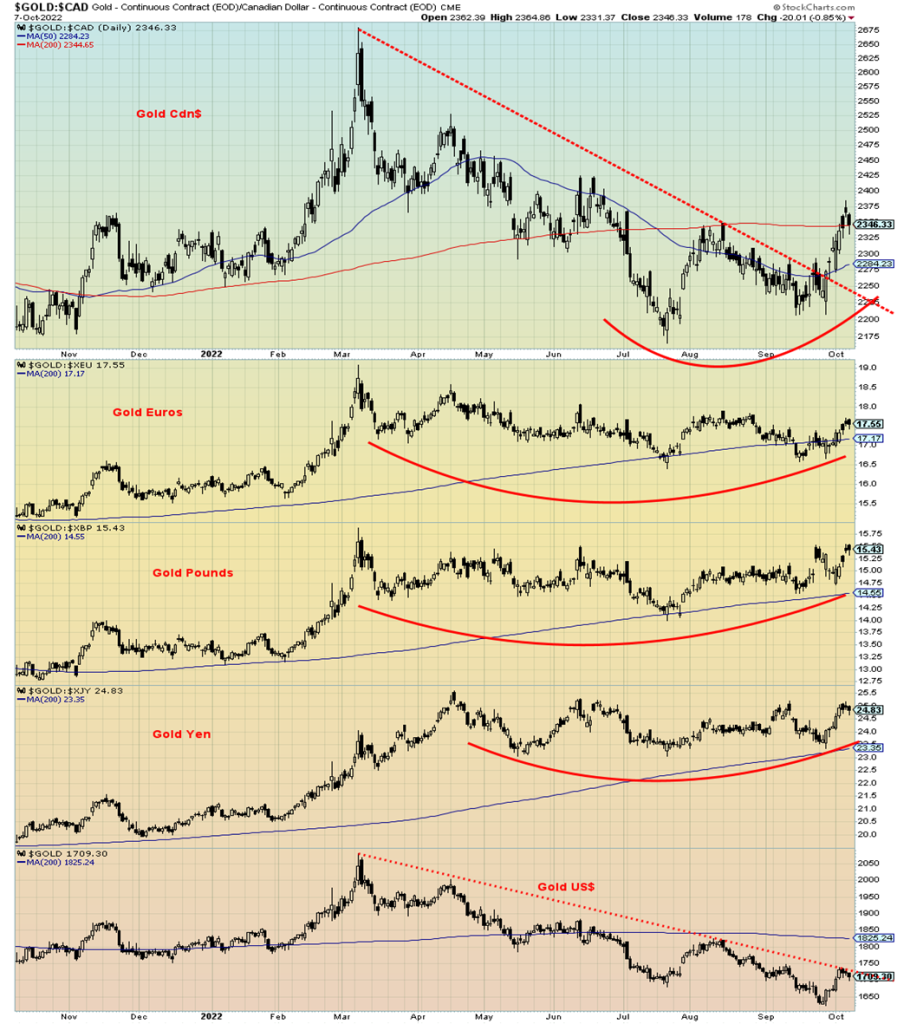
There is a certain irony that gold is almost universally thought of as being quoted in U.S. dollars. Most people do not realize that gold can be quoted in any currency. By focusing only on gold as quoted in U.S. dollars, one gets a different view than if they looked at it in other currencies. In other currencies, gold has been rising, not falling. And, in a number of cases, gold has hit record highs in a foreign currency or is close to a record high.
In 2022, gold expressed in euros, Swiss francs, Norway krone, Swedish krone, Russian rubles, Turkish lira, Indian rupee, Japanese yen, Thailand baht, Korean won, New Zealand $, U.K. pound sterling all hit record highs. Now that high came in March 2022, at the same time that gold in U.S. dollars was close to equaling the record high set August 2020. What’s key, however, is what has happened since then. Gold expressed in a host of currencies remains close to that record high. Our chart above shows that gold in euros, pounds, and yen is not far off that record high today. But even gold in Cdn$ has broken its downtrend and has crawled back over its 50-day MA. Gold in US$ remains over $100 away from its 50-day MA.
To confirm an uptrend for gold, gold has to be rising in all currencies including the U.S. dollar. But the strength of the U.S. dollar has left gold floundering, with many writing it off and some even predicting an ultimate collapse. Gold, after all, is just a barbarous relic, good for nothing except for making baubles for people’s necks, wrists, and ears. Yes, there may be some 201,000 metric tonnes in above ground gold and yes, it is estimated that some 93,000 metric tonnes of it are sitting in jewelry. But central banks (known as official holdings) continue to hold some 34,000 metric tonnes (U.S. has 8,133 tonnes) while investments hold another 44,000 + metric tonnes. The remaining 29,000+ metric tonnes are in industrial use, mostly electronics; i.e., cell phones, computers, calculators, green energy products, and more.
If gold is so unimportant, why do central banks continue to hold gold? Okay, one, the Bank of Canada (BofC) sold all of its gold way back in 2016. They even dumped their horde of Canadian George V gold coins from 1912–1914 by melting most of it and selling the remainder. The BofC thought that holding U.S. dollars was more important than holding gold. Since 2016, gold in either U.S. dollars or Cdn$ is up roughly 50% while 10-year U.S. treasury notes have fallen 10% before the coupon.
We’re not going to second-guess the BofC; however, numerous central banks, including the Peoples Bank of China (PBOC), the Central Bank of Russia (CBR), and the Central Bank of the Republic of Turkey (TCMB) have added substantially to their gold holdings. China and Russia in particular want to back their currencies with gold. Notably, the Federal Reserve (FED) continues to hold its gold holdings, the largest holding of CB gold reserves in the world. The U.S. used to hold a lot more gold; following Bretton Woods in 1944, the U.S.$ became the world’s reserve currency exchangeable in gold at the rate of $35/ounce. By 1950, the U.S. had by far the world’s largest gold holdings of over 20,000 tonnes. By the time the U.S. took the world off the gold standard in August 1971 its holdings had dwindled to 8,133 tonnes. They were concerned that given the demand to convert U.S.$ to gold from foreign holders of U.S.$ that they would soon have no gold. Confidence in the U.S.$ collapsed during the 1970s and gold soared from $35 to $870. Money and credit also exploded following the end of the gold standard.
Confidence in the U.S.$ is key. If confidence in the U.S.$ collapses along with confidence in the U.S. government, then gold will soar. Whether the gold bugs like it or not, the world rushes to the US$, not to gold.
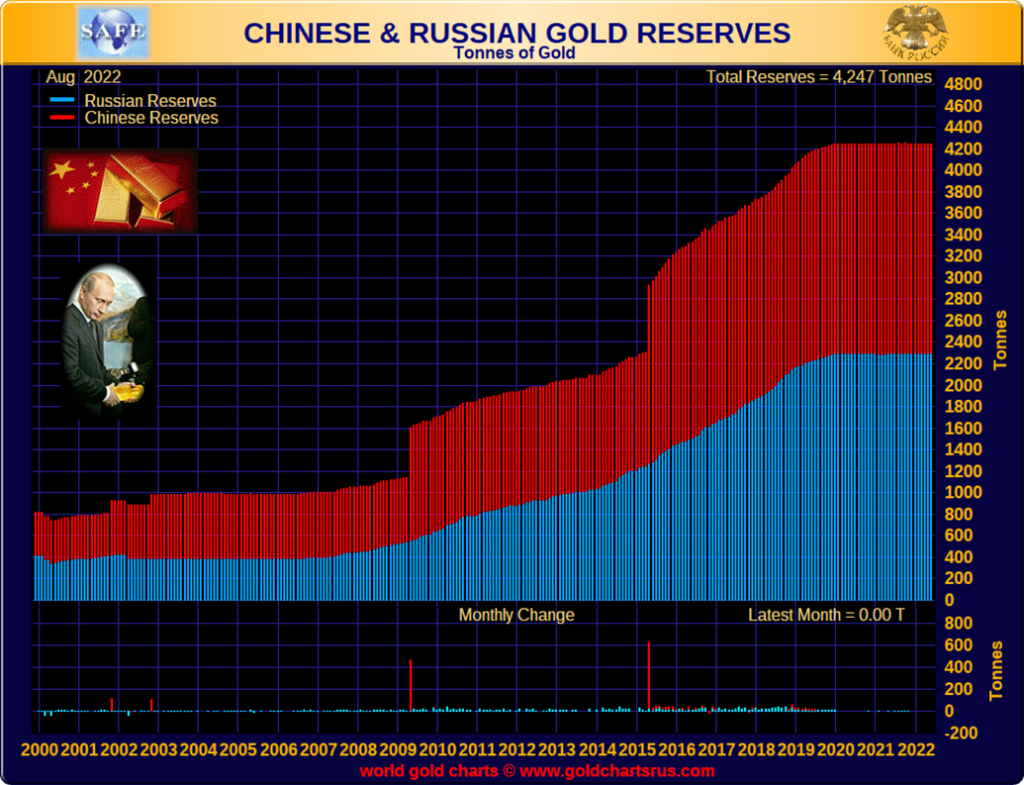
Despite quadrupling their holdings of gold since 2007, the combined holdings of China and Russia are still just more than half of what the U.S. holds. But both China and Russia undoubtedly have even more reserves somewhere, as China and Russia are number one and three of the world’s largest producers of gold (Australia is number two). Russia and China hold the second and eighth-largest gold mine reserves in the world as well (Australia is the largest, while the U.S. ranks 4th and Canada 7th). Both China and Russia have stated it is their aim to back their currencies (yuan, ruble) with gold. Is it an attempt to reestablish a gold standard? There is not a lot of support for a gold standard from central banks and governments as a gold standard is constraining on their ability to conduct monetary policy. Banks don’t like it either as it would constrain their ability to make loans. Expansion of the money supply mainly takes place through the private banking system through deposits and loans.
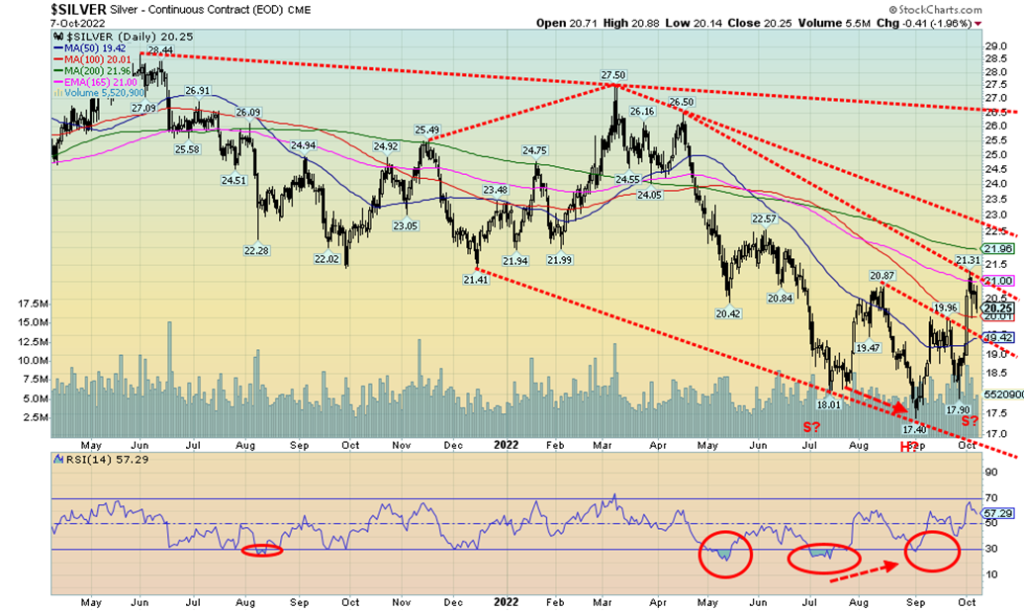
Silver prices had a good week to the upside, gaining over $1 or 6.4%. Despite the setback on Friday following the job numbers, silver managed to close above $20 and is currently holding above the 50-day MA and the 100-day MA. Silver may have put in an awkward-looking head and shoulders bottom with potential targets up to $22.85/$23. That would get us above resistance at $21, $22, and $22.50, setting us on course for the next major resistance at around $26.50. Above $26.50 and especially above $27 we would challenge the March 2022 high of $27.50 and eventually the February 2021 high at $30.35. Silver’s all-time high was hit in 2011 at $49.82. The Hunt Brothers’ silver squeeze of the late 1970s saw silver hit a high of $49. A breakdown now back under $19.40 would be negative and under $18.30 new lows are probable. We continue to view this as the early stages of a rally, but remain wary until we can clear above $22.50 at least to suggest to us that higher prices are likely.
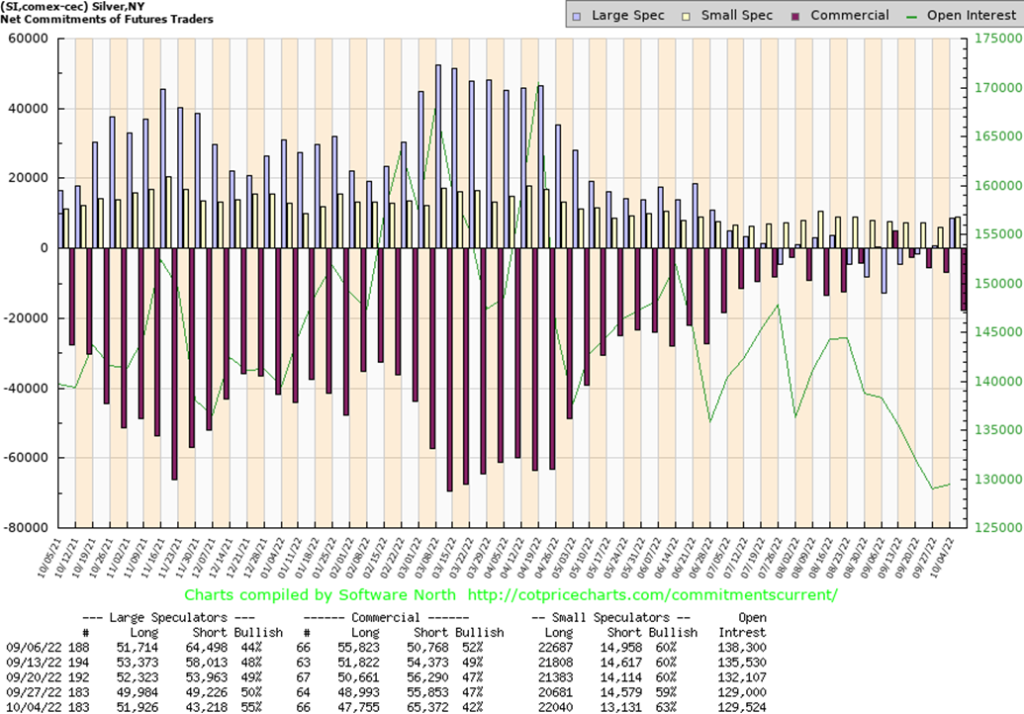
As with the gold commercial COT, it is probably no surprise that the silver commercial COT also pulled back this week. The silver commercial COT slipped to 42% from 47%. Long open interest was only down roughly 1,000 contracts, but short open interest jumped almost 10,000 contracts. Overall, open interest was largely unchanged. The large speculators COT jumped to 55% from 50% as the speculators added about 2,000 longs and cut their shorts by roughly 6,000 contracts. Still bullish though. The expectation is that this will shrink as silver prices go higher.
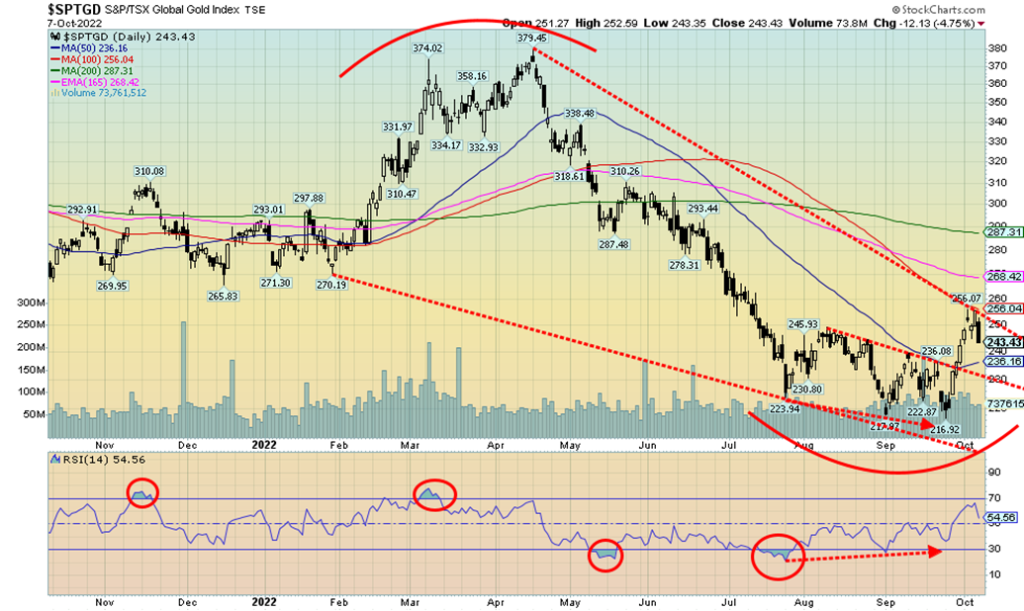
Despite the setback on Friday following the job numbers, the gold stock indices did manage to close higher on the week. The TSX Gold Index (TGD) was up 0.5% while the Gold Bugs Index (HUI) gained 1.8%. We continue to support higher prices going forward. Gold stocks remain cheap vs. gold and cheap vs. the broader stock market. The TGD did break out of a small bottom pattern and has closed over the 50-day MA for the first time since April. That could be key as once it clears the 50-day MA (or breaks under) it tends to continue the trend that is underway. Still, we are not complacent as we are not out of the woods just yet. A break back under 235 would be negative but a break back under 220 would most likely toll the death knell of the rally. Below that new lows are probable. The Gold Miners Bullish Percent Index (BPGDM) has jumped to 24.1% up from its low of 3.5%. The recent low was just above the absolute zero low seen back in 2015 at a major gold low. It was also below the 7.7% seen at the bottom of the March 2020 pandemic panic. All this has us viewing that gold stocks should be bought on the pullback in preparation for a bigger move. A major breakout would occur over 290 and above 340 new highs are probable. There is a bit of wedge pattern that appeared to form and, if that’s correct, it could signal a return towards the April high at 379.
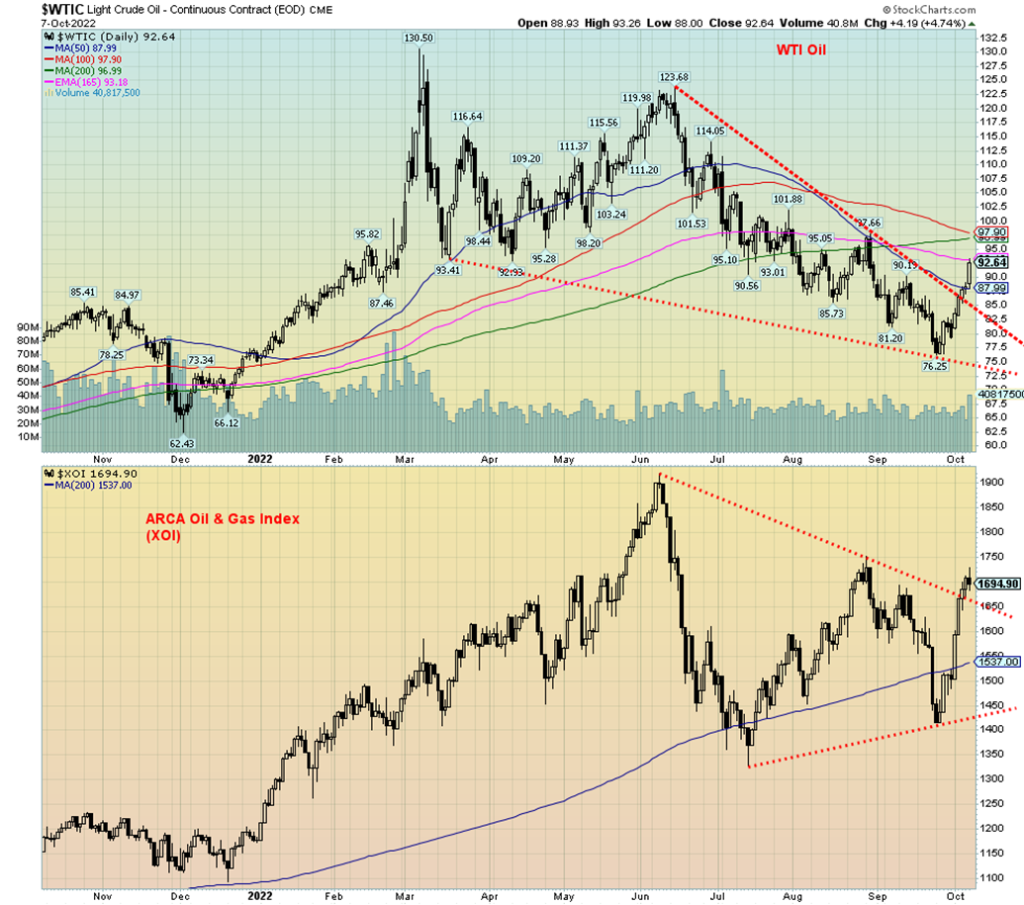
Some believe that OPEC + Russia has it in for the U.S. economy. Maybe they do, maybe they don’t. But what they do like is high oil prices to help increase their revenues. Oil prices soared this past week following OPEC’s announcement of a two million bpd cut in production. It is actually more like a one million cut, given that many producers were already producing below targets. However, the effect was immediate. WTI oil soared $13.15 on the week or 16.5%. Brent leaped $13.10 or 15.4%. By week’s end, gasoline at the pump at the Esso station down the street was pushing $1.70/liter, up from $1.50/liter. It will probably go higher still this coming week.
As if that wasn’t enough, the U.S.’s strategic oil and gasoline reserves are below their 5-year MA. The U.S. has been releasing at least a million bpd from its Strategic Petroleum Reserves. The U.S., to say the least, was livid at OPEC. As for OPEC, it appears that their main concern is not inflation or fears of a global economic slowdown but mainly to take into account oil market fundamentals and geopolitical uncertainty. Still, it leaves the Biden administration caught between a rock and hard place as screams of “drill, drill, drill” resonate or get it from Canada (Canada already exports 96% of its oil to the U.S.). Unsurprisingly, the U.S. has already started drilling auctions for New Mexico, Wyoming, and the Gulf of Mexico. Nonetheless, OPEC, led by Saudi Arabia and as an interested observer in Russia, is more interested in high revenues than whether the Western nations fall into a recession.
70 Year Oil Prices 1947–2022
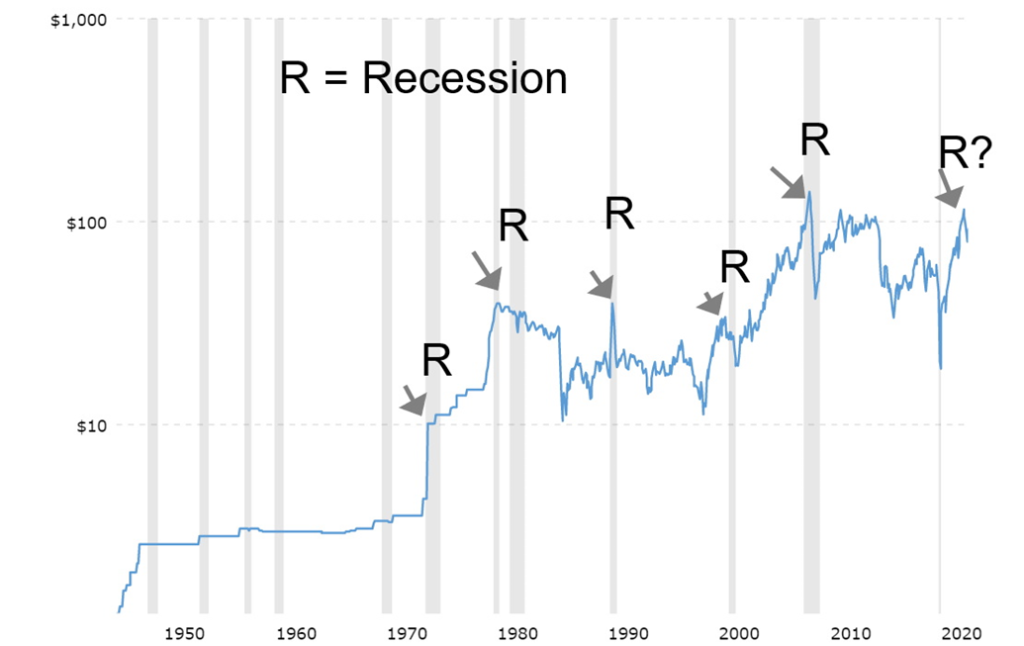
Note how every spike/peak in oil prices in oil prices has been followed by a recession over the past 50 years. It started with the Arab Oil Embargo of 1973, resulting in the steep recession of 1974–1975. The Iranian revolution contributed to the spike in 1979 and the recessions in 1980 through to 1982. The Iraq War 1 was behind the spike in 1990 and the 1990 recession. Increasing demand, particularly from China and the rest of Asia, contributed to spikes in 2000 and 2008 and both were followed by the recessions of 2000–2002 (high-tech/dot.com collapse) and the 2007–2009 recession (financial crisis, sub-prime mortgage blow-up). So, what will this one spark?
Oil prices have already broken out of their downtrend but have considerable resistance to overhaul. There is further resistance up to $97 to $100. But over $100 WTI could rise back towards the $124 high seen in June. WTI oil appears to have broken out of a descending wedge triangle (bullish) and targets could easily be $124. Above $130 WTI could soar to $150. That can’t be lightly dismissed if the war in Ukraine deteriorates further or a spark is lit in the Middle East directed at the Saudi fields. The ARCA Oil & Gas Index (XOI) has also broken out of a symmetrical triangle and could target up to 2,200. The TSX Energy Index (TEN) has also broken out of a symmetrical triangle and could be targeting up 325/330.
The trend is broken if WTI oil were to fall back under $85. Overall, we appear to be headed for another wave up for oil prices and all of what that means for inflation, prices at the pumps, and the energy stocks. Natural gas (NG) has been steady of late, sitting below its highs, even at the EU Dutch Hub where prices fell 17% this past week to €156. Still, NG remains up 122% in 2022 in the EU and up 81% in North America. Seasonally, oil’s strong period is December to June while for NG it is February to June.
Copyright David Chapman, 2022
__
(Featured image by Austin Distel via Unsplash)
This article may include forward-looking statements. These forward-looking statements generally are identified by the words “believe,” “project,” “estimate,” “become,” “plan,” “will,” and similar expressions. These forward-looking statements involve known and unknown risks as well as uncertainties, including those discussed in the following cautionary statements and elsewhere in this article and on this site. Although the Company may believe that its expectations are based on reasonable assumptions, the actual results that the Company may achieve may differ materially from any forward-looking statements, which reflect the opinions of the management of the Company only as of the date hereof. Additionally, please make sure to read these important disclosures.
David Chapman is not a registered advisory service and is not an exempt market dealer (EMD) nor a licensed financial advisor. He does not and cannot give individualised market advice. David Chapman has worked in the financial industry for over 40 years including large financial corporations, banks, and investment dealers. The information in this newsletter is intended only for informational and educational purposes. It should not be construed as an offer, a solicitation of an offer or sale of any security. Every effort is made to provide accurate and complete information. However, we cannot guarantee that there will be no errors. We make no claims, promises or guarantees about the accuracy, completeness, or adequacy of the contents of this commentary and expressly disclaim liability for errors and omissions in the contents of this commentary. David Chapman will always use his best efforts to ensure the accuracy and timeliness of all information. The reader assumes all risk when trading in securities and David Chapman advises consulting a licensed professional financial advisor or portfolio manager such as Enriched Investing Incorporated before proceeding with any trade or idea presented in this newsletter. David Chapman may own shares in companies mentioned in this newsletter. Before making an investment, prospective investors should review each security’s offering documents which summarize the objectives, fees, expenses and associated risks. David Chapman shares his ideas and opinions for informational and educational purposes only and expects the reader to perform due diligence before considering a position in any security. That includes consulting with your own licensed professional financial advisor such as Enriched Investing Incorporated. Performance is not guaranteed, values change frequently, and past performance may not be repeated.


Ecobnb Turns Sustainable Tourism Into Measurable Impact
Ecobnb’s sustainable tourism platform generated significant environmental and social impact in 2025, avoiding 58,207 kg of CO₂ and adding 583...


Sugar Markets Balance Biofuel Demand and Global Supply
Sugar markets in New York and London were mostly unchanged as the Iran conflict renewed interest in biofuels. Drought concerns...


The $40 Trillion Trap: Disinflation Is Not Deliverance
U.S. debt has reached $40 trillion, with $24 billion weekly interest, while deficits accelerate. Despite disinflation in CPI, from cooling...


FinTech Matures as AI and Infrastructure Drive the Next Growth Phase
Fintech markets are entering a mature phase, shifting from rapid growth to consolidation, specialization, and sustainable business models. Zurich and...


Bitcoin, and Ethereum Rise, While Cardano Enters Transition
Bitcoin and Ethereum posted modest weekend gains, supported by ETF inflows. A new proposal may protect Bitcoin from quantum threats....
 |
|
 |  |
 |
|
-

 Crowdfunding6 days ago
Insight Foto Festival Launches €4,500 Crowdfunding Campaign to Support 2026 Edition
-

 Africa2 weeks ago
UCITS Funds Drive Casablanca Market Activity in Q1 2026
-

 Business1 day ago
Dow Jones’ Record Run Faces Early Signs of Potential Shift
-

 Business1 week ago
Jobs Cooling Fast as a Cautious Fed Leaves Markets Without a Safety Net