Featured
The Hurricane in the Stock Markets Is Real, Only it Is Slow Moving
Three quarters through the year and the bear market continues. Third consecutive negative quarter. The bond market is suffering its worst bear market in years yet surprisingly no bond market blow up – yet. We get asked questions as to whether we are headed for a depression so we look at some comparisons and differences with the 1930’s and how the 90-year cycle of depressions appears to be in play.

In our September 5, 2022 commentary we outlined how the world appears to go through a period of economic depressions roughly every 90 years (range 85–95 years). These depressions are measured from stock market low to stock market low. Our September 5, 2022 commentary outlined a series of economic depressions and important stock market lows that started in the latter part of the 16th century (1555–1600). The next was seen in the latter part of the 17th century with a stock market low in 1672; this year was known to the Dutch as the “Disaster Year.” The next extended depressionary period was seen in the latter part of the 18th century with important stock market lows in 1761 and 1783. The panic of 1837 triggered another period of depression and stock market collapses, with important lows seen in 1843 and 1957. Ninety years hence took us to the Great Depression and the key 1932 low. Taken in order, starting with centering the 1555–1600 series of lows in 1578, the next important low in 1672 was 94 years later. From the 1672 stock market low the next one was 1761 (89 years), then 1843 (82 years) or 1857 (96 years), and finally 1932 (89 years) or from 1857, 1949 (92 years). It is the rarity of these events that makes this cycle uncertain.
Irrespective of this, here we are again in 2022, 90 years from 1932; however, the effects linger over the better part of a decade and are often accompanied by global conflict, as was seen at the time of the 1672 low (Anglo/Dutch/French wars), the 1761–1783 low (Seven Years’ War, American and French Revolutions), less so the 1843 low (US/Mexico war, Britain/Ottoman Empire war, Britain/China Opium wars, Crimean War Britain/France/Ottoman Empire/Russian Empire, and eventually the U.S. Civil War) and again during the 1932 stock market low (Spanish Civil War, Japan/China, World War II). Today we have growing military tensions between the U.S./EU/Russia over Ukraine and U.S./China over Taiwan with the added threat of the possible use of nuclear weapons.
Will we have an economic depression or just a prolonged steep recession? It doesn’t look like a depression right now. It doesn’t even look like a recession, at least not officially. Unemployment is low, there are no soup lines, there are no people riding the rails, there has been no significant uptick in poverty and homelessness, there have been no banking panics, there have been no significant defaults, sovereign or corporate; industrial production remains positive, and prices are not falling (deflationary); instead, they are rising (inflationary). Yes, we have poverty. Roughly 12% of the U.S. population or 11% of the Canadian population is considered to be living in poverty. Roughly the same numbers use food stamps or food banks regularly. However, we do have tent cities in our parks not unlike the shack towns known as Hoovervilles during the Great Depression. Another major difference is the advancement of technology since the 1930’s. Major advances have been made in medicine, computers, GPS systems, the internet, digital cameras, smartphones, social media and more. Our advancements in technology was built on the technological advancements of the 1920’s such as radio, the automobile, the telephone and film.
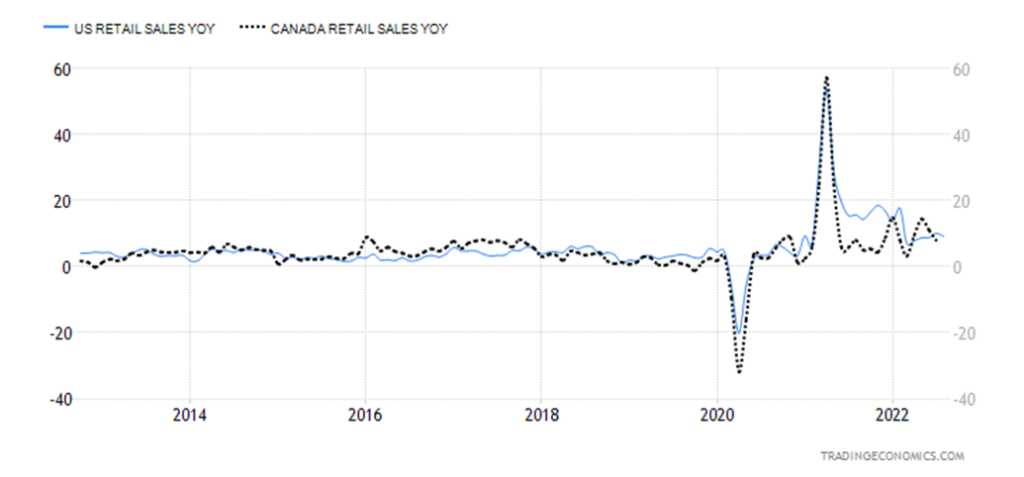
The Great Depression resulted from a multitude of causes, few of which appear to exist today. There was a stock market crash that started the Great Depression, whereas today, while the stock market is falling, there has yet to be a panic; consumer demand hasn’t collapsed, even as it has slowed; there have been no financial panics; and there is no gold standard that ties currencies to the price of gold, keeping currencies in a fixed exchange system of rates.
Retail Sales, Year-Over-Year: U.S. and Canada, 2012–2022
Bankruptcies have yet to rise significantly. The big difference between corporate and bank bankruptcies in the 1930s vs. today is that there is today an expectation that the central banks will come to the rescue; i.e. the bailout, quantitative easing (QE). In the 1930s, banks just went under. Yes, there were hundreds of banks that failed during the 2007–2009 financial crisis, but they were small. The large financial institutions, those that were too big to fail, were all bailed out. Even Canada’s large banks were handed rescue packages. But what would happen now if there was a global banking crisis? Bail-ins have replaced bail-outs and that means depositors and bondholders could be at risk.
There are support systems in place for the unemployed in the form of unemployment insurance, and when that runs out there is a welfare system. These didn’t exist during the 1930s. Today’s society is urban rather than rural as it was back in the 1930s. Regulation is as potentially distorting today as it was back in the 1930s. Taxes generally are higher today, but then there are more services provided. Unemployment insurance, social security, and eventually Medicare all came about as result of the Great Depression, although Medicare didn’t arrive until the 1960s in both Canada and the U.S.
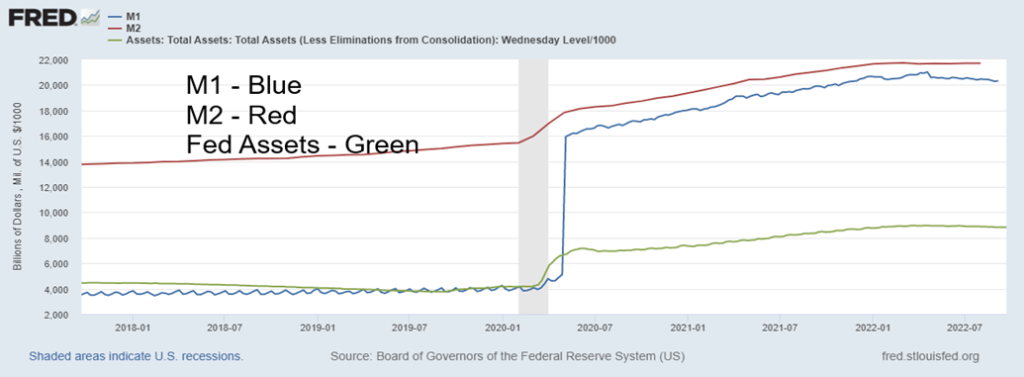
But there a few similarities that could signal further problems later. The Fed was less active back in the 1930s than it is today. The Fed did little to stem the stock market panic nor banking panics. They allowed money supply to fall and, in response to Britain leaving the gold standard, the Fed deliberately contracted money supply and allowed interest rates to rise in 1931, fearing that the U.S. would have to devalue the U.S. dollar. Today, because of rising inflation, the Fed is hiking interest rates and has embarked on quantitative tightening (QT). The result is money supply is falling and the Fed’s balance sheet is contracting. Since their respective peaks earlier in 2022, M1 has fallen 3.3% or $686 billion, M2 is down 5.8% or $1,276 billion, and the Fed’s balance sheet has contracted 1.7% or $149 billion. We expect the contraction to continue, despite calls to ease in some corners. The Bank of Canada (BofC) has reduced its balance sheet by roughly $144 billion or 25% since its peak back in March 2021. Money supply has been contracting in Canada as well.
M1, M2, Fed Assets 2017–2022
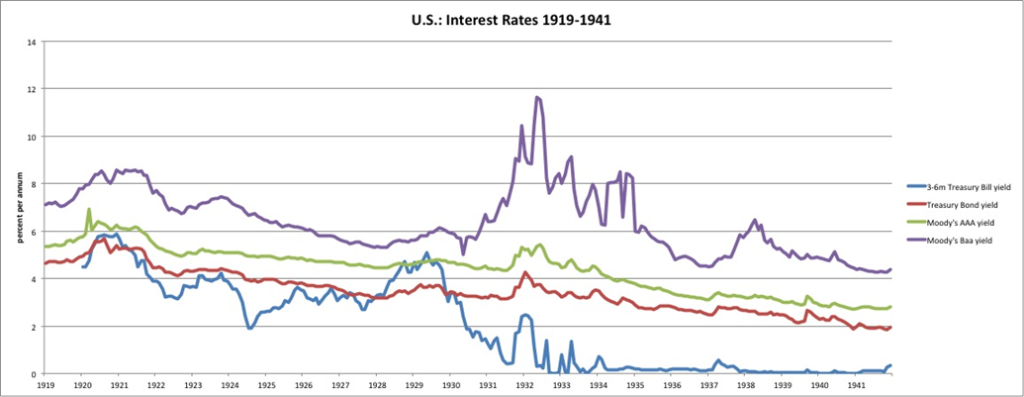
Below is a chart of interest rates during the 1920s and 1930s. Note the upward blip in interest rates that got underway in 1931 at the height of the Great Depression. The fear was that the U.S. would devalue the dollar, but that didn’t happen until 1933 when the U.S. raised the price of gold from $20.69 to $35 (+69%) and embarked on the confiscation of gold, thus resulting in the devaluation of the U.S. dollar. Gold mining stocks fared even better as Homestake Mining (HM), the largest gold mining company at the time, doubled even as the DJI was falling 89%. Eventually, HM was up almost seven-fold by 1936 from its 1929 low.
U.S. Interest Rates 1919–1941
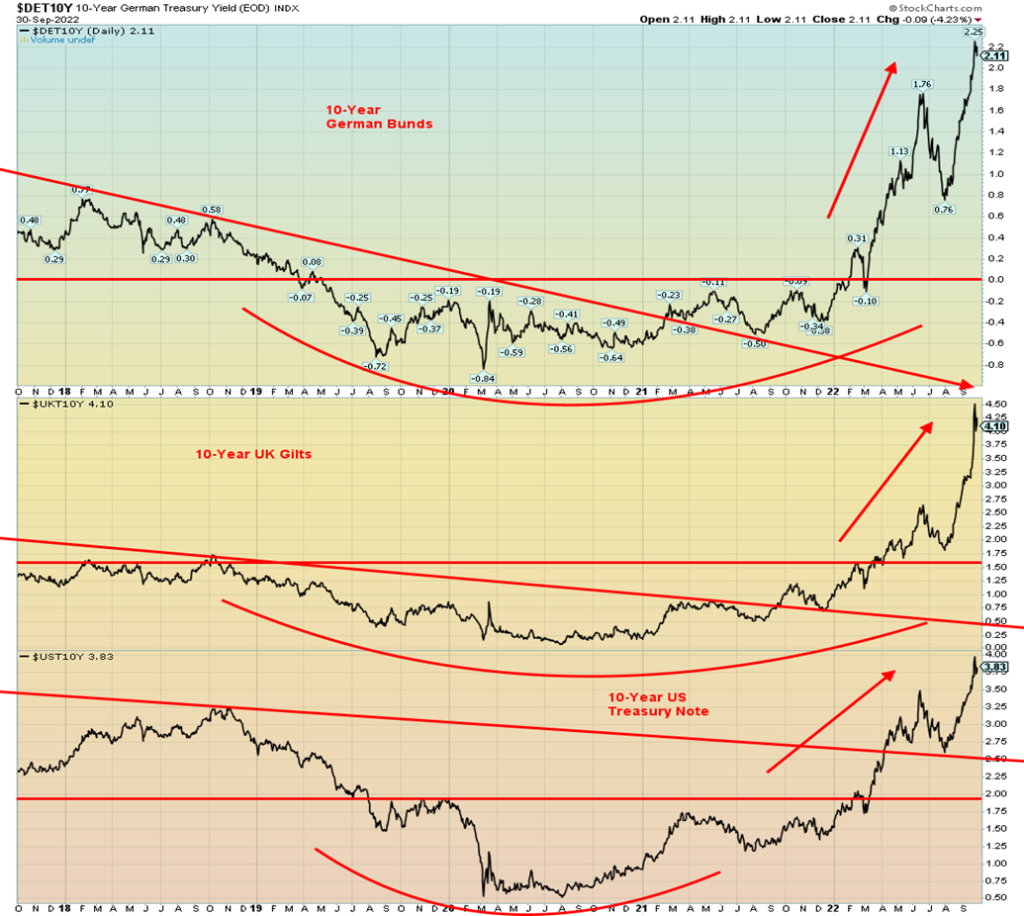
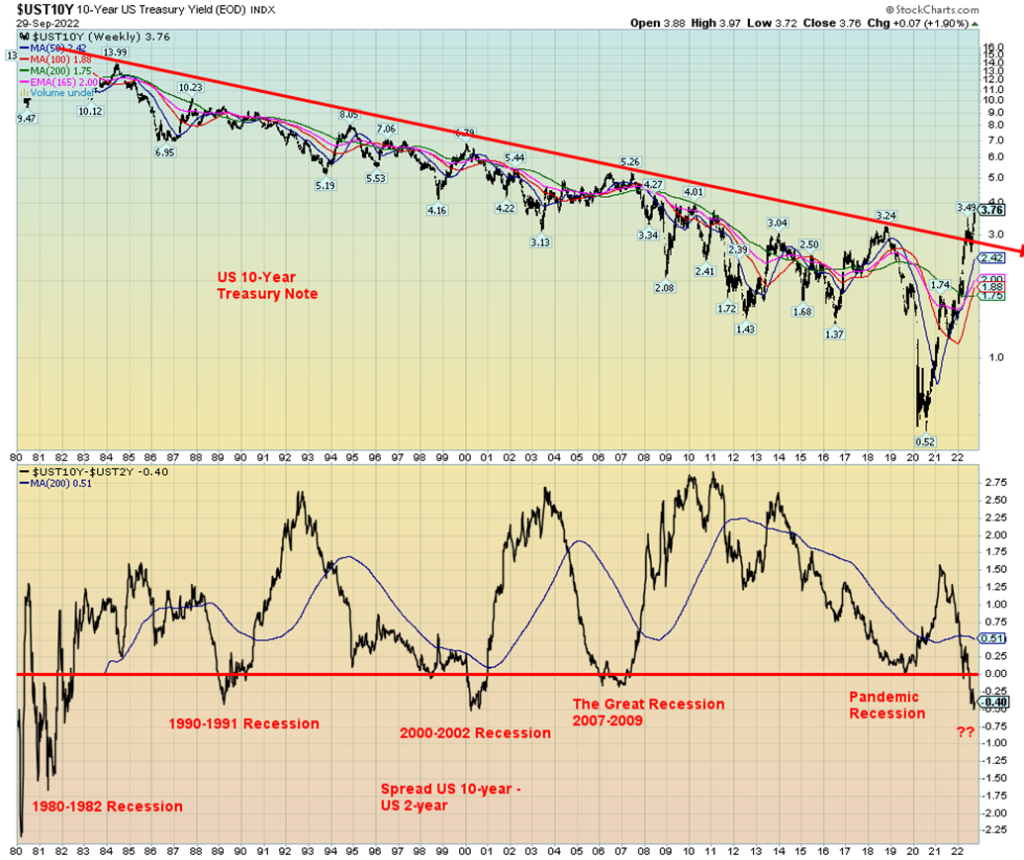
Interest rates have been on the rise everywhere as the central banks embark on fighting inflation. The latest inflation numbers show the U.S. up 8.3%, Canada 7%, eurozone 10%, U.K. 9.9%. The result is that everywhere the rise in interest rates is starting to cause other problems for loans, mortgages, and more. Homeowners with large mortgages could be facing a dilemma with rising mortgage payments and falling values for their homes as rising interest rates cut demand. The same could spark a drop in demand for consumer goods for cars, etc., due to high borrowing rates. All these in turn could lead to more unemployment as businesses close doors due to a lack of demand. Our chart on the next page of 10-year interest rates in Germany, the UK, and the U.S. shows the recent sharp rise in interest rates. In all cases, the rise in interest rates has broken the long-term downtrend for rates, suggesting that we are now embarking on an era of rising interest rates. This would be similar to what we saw back in the 1970s.
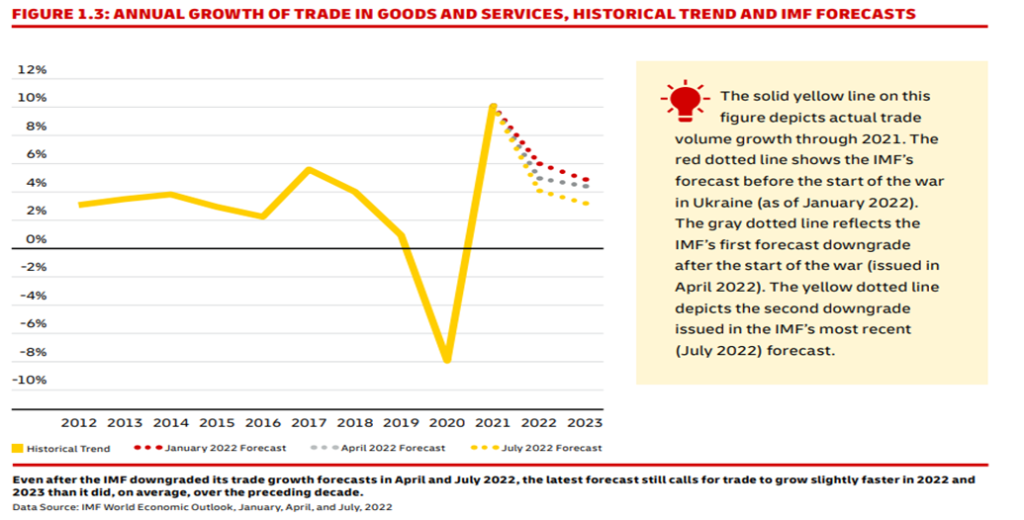
Currency wars are one thing the two periods have in common. During the Great Depression, most countries abandoned the gold standard and placed high tariff walls on goods. All of this was an attempt to export unemployment, and the period became known as “beggar thy neighbor.” The current period started with countries devaluing their currency to boost their exports. Today, there is no gold standard and we live in a period of fiat currencies (promissory notes issued by governments). The 1930s ended a period of globalization and it is no surprise today that globalization, i.e. world trade, is now shrinking, not growing. Trade wars, not dissimilar to what was seen in the 1930s, were triggered by the Trump administration with the placement of tariffs on goods from a number of countries, especially China. Sanctions on a number of countries, again led by the U.S., are not dissimilar to trade wars. They spark dislocations and work to contract trade not expand it.
Currency devaluations are causing problems. With the sharp rise in the value of the US$ Index, it is no surprise that currencies everywhere have devalued. Interest rate hikes are pushing up the value of the US$ Index. The result is capital flows out of low-interest rate countries to the high-interest rate country. Capital is also flowing out of the EU as a result of the war in Ukraine and because of military tensions between the U.S. and China. The key Fed rate, currently 3.25%, is expected to rise to 4.50%–4.75%, implying that it is possible we’ll see more 75 bp hikes in November and December.
It’s one thing when the Zimbabwean dollar (ZWD) falls sharply, but when the Japanese yen (¥) and the pound sterling (£) fall 20% as they did in 2022 this brings intervention from the central bank, the BOE, and the BOJ. For the BOJ, it’s the first major intervention since 1998. For the BOE, it is bringing back memories of 1992 when the pound sterling was busted. Japan, with low inflation and interest rates, has seen its currency relentlessly pushed lower in 2022. The U.K. sparked turmoil in its gilt (bonds) markets following the release of an economic plan from the incoming Truss government. Even the IMF has weighed in on the U.K.’s economic plan of tax cuts. Turmoil has been ruling both markets, sparking selling and volatility in increasingly illiquid markets. Intervention usually takes the form of selling U.S. treasuries to purchase yen and pounds respectively. China has also been forced to do the same (see Chart of the Week) as the yuan has fallen sharply this year as well. The problems in the U.K. have spread to its pension funds, which have been forced to sell gilts to raise cash to make their pension payments.
Market chaos as a result of currency turmoil is the last thing the global markets need as that could be the proverbial “straw that breaks the camel’s back.” Most people think of stock market chaos and crashes, but few focus on bond and currency chaos. Yet chaos in bond and currency markets is often behind economic turmoil and stock market crashes. The global debt market is estimated at over $300 trillion, more than double where it was during the 2008 financial crash. A collapse in the bond market can quickly spread to the stock market.
10-Year Bond Interest Rates – German Bunds, UK Gilts, US Treasuries 2017–2022
The final comparison with the 1930s is the relentless rise of far-right populist/xenophobic politics, much like we witnessed with the rise of fascism in the 1930s. The most extreme example from the 1930s was the rise of the Nazi party in Germany. The current movement really got underway in the early 2000s (some claim even earlier dating back to the 1960’s), intensified after the financial crash of 2007–2009, and was exacerbated by the pandemic of 2020–2021. Today, political polarization is the norm in a number of countries, some worse than others. The end result could witness even the breakup of countries as separatist/secession movements grow. Dysfunctional, polarized politics is threatening both the EU and the U.S. Dysfunctional politics is also behind currency wars, actual wars, and a lack of action on issues like climate change as global organizations such as the U.N. teeter into irrelevancy and dysfunction.
History does not necessarily repeat itself. But it has an uncanny way of rhyming.
Chart of the Week
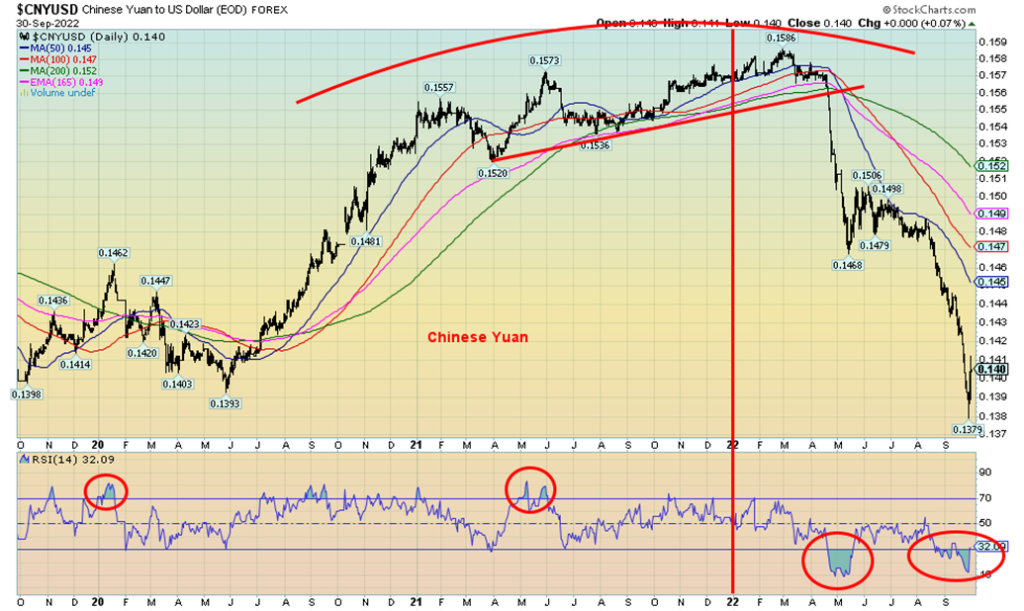
The Chinese yuan could be the poster child for numerous other currencies in 2022. Since peaking on February 28, 2022, the Chinese yuan against USDX has plummeted over 12%. That’s roughly in line with declines seen for the euro, but somewhat better than the pound sterling or the Japanese yen. So, what’s the problem with the Chinese yuan?
Set aside the recent rumors of the overthrow of Xi Jinping who, because he disappeared from sight for a while, set in motion rumors of his demise. If that had been correct, it might have been a military coup, but the basis for it all seemed too contrived. However, there has been little doubt about the fall of the yuan in 2022. The prime reasons have had more to do with China’s slowly sinking trade balance that saw its monthly trade surplus slide to US$79.4 billion in August (expected was US$92.7 billion), down from US$101.3 billion in July. The trade balance has been falling primarily because of disruptions in exports caused by disruptions in factories as a result of COVID lockdowns and historic heatwaves. The COVID lockdowns have been some of the most stringent in the world, where entire cities were locked down. Whether things improve as a result of the lifting of these lockdowns is difficult to say. Despite the decline, the Chinese trade surplus remains on balance, considerably higher than the average seen in 2000–2020.
China is difficult to read at the best of times. Our read on China is based on charts that are available to us and numerous publications and media like The Economist, Bloomberg, and Reuters. While, recently, the yuan has fallen substantially, it’s most likely overdue for a bounce/rebound, given the overextended nature of the RSI indicator. A bounce developed back in May 2022 after a sharp decline. At the time, the RSI hit a low of 8.87. Today it hit a low of 13.66 but has since rebounded, thanks to intervention in the currency markets from the People’s Bank of China (PBOC) China’s central bank.
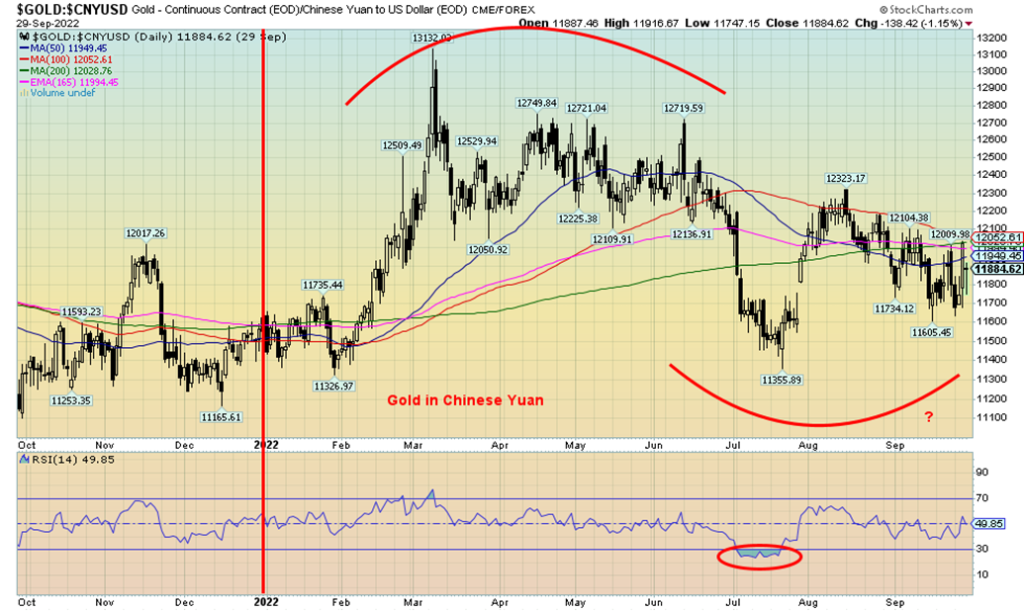
However, if the yuan has been falling, it is probably not surprising that the yuan in terms of gold has been rising. The rise since December 31, 2021, is currently 2%, but it has been as high as about 13% back in March 2022, when gold was rising but the yuan was stagnant. China is a major producer of gold, leading the world in gold production in 2021 with 332 metric tonnes. Together with Russia, the world’s second-largest gold producer at 331 metric tonnes in 2021, they hold a dominant position, controlling roughly 22% of global production. That may explain why both Russia and China are moving aggressively to back their currencies with gold to eventually create a global alternative to the U.S. dollar as the world’s reserve currency. This is all part of the currency wars.
PBOC has also asked state-owned banks to sell U.S. dollars overseas to help the yuan. China holds some $970 billion of U.S. treasuries. But that is down $98 billion in the past year and $340 billion from its peak way back in 2013. China is also not participating in U.S. treasury bond auctions the way they used to. All this has forced other central banks to step up, but that also has the effect of helping to push up yields on U.S. treasuries.
China is also attempting to build the “New Silk Road,” a $900-billion initiative known as the “Belt and Road” and is also trying to build an alternative to the World Bank, IMF, and SWIFT, the global messaging system to move money. All these institutions are currently dominated by the U.S. China’s aim, along with Russia, is to create an alternative system to challenge U.S. global hegemony. The Shanghai Gold Exchange (SGE) is also an attempt to challenge London and New York as the world’s dominant exchange for the trading of gold and other commodities. The SGE is already gaining prominence with global investors as it is the only venue for trading gold in China. Links have already been built with the Chicago Mercantile Exchange (CME). All of this may go a long way to explaining current tensions between the U.S. and China with Taiwan as the country in the middle of the dispute. The real dispute is economic, challenging the U.S.’s role as a global hegemon and its role as the world’s reserve currency. Recall as well the U.S.’s trade disputes with China under former President Donald Trump, whereby numerous tariffs were placed on Chinese imports. Those tariffs have not been removed by the Biden administration.
All of this has translated into ongoing weakness for the Shanghai Stock Exchange (SSEC) which is like other stock indices, down in 2022 by 16.5%. The SSEC market trend is down across all time frames. The chart below suggests that the SSEC could break further to the downside. Confirmation would come breaking under 2,800. Only regaining above 3,800 might change the bearish scenario.
SSEC 2003–2022
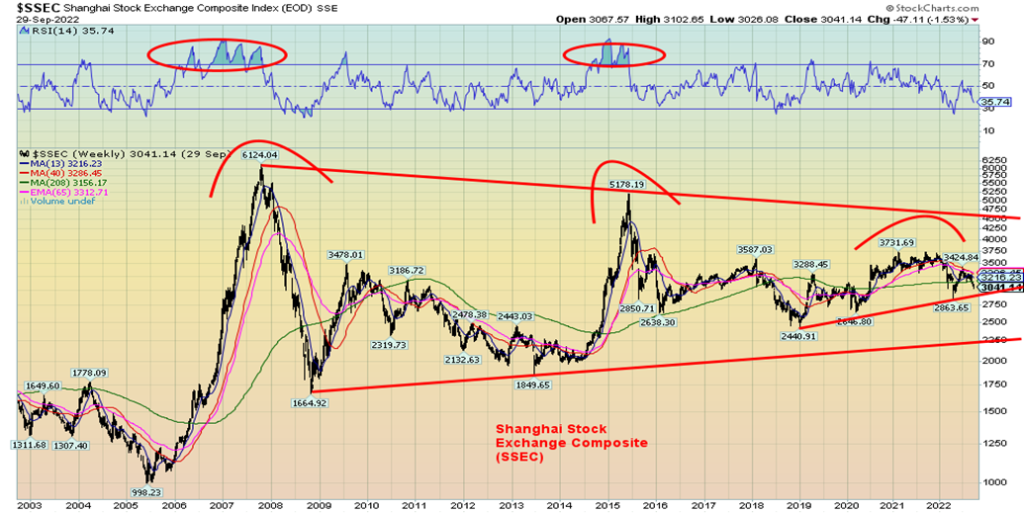
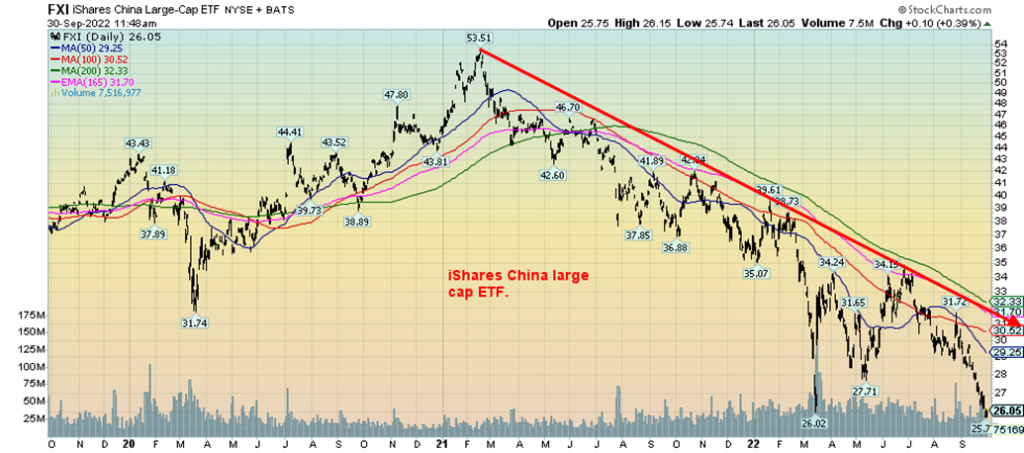
Chinese stocks are tradeable through stock vehicles like the iShares China Large-Cap ETF (FXI/NYSE), but, like so many others, the FXI Is down 50% from its high in February 2021 and still shows few signs of a bottom. The ETF does show a yield of 2.2%.
Markets & Trends
| % Gains (Losses) Trends | ||||||||
| Close Dec 31/21 | Close Sep 30/22 | Week | YTD | Daily (Short Term) | Weekly (Intermediate) | Monthly (Long Term) | ||
| Stock Market Indices | ||||||||
| `S&P 500 | 4,766.18 | 3.585.62 (new lows) | (2.9)% | (24.8)% | down | down | neutral | |
| Dow Jones Industrials | 36,333.30 | 28,725.51 (new lows) | (2.9)% | (21.0)% | down | down | neutral | |
| Dow Jones Transport | 16,478.26 | 12,058.26 (new lows) | (0.6)% | (26.8)% | down | down | neutral | |
| NASDAQ | 15,644.97 | 10,575.62 | (2.7)% | (32.4)% | down | down | neutral | |
| S&P/TSX Composite | 21,222.84 | 18.444.22 | (0.2)% | (13.1)% | down | down | neutral | |
| S&P/TSX Venture (CDNX) | 939.18 | 594.13 (new lows) | 2.8% | (36.7)% | down | down | down | |
| S&P 600 | 1,401.71 | 1,064.95 (new lows) | (1.5)% | (24.0)% | down | down | neutral | |
| MSCI World Index | 2,354.17 | 1,693.06 (new lows) | (4.5)% | (28.1)% | down | down | down | |
| Bitcoin | 47,907.71 | 19,947.60 (new lows) | 6.9% | (58.4)% | down (weak) | down | down | |
| Gold Mining Stock Indices | ||||||||
| Gold Bugs Index (HUI) | 258.87 | 194.33 (new lows) | 8.1% | (34.9)% | down | down | down | |
| TSX Gold Index (TGD) | 292.16 | 242.16 (new lows) | 8.8% | (17.1)% | down | down | down | |
| % | ||||||||
| U.S. 10-Year Treasury Bond yield | 1.52% | 3.83% (new highs) | 3.8% | 152.0% | ||||
| Cdn. 10-Year Bond CGB yield | 1.43% | 3.17% | 2.9% | 121.7% | ||||
| Recession Watch Spreads | ||||||||
| U.S. 2-year 10-year Treasury spread | 0.79% | (0.44)% | 13.7% | (155.7)% | ||||
| Cdn 2-year 10-year CGB spread | 0.48% | (0.63)% | 10.0% | (231.3)% | ||||
| Currencies | ||||||||
| US$ Index | 95.59 | 112.08 (new highs) | (0.8)% | 17.3% | up | up | up | |
| Canadian $ | .7905 | 0.7240 (new lows) | (1.5)% | (8.4)% | down | down | down | |
| Euro | 113.74 | 98.08 | 1.2% | (13.8)% | down | down | down | |
| Swiss Franc | 109.77 | 101.42 | (0.4)% | (7.7)% | down | down | down | |
| British Pound | 135.45 | 111.54 (new lows) | 2.8% | (17.7)% | down | down | down | |
| Japanese Yen | 86.85 | 69.07 (new lows) | (1.0)% | (20.5)% | down | down | down | |
| Precious Metals | ||||||||
| Gold | 1,828.60 | 1,672.00 (new lows) | 1.0% | (8.6)% | down | down | down (weak) | |
| Silver | 23.35 | 19.04 | 0.7% | (18.5)% | neutral | down | down | |
| Platinum | 966.20 | 859.10 | flat | (11.1)% | down (weak) | down | down | |
| Base Metals | ||||||||
| Palladium | 1,912.10 | 2,182.20 | 5.4% | 14.1% | up | neutral | neutral | |
| Copper | 4.46 | 3.41 | 2.1% | (23.6)% | down | down | neutral | |
| Energy | ||||||||
| WTI Oil | 75.21 | 79.49 | 1.0% | 5.7% | down | down | up | |
| Nat Gas | 3.73 | 6.77 | (3.2)% | 81.5% | down | neutral | up | |
New highs/lows refer to new 52-week highs/lows and, in some cases, all-time highs.
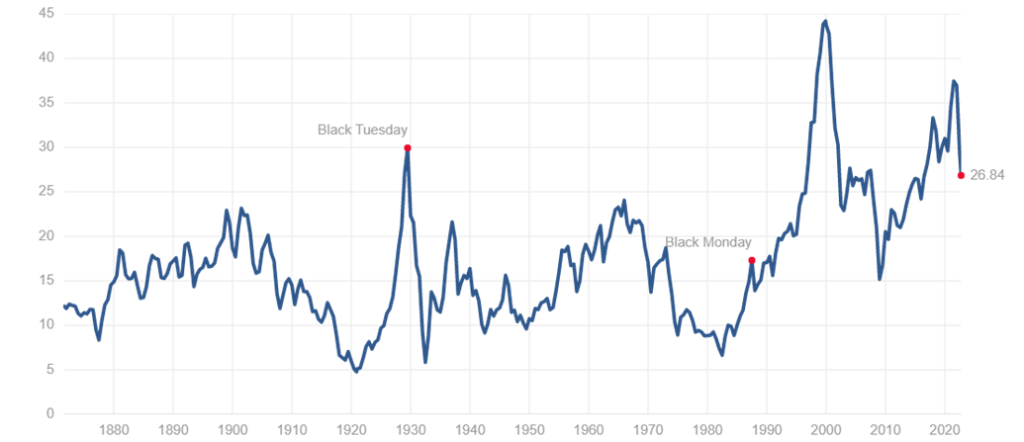
Had enough yet? Unfortunately, it is not over yet. September 2022 has been the worst month for stocks since March 2020 and the worst September since 2002. The S&P 500 has fallen 9.3% while the Dow Jones Industrials (DJI) is down 8.8%. The fear indices have been moving into overdrive. Put/call ratios peaked over 1.00 which is extreme; the McClellan Summation Index (RASI) hit well over negative 900 levels seen in October 2008, December 2018, and March 2020; the S&P 500 Bullish Percent Index (BPSPX) is down at levels also seen in October 2008, October 2011, August 2015, December 2018, and March 2020. However, the VIX Volatility Index is, surprisingly, only around 30. It has recently diverged in price and is nowhere near spikes over 80 seen in October 2008 and March 2020. Numerous other indicators are also at or near extremes and diverging with the price action (i.e. lower prices but indicators making higher lows). PE ratios have fallen but remain above long-term averages. That suggests that the market is still overvalued.
All this might help set up another tradeable bottom in October. After all, October is known as a bear killer. But will it signal the absolute end of the bear market? Most likely not. Bear market rallies are a normal part of a bear market. Since the high in January 2022, we’ve had four bear market rallies of varying degrees and a few other short-term pops. A potential time for a short-term bottom is around October 10, given that period saw the October low in 2002, the October high in 2007, a temporary low in October 2008, and a low in October 2011.
Shiller PE Ratio – The Market is still Overvalued 1870-2022
The bear market of 2022 has been a slow-moving one, moving relentlessly down. While Hurricanes Fiona and Ian are causing considerable damage to homes and people’s lives, the bear market of 2022 is causing considerable damage to people’s portfolios. It is estimated that, since the bear got underway, an incredible $32 trillion has been lost. It is the fourth worst start to the year in stock market history and we still have three months left.
On the week, the S&P 500 fell 2.9%, the DJI was off, also 2.9%, the Dow Jones Transportations (DJT) was down 0.6%, the NASDAQ off 2.7%, the small cap S&P 600 down 1.5% and the mid-cap S&P 400 down 1.6%. The S&P 500, 400 and 600, the DJI, and the DJT all made fresh 52-week lows. The DJI closed below 29,000 for the first time since November 2020. In Canada, the TSX Composite lost a small 0.2%, thanks to a rebound from the metals and energy, and the TSX Venture Exchange (CDNX) was the star, up 2.8%. In the EU, the London FTSE fell 1.8%, the Paris CAC 40 was down 0.4%, and the German DAX was off 1.4%. The CAC and the DAX made 52-week lows. In Asia, China’s Shanghai Index (SSEC) fell 2.1% and the Tokyo Nikkei Dow (TKN) dropped 4.5%. The MSCI World Index made fresh 52-week lows losing 4.5%. The U.S. indices are all universally in a bear market, down over 20% from the highs with the NASDAQ leading the way down 32.4% thus far in 2022.
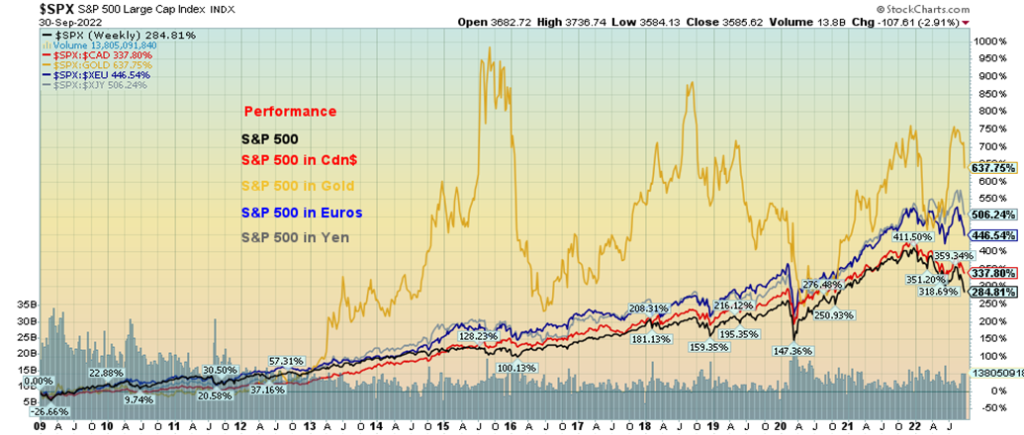
One thing we have noted is if you were invested in the S&P 500 in currencies other than the U.S. dollar, you’d have outperformed the S&P 500. In 2022, what that would mean is that your losses would have been less than that experienced by the S&P 500 itself. Our chart below shows the return in various currencies and gold. This means if you were an investor from Canada, the eurozone, or Japan you’d convert your Cdn$, euros, and yen to U.S. dollars and invest in the S&P 500. The same for gold. Since 2009 the best return came from converting the gold to U.S. dollars and investing in the S&P 500. That return would have been 637% vs. 284% by being a domestic investor in the S&P 500. In euros, your return was 446%, in yen 506%, and in Cdn$ 338%. All outperformed the S&P 500 itself.
Performance S&P 500 in Various Currencies 2009–2022
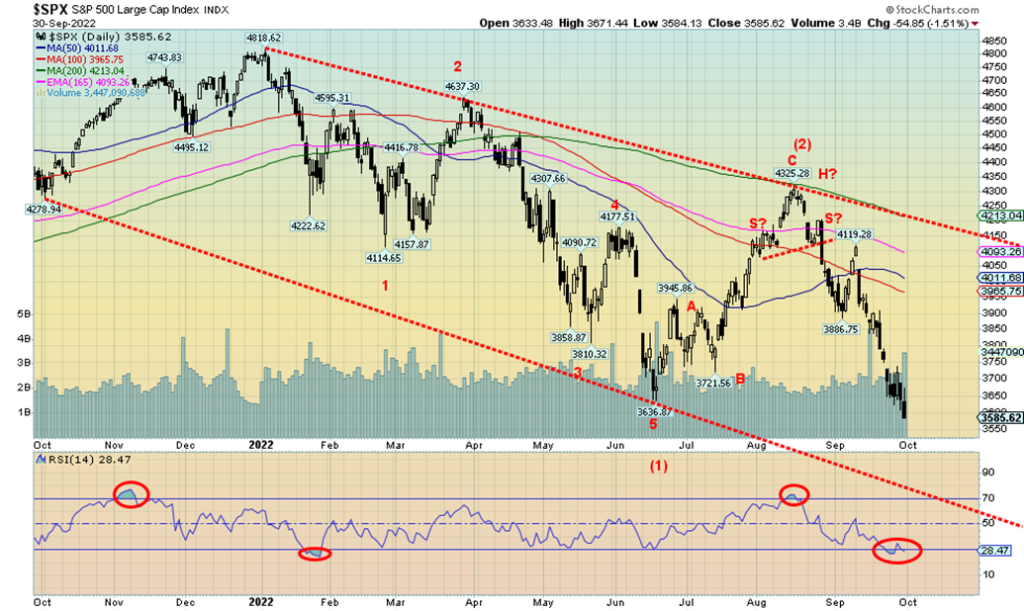
As the stock market continues to decline, all we can note is the next potential targets to the downside. For the S&P 500, the next targets could be 3,400 to 3,500 (last at 3,585). For the DJI, our next targets are between 27,000 to 27,500. Given the current oversold conditions, a bounce this coming week would not be surprising. To signal a possible short-term low, the S&P 500 would need to regain above 3,750. Above 3,900 would confirm a low.
Holding bonds has been no panacea for avoiding the bear market. The U.S. 10-year treasury note is down 14% thus far in 2022 before the coupon. Outperformance has come from holding gold, which is only down 8.6% in 2022. Even holding 3-month T-Bills would have brought a negative return. All this before factoring in the effects of inflation.
The S&P 500 and the NASDAQ have now experienced three consecutive quarterly losses for the first time since 2009. For the DJI, it is the first time they have lost three quarters in a row since 2015. Hurricanes may be churning in the Atlantic, but hurricanes come at you with ferocity for a short time only, although the effects of the devastation may seem to last forever. For the stock market, it is just relentlessly down with occasional pauses. And it takes years to recover.
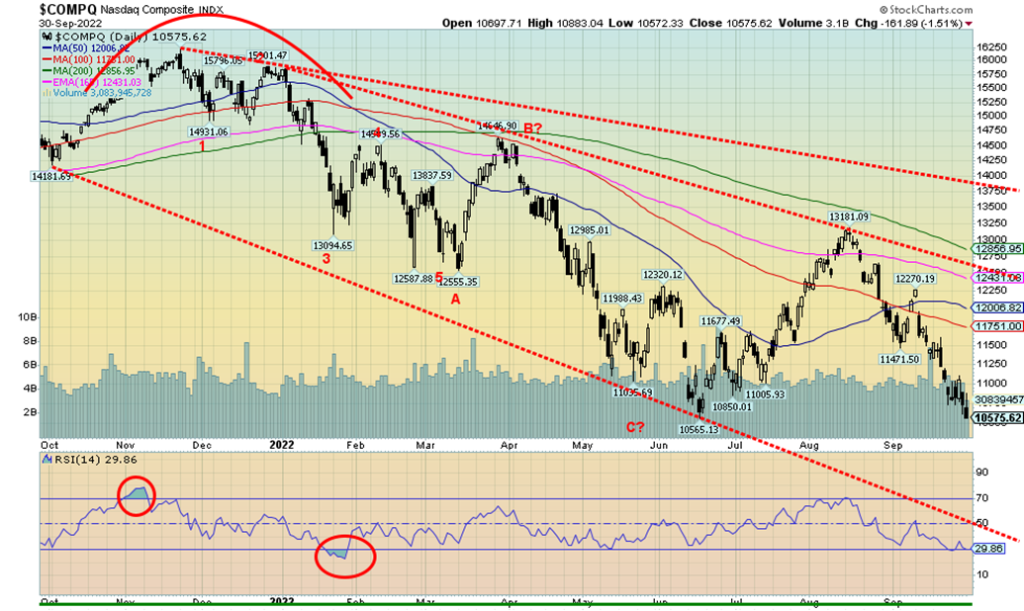
With all of the other indices making new 52-week lows, one would have thought that the NASDAQ was amongst them. It wasn’t. Tech stocks that dominate the NASDAQ actually fared somewhat better this past week and the NASDAQ held (just) above its recent lows. Still, the NASDAQ was down 10.5% for September, outperforming the S&P 500 and the DJI to the downside. None of that stopped some FAANG stocks from making new 52-week lows. Making new lows were Meta, Google, Microsoft, Alibaba, and Nvidia. The best-performing FAANG stock (part of the FANG index) has been Twitter, which is actually up 1.4% so far in 2022, given the possible takeover by multi-billionaire Elon Musk. The worst performer has been Netflix, down 61% thus far in 2022.
The suspicion here is that the NASDAQ will most likely make new lows this coming week. It has already passed the point of no return. The next good area of support is around 9,800 to 10,000. But, like other indices, the RSI is deeply oversold, last at 29.85. The problem is it can get even more oversold. A short-term low would not be indicated until we regain above 11,000. Confirmation of a low would come above 11,500. With the 200-day MA up around 12,850, we are currently about 18% under that level. In June 2022, at the low before the June-July rally, the NASDAQ was 24.5% under the 200-day MA. That would suggest we may have further downside before we see a tradeable low.
U.K. FTSE 100
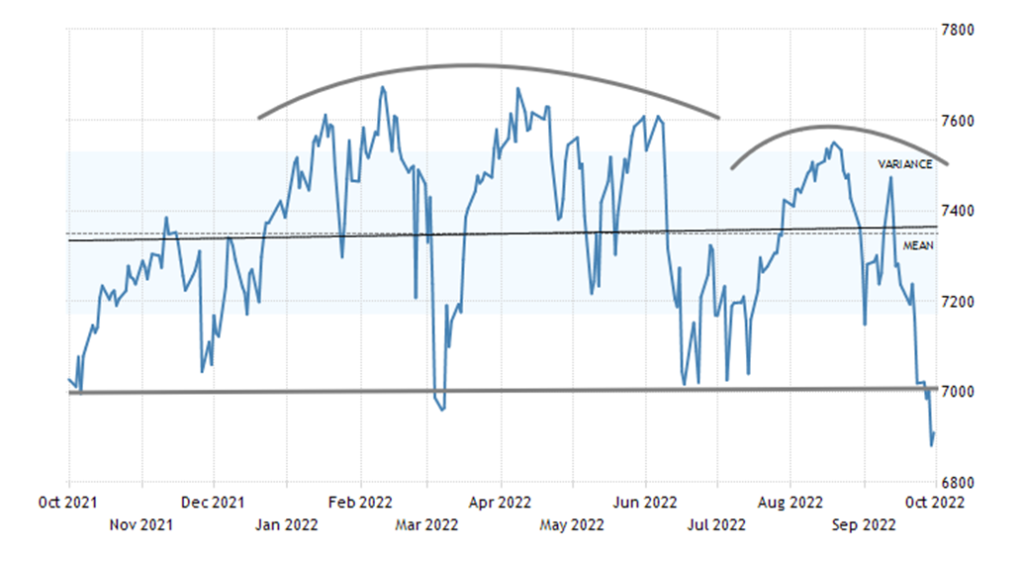
Given all the turmoil in U.K. markets with the pound sterling and the gilt market, it probably comes as no surprise that the problems are spreading to the U.K. stock market. This is a chart of the FTSE 100, the U.K.’s prime stock index. The 7,000 zone was the line in the sand for to what appears as a large topping pattern that has formed over the past couple of years. The chart now projects the FTSE to fall to around 6,300, a decline of roughly 9% from current levels. The FTSE is down roughly 7% in 2022, which actually makes it one of the better-performing stock indices. Going forward, however, the index appears to be problematic and could fall further. Chaos in the U.K. currency and gilt markets appears ready to spread to the stock market.
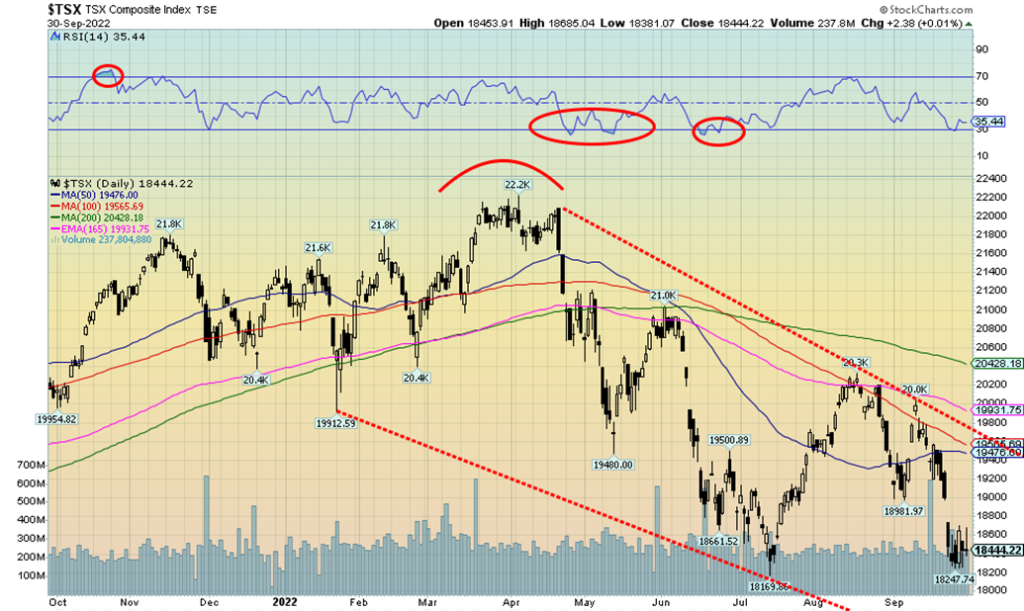
We suppose one could say we are lucky to be in Canada, investing in the TSX. The TSX has been one of the better-performing indices. Only the Tokyo Nikkei Dow (TKN) and the London FTSE 100 have done better than the TSX of all the indices we note each week. This past week the TSX fell a small 0.2%. The small-cap TSX Venture Exchange (CDNX) was a star, gaining 2.8% on the week; however, it is still down 36.7% on the year. The CDNX made an upside reversal this past week as it made new lows but closed higher. A possible positive sign?
The biggest sub-index loser on the TSX has been Health Care (THC), down 52.4% thus far in 2022. If there is a winner it is Consumer Staples (TCS), down only 0.5% in 2022. Everyone has to eat. This past week was interesting in that three sub-indices put in outside possible key reversal weeks. The three were Golds (TGD), up 8.8% this past week, Metals & Mining (TGM), up 6.6%, and Materials (TMT), up 7.0%. A key reversal week occurs when a stock, index, etc. makes new lows (preferably new all-time lows), then reverses and takes out the high of the previous week and closes above the high of the previous week. It is normally a bullish sign and a buy signal. But, like anything, it needs follow-through to the upside to confirm the key reversal. The three, along with Energy (TEN) up 3.2% this past week, helped keep the TSX afloat and offset the biggest loser on the week—Utilities (TUT), down 6.6%. Altogether on the week, four sub-indices were up, two more were essentially flat, while eight were down on the week, led by the previously mentioned Utilities.
That’s a big gap for the TSX to fill between roughly 18,800 and 19,000. Successfully closing the gap would give us a buy signal. The TSX avoided new 52-week lows, but the odds still favor new lows ahead.
10-year Treasury Bond/Canadian 10-year Government Bond (CGB)
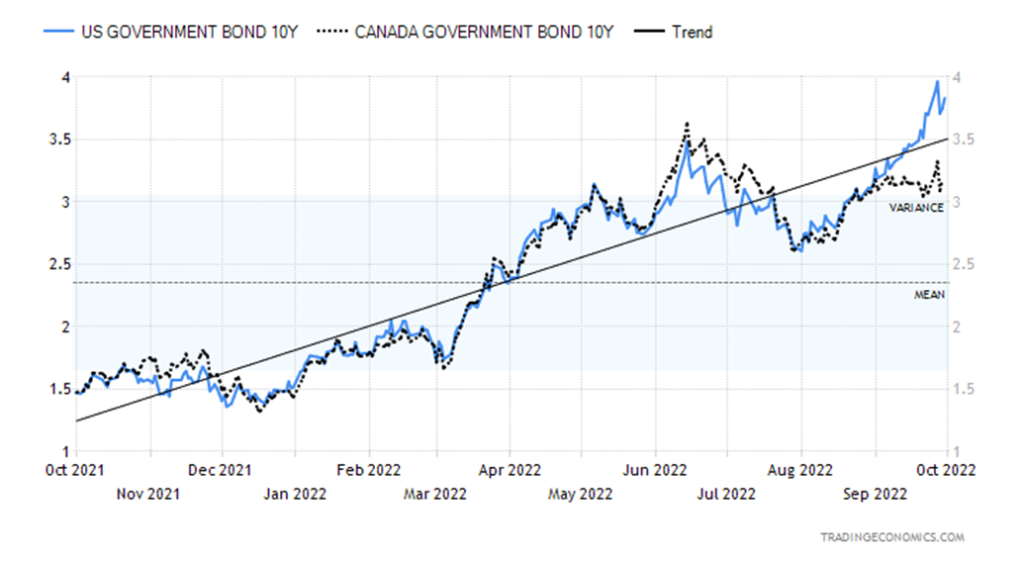
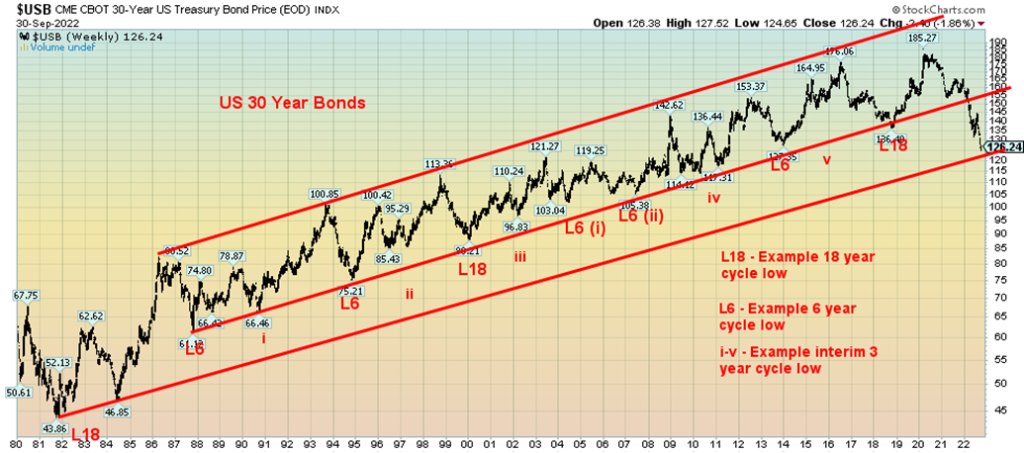
The 10-year U.S. treasury note hit its highest level since 2010 this past week at 4.04%. This was also the first time it was over 4% since 2007. If anyone thought that owning bonds or even treasury bills for that matter was a safe haven from the ravages taking place in the stock market, they’d be sadly mistaken. Bonds are suffering one of their worst years ever. In August 2020, the 10-year hit a price of 140.36. Today it is at 112.22, a decline of 20%. Bonds can enter bear markets as well. The 30-year U.S. treasury bond has fallen 32% from its peak. This makes this the worst bond bear since 1980–1981. It also signals the end of the era of ever-rising bond prices (falling yields as yields move inversely to bond prices).
Our chart below shows the history of the 30-year bond from 1978. We haven’t had a bear market in bonds like this since the late 1970s. We have memories of bond routes in 1994 and 2000 and even 2018, but this decline pales those. And all we appear to be headed for is the next 6-year cycle low (due either late this year or in 2023) of the current 18-year cycle. The 18-year cycle last bottomed in October 2018 so the next one isn’t due until 2036. The 6-year cycle low would be the first of three over the next 12 years. We have also broken trendline support that had been in place since 1987 and are currently challenging the trendline up from the 1981 all-time low of 43.86. We are in a period of rising interest rates.
That being said, we could be at a level where we do find some support. The 10-year did close down on the week (yield) after making the twelve-year high in yield. It is a possible signal that we’ve topped for the moment (bottomed in price). Canadian bond yields have also broken their long-term trend and are also at their highest levels in twelve years. However, the Government of Canada 10-year bond (CGB) at 3.17% is well below the yield on the U.S. 10-year at 3.83%. This is the widest spread in quite some time.
U.S. 30-Year Treasury Bond 1978–2022
Can things get worse? Well, one only needs to look at the rout going on in the U.K. gilt market—so, yes, things could get worse. The 10-year U.K. gilt saw its yield rise from 1.80% in August to a high of 4.50% this past week before settling around 4.10%. That was after intervention by the BOE who had to come in and effectively bail out the system as liquidity was collapsing. Ripple effects were definitely felt into the EU and U.S. bond markets. Could China start selling its huge U.S. treasury bond holdings? PBOC has suggested as much to the state-owned Chinese banks to help support the yuan. Although, given that we appear to be on the edge of long-term support, it would take a bigger catalyst to push the 30-year through 120 and head for even lower prices. But it is not impossible if a liquidity crisis erupts in the U.S. and EU bond markets, as was the case in the gilt market.
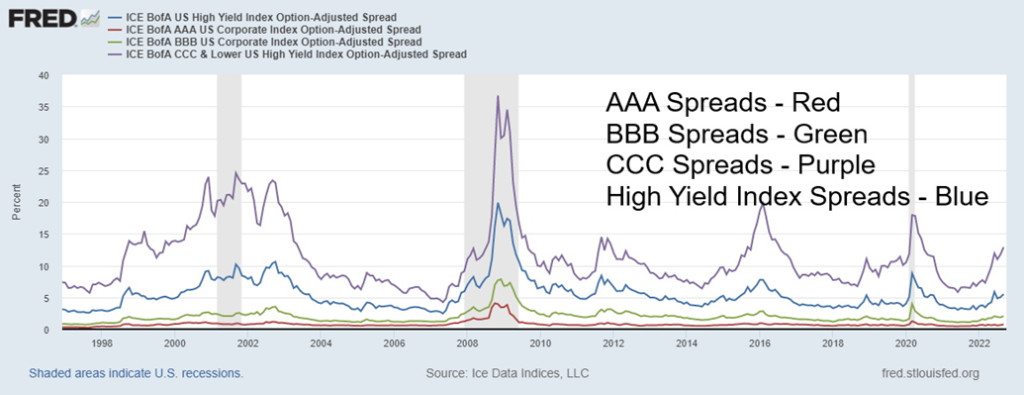
Yield spreads are still negative although off their lows. In the U.S., the 2–10 spread is at -0.44% but off its lows. In Canada, the 2–10 spread is at -0.63%, also off its low. Yield spreads to corporate bonds are rising but they are not yet at levels seen even during the March 2020 pandemic panic. As the chart shows, they are rising but have a long way to go before they reach 2008 financial crisis levels. We are not as yet hearing rumours of any major defaults, but that remains a possibility as the bond market falls. Inevitably, along the way there is either a major bankruptcy or a bond fund that blows up. We’ve seen that before.
U.S. Yield Spreads Treasuries to AAA, BBB, CCC and High Yield Corporate Bonds 1997–2022
It is widely expected that the Fed is not yet finished hiking rates. At a minimum, 50 bp hikes are expected at the November and December 2022 FOMC meetings. That would bring the Fed rate to 4.25%, but some expect it to rise to 4.50%–4.75%. Irrespective of this, do not expect the current volatility in the bond markets to end. And do not expect the Fed to pause its rate hikes despite calls for that in many circles. Their aim is to wrestle inflation down even if it causes a recession.
For the record, the Fed’s closely watched Personal Consumption Expenditures (PCE) prices rose 7.3% in Q2. That was above the expected 7.1%. Year-over-year, PCE prices rose 6.2%, about as expected. Consumer confidence continues to wane everywhere. The latest Michigan Consumer Sentiment Index came in at 58.6, below the expected 59.5. This week we get the September job numbers (Friday). Nonfarm payrolls are expected to rise 250,000 vs. 315,000 in August. The unemployment rate (U3) is expected to remain at 3.7%. Canada also releases its employment numbers, looking for a possible gain of 20,000 jobs. The unemployment rate is expected to stay at 5.4%.
We are still firmly on recession watch.
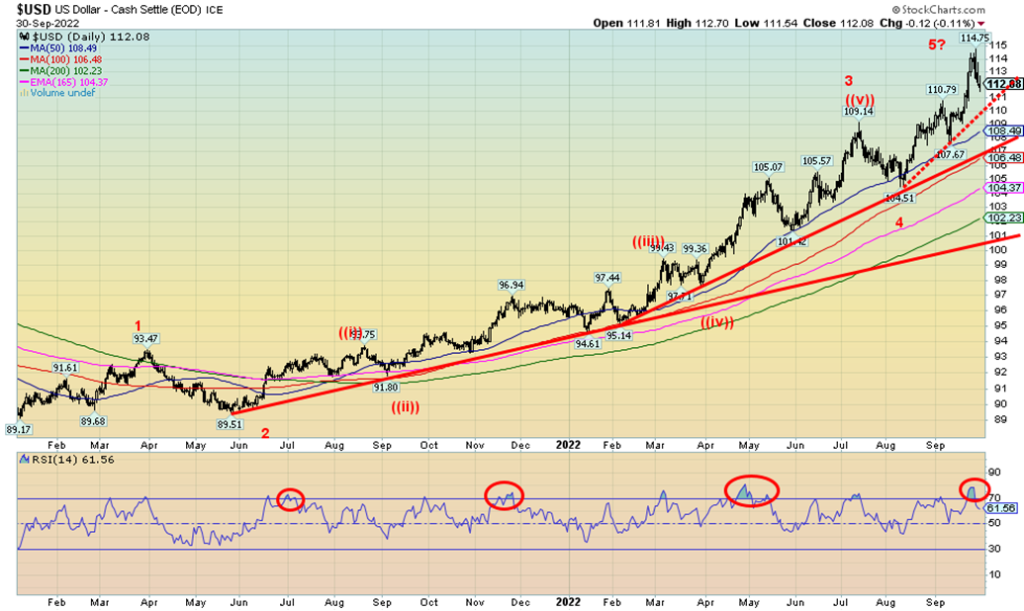
The US$ Index made another new high this past week, then reversed and closed lower. No, it did not make an outside week to the downside, so all we can call this is a reversal week and not a key reversal week. Still, it could signal at least a temporary top in the US$ Index. Overall, the US$ Index fell 0.8% this past week after making new 52-week highs. The euro gained 1.2% but the Swiss franc fell 0.4%. Despite all the turmoil in the U.K., intervention by the BOE saved the pound sterling for the moment as it closed higher by 2.8% after making new 52-week lows. The Japanese yen lost 1.0% and made fresh 52-week lows despite the intervention of the BOJ. In Canada, the Canadian dollar also fell, losing 1.5% and also fell to fresh 52-week lows. We’ve seen no significant intervention by the BofC, unlike intervention by the BOE and the BOJ. If the US$ Index were to fall and break under 110 it could be a catalyst for gold, which tends to move inversely to the U.S. dollar. Gold did reverse to the upside this past week.
Currency turmoil has become the norm of late and, like the bond markets, we are not sure how all this will end. Central banks everywhere are starting to come to the rescue of their currencies. Ultimately, all that will be good for gold as gold is money and currency as well. However, unlike fiat currencies, gold is actually worth something. Historically, all fiat currencies have ultimately returned to their real value—zero.
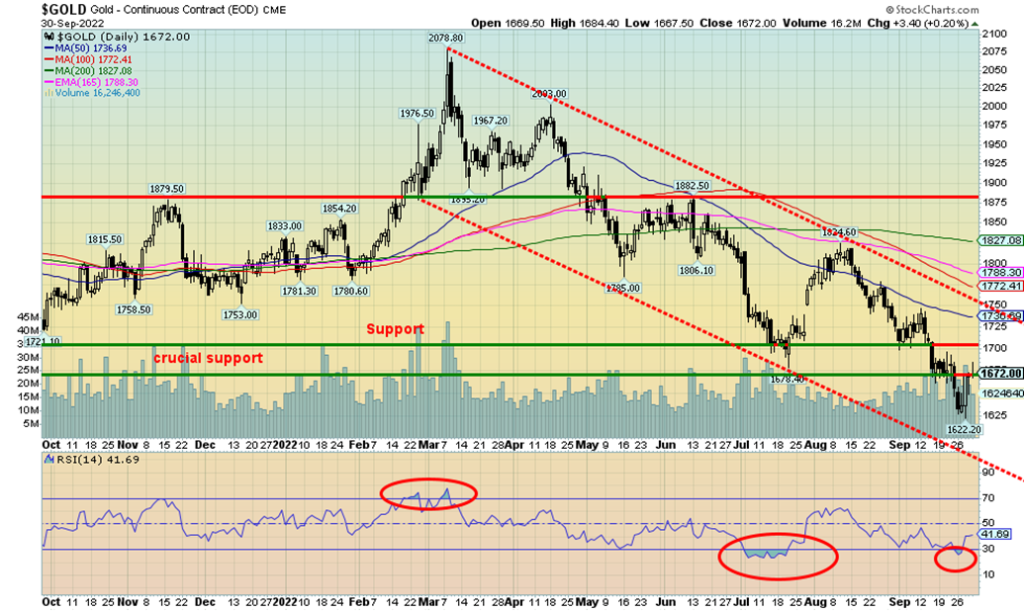
Does an outside reversal week portend higher prices for gold? Gold bugs certainly hope so. This past week, gold made fresh 52-week lows, then reversed, taking out the high of the previous week and closing above that level. A possible key reversal. But it will need follow-through to confirm. And we still need to regain above $1,700 and especially above $17.50 to confirm our low. Other encouraging signs we’ve seen for gold are a raft of headline articles saying gold is trash, nobody wants it, it’s headed for the basement, etc. These are the kind of headlines we often see at significant bottoms. At the top, it is the opposite.
This past week gold gained 1.0% while silver was up 0.7%. Platinum was flat but palladium gained 5.4% and copper was up 2.1%. But it was the gold stocks that were the stars, also making outside reversal weeks after making new lows for the down move as the Gold Bugs Index (HUI) closed up 8.1% and the TSX Gold Index (TGD) gained 8.8%. In other currencies gold continues to be a star. The turmoil in the U.K. sparked a rush into gold that had one coin dealer saying he keeps running out of coins. Gold in pound sterling fell just shy of a record high. Gold in Canadian dollars also enjoyed a good up week.
Naturally, if gold were to fail at either of our $1,700 or $1,750 levels it would be negative. New lows below this past week’s low of $1,622 could then next target gold down to $1,575 and even down to $1,450 to $1,510. We can’t be complacent yet that we are going to get a rise, despite the obvious bullishness from the gold bug crowd. The broader world is still negative about gold. When they jump in, then gold begins to really move. What would spur them to jump in? Well, the turmoil in the U.K. currency and bond markets has sparked a confidence crisis over the U.K. government. Loss of confidence in government, coupled with loss of confidence in the currency, are a recipe for gold to rise. We’re seeing some signs of that with the current crisis in the U.K. Could it spread elsewhere? Gold is a currency. Gold is money. It has been that for over 3,000 years.
A supposed hedge against calamity, gold is failing to hold its own
– David Olive, Toronto Star September 29, 2022

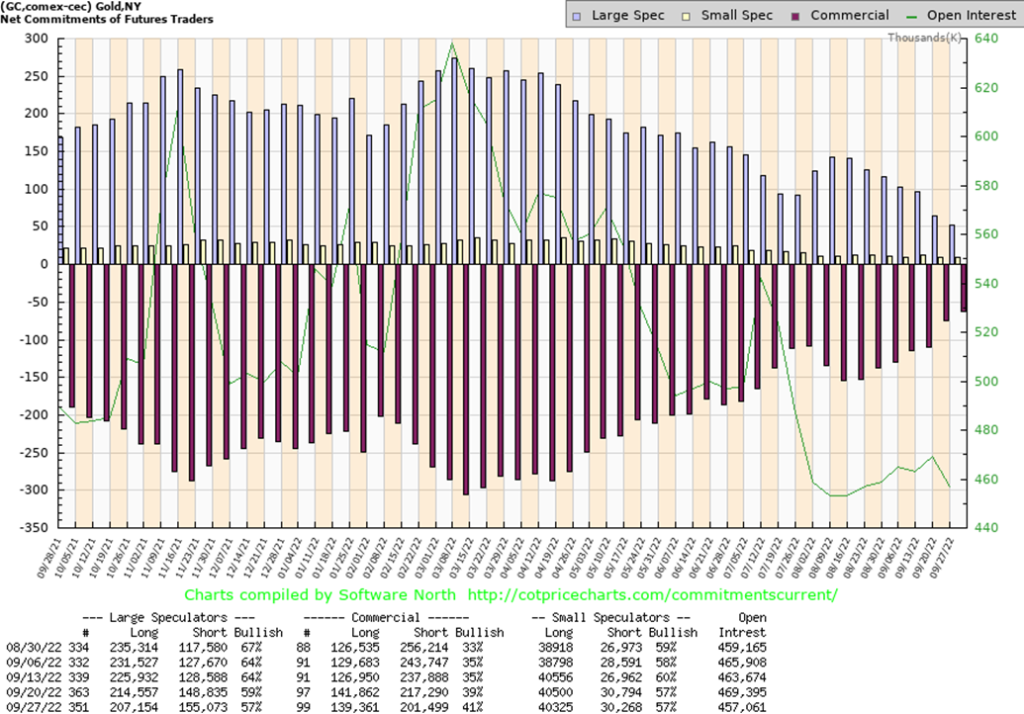
The gold commercial COT (bullion companies and banks) improved to 41% this past week, the highest level we’ve seen since 2018 before a major rally in gold. While long open interest fell just over 2,000 contracts short, open interest fell more down roughly 16,000 contracts. The large speculators COT (hedge funds, managed futures, etc.) fell to 57% from 59%. They cut their long position by roughly 7,000 contracts while increasing their short position by just under 7,000 contracts. Overall, open interest contracted, suggesting a big chunk of this week’s action in gold was short-covering.
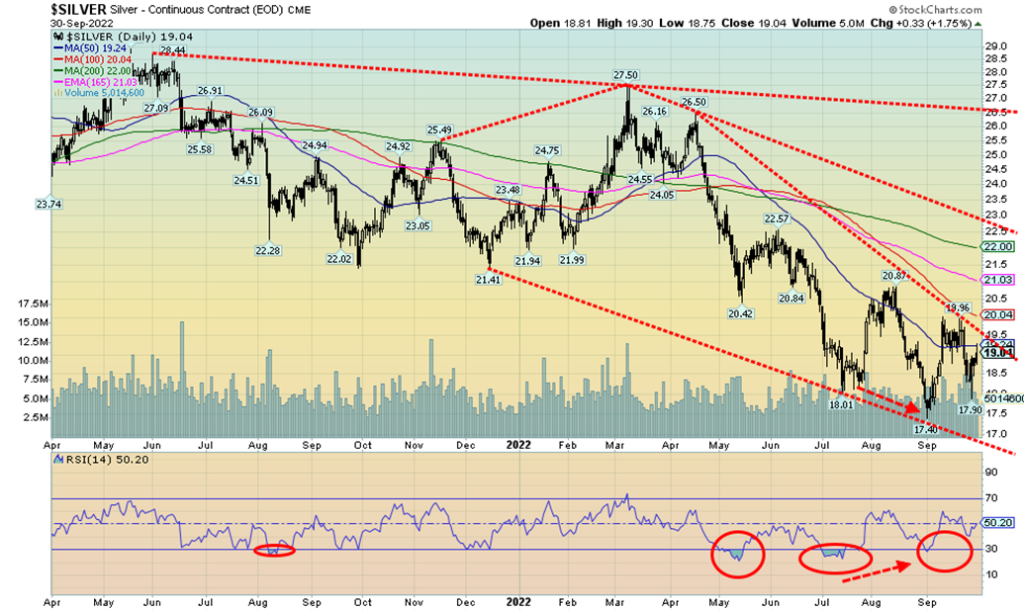
Silver, after looking like it was about to fall down, once again reversed and closed up on the week by 0.7%. A break now over $19.50 and especially over $20 could set silver up for further gains. Major resistance remains up to $22 and $22.50. Above $22.50 gains towards $25–$27 could then get underway. The danger is that silver falls back under $17.95, confirming that, instead, we would be headed lower. Silver continues to diverge with gold as gold once again made new lows this past week but silver did not. We continue to view this as a positive divergence that should result in higher prices for both gold and silver. We could be forming an awkward-looking head and shoulders pattern with the left shoulder low at $18.01 in July, the head low at $17.40 in September, and the low this week of $17.90 for the right shoulder. Normally, the right shoulder comes in higher than the left. The neckline would be at around $19.75 and could then project silver up to $23/$23.25. Again, a break under $17.95 could negate all this.
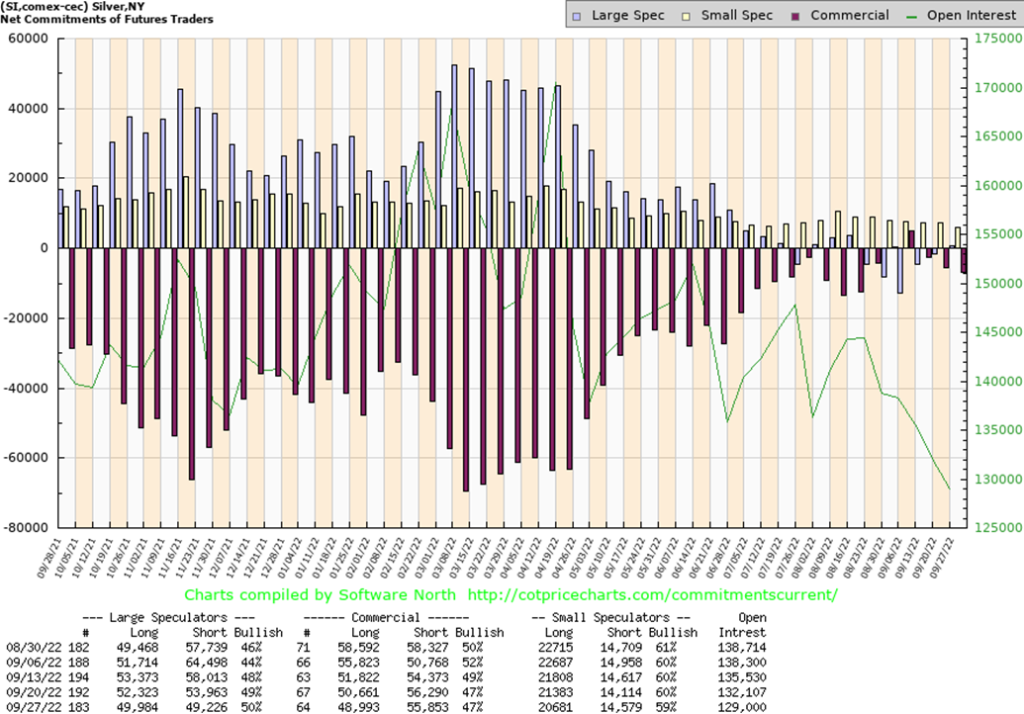
The silver commercial COT remained steady this past week at 47% although down from its recent high of 52%. The silver commercial COT is at its best level since 2018 just before another strong rally in silver prices. Long open interest slipped just under 2,000 contracts this past week while short open interest was off only about 500 contracts. The large speculators COT rose slightly to 50% from 49%; however, it is nowhere near levels we would find of concern. That suggests to us that silver prices have higher to go. Given the level of previous shorts in the market, it may take the form of a short squeeze. That appears to be what has driven silver prices higher recently. There apparently has been a delivery premium recently on physical silver contracts. That in turn could hamper the ability to deliver on silver paper contracts and could create a short squeeze as there is an inability to take physical silver to settle silver futures contracts. The COMEX would be unable to meet obligations. Things could get interesting in the silver market.
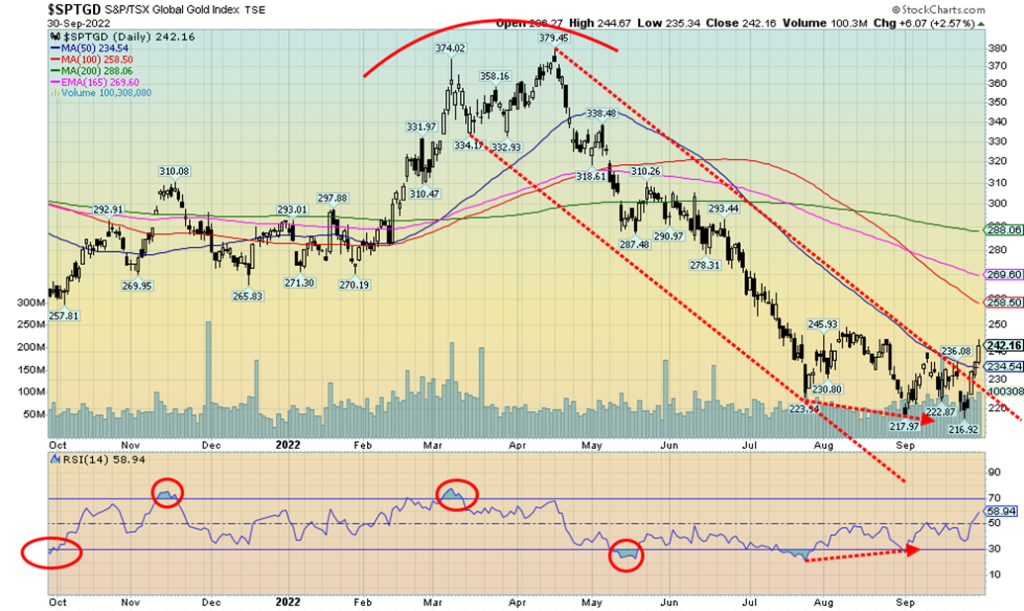
We don’t get this too often. This past week, the gold stock indices put in outside reversal weeks or, as we might call it, a key reversal week. A key reversal comes when the index makes new lows (preferably new all-time lows), then reverses, taking out the high of the previous week and closing above that high. Both the Gold Bugs Index (HUI) and the TSX Gold Index (TGD) put in outside-week reversals this past week. The HUI gained 8.1% while the TGD was up 8.8%, both after making new lows for the current move down. The indices also made a monthly reversal but not a key reversal. For the month, the TGD was up 8.2% and the HUI gained 4.0%. The TGD was assisted by the weak Canadian dollar. Contrast that with the losses in the major stock indices.
The result of this gets us more excited that the gold and the gold stocks could soon embark on a decent rally. Note how the TGD also closed above the 50-day MA for the first time since April 2022. The TGD also took out a recent high at 236. We also note some good divergences between the price action of the TGD and the RSI indicator. All in all, it is a buy signal for the gold stocks. Silver stocks did the best as silver itself was up 6.5% in September, even as gold was down 3.1%.
There is still a lot of work to do. The 200-day MA is at 288, requiring the TGD to gain another 19% just to reach that level. After six months of relentless down for the gold stocks, the time appears to be here that investors should now have some in their portfolios. Stocks remain cheap relative to gold as they have been for the past few years. Just to get to Gold/HUI ratios last seen in 2016 and 2020 near 5.0 vs. the current 8.6, the HUI would have to rise to 334 from the current 194 a gain of 72% from current levels. The TGD would have to rise to 380 from the current 242 to reach comparable levels a gain of 57%. Either way we look at it, the gold stocks are now a buy. The recent lows are the stop.
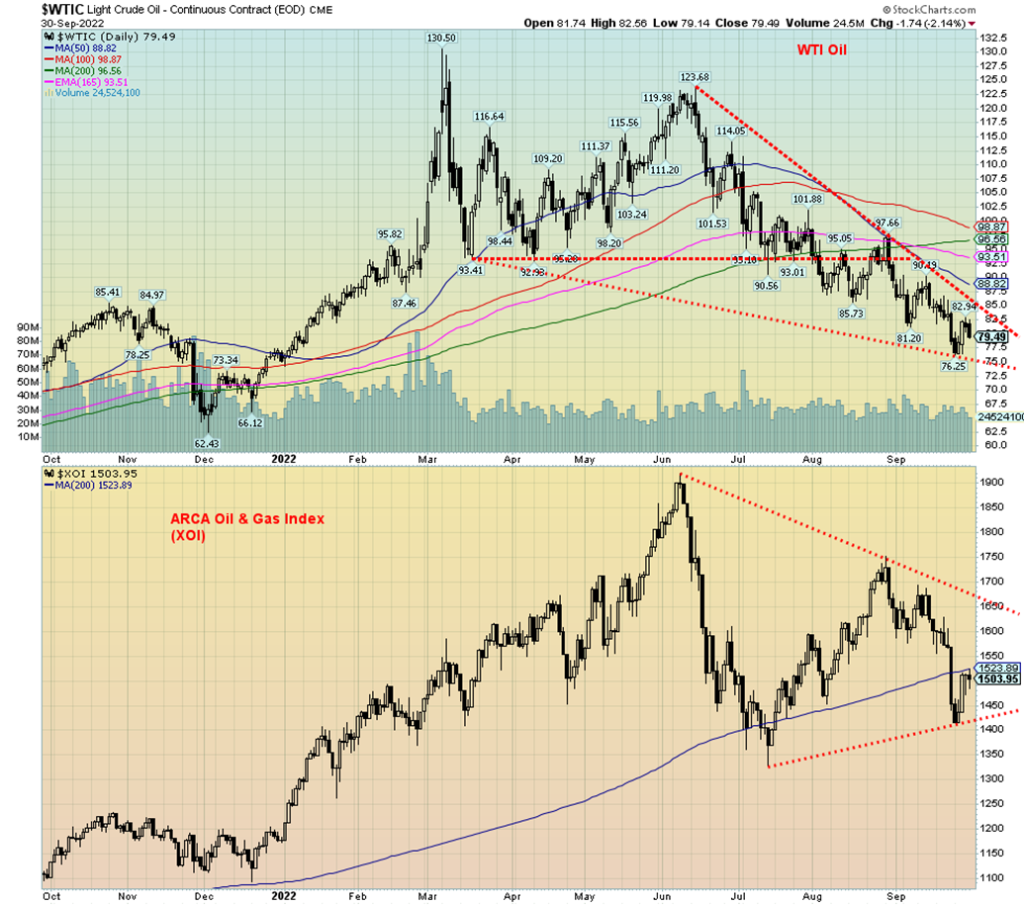
Oil prices jumped this past week as Hurricane Ian slammed into Florida, disrupting oil platforms in the Gulf of Mexico. However, overall, the oil markets have been relatively unaffected by hurricanes. That helped WTI oil to rise about 1.0% on the week. It didn’t help natural gas (NG) as it fell 3.2%, despite the suspected sabotage of the Nord Stream 1 line in Europe. The EU, U.S., and Russia are all pointing fingers at each other as the culprits behind the sabotage. Only the Ukraine line remains in use and that could soon be threatened as well. EU NG at the Dutch Hub rose 1.8%, but even that was off the highs of the week. So far, even the attack on the Nord Stream 1 line is not having a major impact on NG prices. The energy indices fared well with the ARCA Oil & Gas Index (XOI) up 3.5% and the TSX Energy Index (TEN) up 3.2% this past week.
Some upward pressure on oil prices this past week came from the drawdown of U.S. stocks, especially gasoline stocks. Additional sanctions were leveled against Iran although only indirectly as it was companies in India, Hong Kong, China, and the UAE that were hit with the sanctions for apparently enabling the sale of Iranian oil. Also playing a small role was a slight weakening of the US$ Index. Refinery problems on the West Coast had a negative effect on gasoline prices at the pump in Western Canada (particularly B.C.) and along the U.S. West Coast (California, Oregon, and Washington).
On October 5, OPEC meets and it is widely expected that they could cut production. Russia has already suggested a million b/d reduction for the meeting. That could send oil prices jumping higher once again if the members agree. Ideally, we understand, OPEC would like prices to remain between $80 and $120 for WTI, while slightly higher for Brent. Seasonally, oil prices sometimes rise into October before falling again. The real strong seasonals for oil come starting in December to June.
Surprisingly, the IAE have noted that demand for NG could rise in 2023 as the Asian economies rebound. The Asian economies are not as impacted by inflation and other issues that are being experienced in Western economies. Russia would stand poised to be a winner of that as they pivot from the west to the east. And many Asian countries have no interest in participating in U.S./Western sanctions. Meanwhile, EU countries and the U.K. are facing huge energy bills this winter as a result of sanctions on Russia and the ongoing war in Ukraine.
WTI oil needs to regain over $90 to suggest to us that a low is in. This week’s low was $76.25, shy of our potential $75 initial target. A move above $83 could suggest a low is in, but we prefer the $90 target to confirm a low. A breakdown under the low of $76.25 could next target $69/$70.
__
(Featured image by DanielAlon via Pixabay)
This article may include forward-looking statements. These forward-looking statements generally are identified by the words “believe,” “project,” “estimate,” “become,” “plan,” “will,” and similar expressions. These forward-looking statements involve known and unknown risks as well as uncertainties, including those discussed in the following cautionary statements and elsewhere in this article and on this site. Although the Company may believe that its expectations are based on reasonable assumptions, the actual results that the Company may achieve may differ materially from any forward-looking statements, which reflect the opinions of the management of the Company only as of the date hereof. Additionally, please make sure to read these important disclosures.
Copyright David Chapman, 2022
David Chapman is not a registered advisory service and is not an exempt market dealer (EMD) nor a licensed financial advisor. He does not and cannot give individualised market advice. David Chapman has worked in the financial industry for over 40 years including large financial corporations, banks, and investment dealers. The information in this newsletter is intended only for informational and educational purposes. It should not be construed as an offer, a solicitation of an offer or sale of any security. Every effort is made to provide accurate and complete information. However, we cannot guarantee that there will be no errors. We make no claims, promises or guarantees about the accuracy, completeness, or adequacy of the contents of this commentary and expressly disclaim liability for errors and omissions in the contents of this commentary. David Chapman will always use his best efforts to ensure the accuracy and timeliness of all information. The reader assumes all risk when trading in securities and David Chapman advises consulting a licensed professional financial advisor or portfolio manager such as Enriched Investing Incorporated before proceeding with any trade or idea presented in this newsletter. David Chapman may own shares in companies mentioned in this newsletter. Before making an investment, prospective investors should review each security’s offering documents which summarize the objectives, fees, expenses and associated risks. David Chapman shares his ideas and opinions for informational and educational purposes only and expects the reader to perform due diligence before considering a position in any security. That includes consulting with your own licensed professional financial advisor such as Enriched Investing Incorporated. Performance is not guaranteed, values change frequently, and past performance may not be repeated.


Ecobnb Turns Sustainable Tourism Into Measurable Impact
Ecobnb’s sustainable tourism platform generated significant environmental and social impact in 2025, avoiding 58,207 kg of CO₂ and adding 583...


Sugar Markets Balance Biofuel Demand and Global Supply
Sugar markets in New York and London were mostly unchanged as the Iran conflict renewed interest in biofuels. Drought concerns...


The $40 Trillion Trap: Disinflation Is Not Deliverance
U.S. debt has reached $40 trillion, with $24 billion weekly interest, while deficits accelerate. Despite disinflation in CPI, from cooling...


FinTech Matures as AI and Infrastructure Drive the Next Growth Phase
Fintech markets are entering a mature phase, shifting from rapid growth to consolidation, specialization, and sustainable business models. Zurich and...


Bitcoin, and Ethereum Rise, While Cardano Enters Transition
Bitcoin and Ethereum posted modest weekend gains, supported by ETF inflows. A new proposal may protect Bitcoin from quantum threats....
 |
|
 |  |
 |
|
-

 Fintech6 days ago
Advanced Blockchain Under Pressure Amid Crypto Market Shifts
-

 Impact Investing2 weeks ago
ICSC Raises €500M Social Bond, Expanding Sustainable Investment Reach
-
 Fintech1 day ago
FinTech Matures as AI and Infrastructure Drive the Next Growth Phase
-
 Fintech1 week ago
Withings Achieves Profitability in 2025 with 90% Growth Since 2018