Featured
There Is No Plaza Accord (1985) on the Horizon to Stop USDX
This past week the DJI broke 30,000, gold broke $1,675, oil broke $80 and the US$ Index soared to the highest level since 2002. DJI, gold and oil are all pointed lower irrespective of sudden out of the blue rallies and the US$ Index (USDX) is pointed higher. The rising USDX points to potential sovereign debt problems and shrinking earnings for US corporations highly dependent on their foreign currency earnings.

If in 2019 one had said that the world would be hit with a global pandemic resulting in a sharp slowdown as a result of lockdowns, but that the subsequent unleashing of billions of dollars in QE and fiscal spending along with zero percent (and lower) interest rates would save the world from depression but unleash a massive stock market rally (bubble?) one would have thought you were crazy. Then add in that the pandemic slowdown would unleash supply shocks across the globe resulting in rising inflation and then Russia would invade Ukraine sparking an energy crisis that would help push inflation even higher and threatening a recession (or worse) in Europe and the rest of the world.
Then China instituted severe lockdowns sparking even more supply shocks to already elevating inflation and that all, in turn, would spark central banks to start raising interest rates while at the same time ending QE and starting QT that would all combine to spark a huge sell-off in global stock markets. The resulting dislocations are reeling emerging economies many, particularly in Africa that are facing food shortages threatening hundreds of millions with famine and social unrest. Money, fleeing trouble in Europe, emerging economies, lockdowns in China, and ultra-low interest rates in Japan are running into the U.S. dollar sparking a sharp rise in the US$ Index (USDX) and currency devaluations, a balance of payments crisis, and threatening trillions in U.S. dollar-denominated sovereign and corporate debt in foreign countries that could result in defaults that spark a banking crisis.
Except it wasn’t made up. It has happened. Stock markets have swooned 20% or more wiping out trillions of dollars of wealth. Housing markets are now tipping over as well threatening to wipe out even more trillions of wealth and sparking a potential mortgage crisis.
To no one’s surprise, the Fed hiked 75 bp at the September 21 FOMC. It was a blessing really. Some expected 100 bp. The next day the Bank of England (BOE) along with the central banks of Norway, Switzerland, and South Africa followed. Bizarrely the central bank of Turkey cut interest rates despite 80% inflation. Go figure. For the U.S. that brings the Fed rate to 3.25% except inflation in the U.S. is last running at 8.3%. That’s still a negative 5.05% differential. On the day of the rate hike, the stock market greeted the hike by rallying with the S&P 500 up over 50 points at one point. But then Fed Chair Jerome Powell poured cold water on everyone by following with his we are going to have to have some meaningful pain speech and noting that interest rates are probably going to have stay “higher for longer”. The stock market said oops and the S&P 500 closed-down over 65 points instead.
Friday brought us more grief as a stronger purchasing manager’s report (PMI) spooked the markets into another big drop. No one was spared. Stocks, precious metals, oil even grains, and meats all swooned. Don’t you just love volatility? Oh yes, the VIX Volatility Index soared along with the US$ Index. But the VIX has not made new highs. A divergence? Markets may be oversold but they can become even more oversold. Fears that the Fed is overdoing its inflation fight seem misplaced when the Fed rate is still over 5% below the inflation rate. We are reminded that during the Great Depression the Fed tightened when they should have loosened. But wait. They already did that and that contributed to the stock market and everything else bubble.
The Dow Jones Industrials (DJI) has broken under 30,000 making fresh 52-week lows triggering a potential crash. The Dow Jones Transportations (DJT) also broke down to new lows. No Dow Theory divergence here. The indices are confirming each other in a downtrend. The indices on Friday gapped down. Could this be the start of a runaway move to the downside?
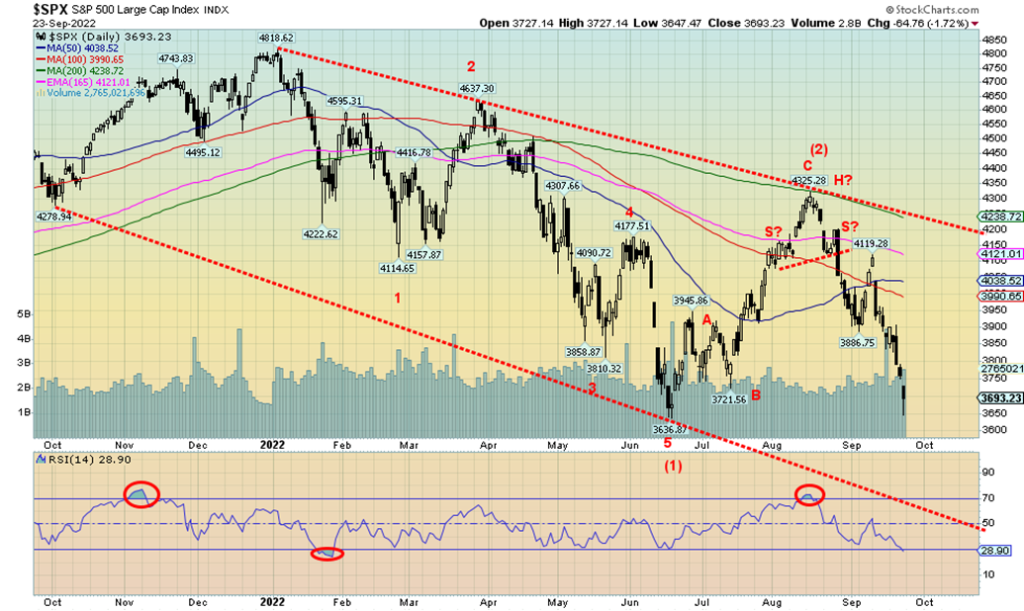
The S&P 500 has now passed the potential point of no return that too will see it break the recent lows of 3,637. Targets could be 2,900 a level last seen in 2020 and the S&P 500 would be down 40%. This is the third wave down and third waves down are always the meanest. We wouldn’t be surprised to see 2,400 a level that would put the S&P 500 down 50% from the January 2022 high. Who knows what all that means for the teetering housing market that is just getting its decline underway.
This bear is now over nine months old and that surprisingly is the about the average length of bear markets. But this one is showing few signs of being your average bear market. The grandaddy of bears the Great Depression bear lasted roughly 3 years 1929-1932. But the 1940-1942, 1968-1970, 1973-1974, 1980-1982, 2000-2002, 2007-2009 lasted roughly 2 years. We have time left. The average bear market is lower because of steep but short-lived bears like the crash of 1987 and the pandemic crash of March 2020.
For the bulls to start to feel some relief the S&P 500 must regain at a minimum back above 3,800 (preferably 3,900) otherwise new lows are highly probable this coming week. The S&P 500 would be joining the DJI and DJT. The NASDAQ is also not far behind. Others have also made new 52-week lows including the MSCI World Index, the S&P 600, the Dow Jones Composite (DJC), the German DAX, the TSX Venture Exchange (CDNX) and Bitcoin.
It took former Fed Chair Paul Volker hiking the Fed Funds rate to about 20% above and beyond the rate of inflation in order to bring inflation in the 1970’s down. It also helped trigger the severe recession of 1980-1982
that lingered beyond that time. The suspicion here is and the fear in the market is that the Fed too will have to hike interest rates above the rate of inflation to wrestle the inflation rate back to low levels. But the market now is fearing the Fed is hiking too much too fast and overdoing its fight against inflation. The question is how much pain is everyone willing to accept? How high will unemployment get despite the still rosy outlook for jobs? 5%, 8%, 10% unemployment? Mild landing? Probably not. Dr. Gloom, Nouriel Roubini says it will be an extremely hard prolonged recession.
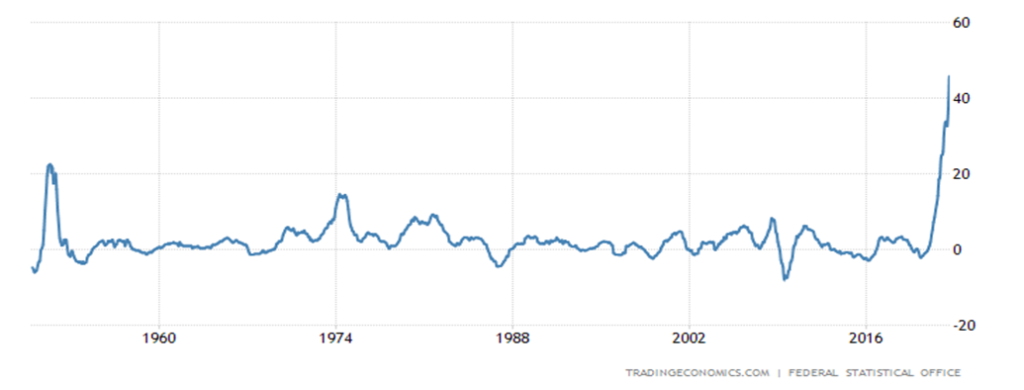
We do point out that the U.S.’s 8.3% inflation seems rather tame compared to some. Turkey is at 80%, Argentina at 78%. The U.K. last reported 9.9% and the Euro area reported 9.1%. Canada reported its inflation last at 7% which was better than expected but with the Bank of Canada (BofC) rate at 3.25% higher rates are still expected. We were surprised to see that while it wasn’t Germany’s inflation rate last at 7.9% that caught our attention it was the producer price index (PPI) inflation last seen at 45.8% in August. Sharply rising energy prices as a result of the war in Ukraine are beginning to bite and German corporations are becoming increasingly concerned. The U.S. PPI was last at 8.7%. With energy prices biting Germany and others in the Eurozone and the U.K., the Eurozone along with the U.K. will be the first to fall into an official recession. Most analysts are now calling for another 50 bp hike at the November and December FOMC. The BofC will most likely be doing the same or higher next at its October 26 meeting.
The Soaring Germany PPI 1949-2022
Despite the soaring US$ Index, gold has continued to hang in thus far refusing to break significantly under that $1,675 critical support zone. However, we have now broken the last 31-month cycle low suggesting to us that we could be in the throes of falling into our major cycle lows of 7.83-years and 23.5-years. Still, Friday’s action saw new lows for gold once again but not for silver or the TSX Gold Index (TGD). The Gold Bugs Index (HUI) did make new 52-week lows Friday. Will the TGD join next week? The HUI is only 40 points away from the March 2020 crash low. Gold continues to outperform stocks as the Dow/Gold ratio is falling in favor of gold over stocks.
The US$ Index is still targeting potentially as high as 115 to 118 and as we have noted it is beginning to bite against U.S. dollar-denominated debt issued by foreign sovereigns. It is also going to play havoc with U.S. corporations’ earnings as they earn a significant portion of their earnings in depreciating foreign currencies
Speaking of depreciating currencies, the shocker on Friday was the pound sterling that reacted negatively to huge tax cuts by the incoming Truss government. As one pundit described it, it’s a sugar rush followed by ballooning debt and spiraling inflation. The Economist described it as reckless – fiscally and politically. Another called Britain an emerging economy. Chancellor of the Exchequer Kwasi Kwarteng quipped “markets will do what they will.” Pound sterling could soon be at par with USD.
Goodbye Pound Sterling?
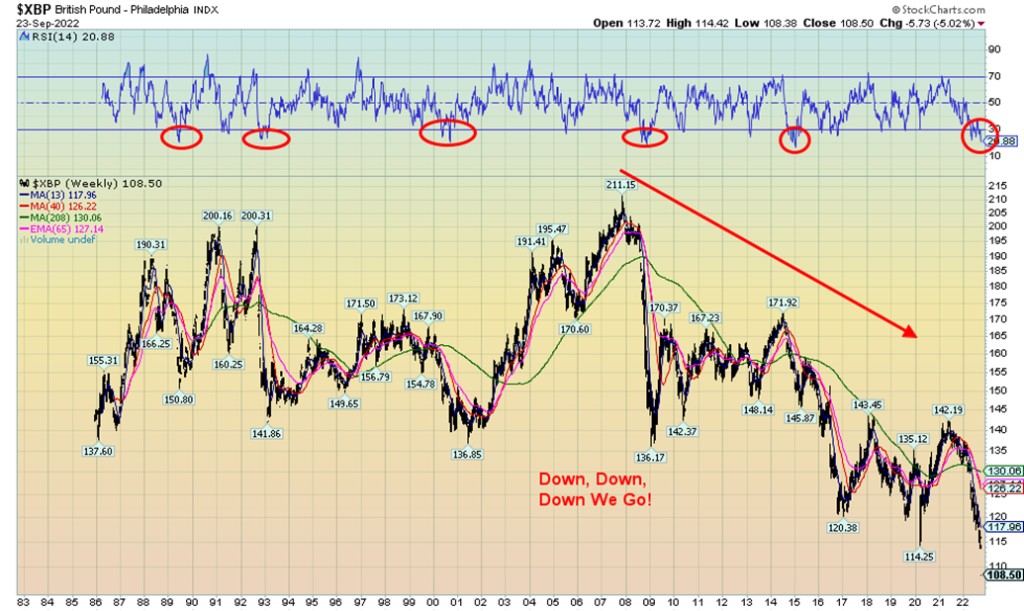
The soaring US$ Index has seen hosts of currencies make fresh 52-week lows against the U.S. dollar – Canadian dollar, pound sterling, euro, Japanese yen. No, they all still have a way to go to make all-time lows. Many emerging market currencies are also making new lows. An exception has been the Russian ruble which continues to defy expectations of sinking into oblivion. There is no sign that a new Plaza Accord (1985) is on the horizon. The 1985 Plaza Accord was designed to bring down the value of the U.S. dollar that was soaring against currencies at the time causing all sorts of dislocations. Japan has stepped in to support the yen. The U.S. has little interest in stopping the dollar’s rise as it helps slow inflation. But it will sap U.S. corporation’s earnings as they earn a significant portion in foreign currencies.
Gold and the US$ Index 2008-2022
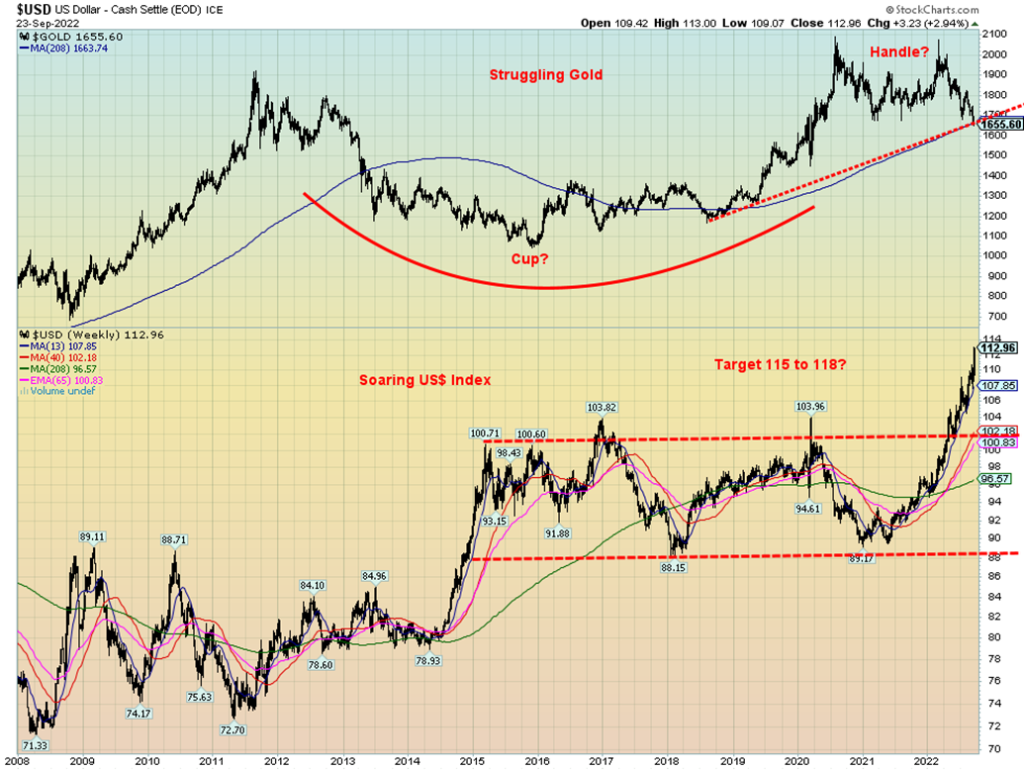
Gold continues to make what could be a large multi-year cup and handle pattern. If we get new highs above $2,089 targets could be up to $2,500 to $3,000. However, until we find a bottom downside risk remains. As we have noted that downside risk could be as steep as a decline to $1,250. The bottom of the bear channel is near $1,575. The decline below $1,675 has thus far remained orderly with little sign of panic. Gold needs to regain back above $1,700 to suggest that a low might be in. Sentiment for gold remains at or near rock bottom. The Gold Miners Bullish Percent Index (BPGDM) has fallen to 6.9 the lowest level seen since 2015 when gold made a major low. That December 2015 low was also the last 7.83-year cycle low. The gold stocks remain cheap, and silver remains cheap vis-à-vis gold. We’ve even seen some gloomy headline forecasts for gold recently something we often see at market bottoms. As well we also note the commercial COTs for both gold and silver continue to be the best we’ve ever seen in favor of a rally.
Note gold is sitting on or slightly below the 4-year MA (represented as 208 weeks) another positive. During the bear years, 2013 to 2019 gold tested the upside of the 4-year MA and it held. Are we now testing the downside of the key long-term MA?
But are we at the bottom? While we are in a potential period for a significant low our final gold low may still be a few months away. In 2015 we saw an important low in July followed by a rally then a decline to the final low in December 2015.
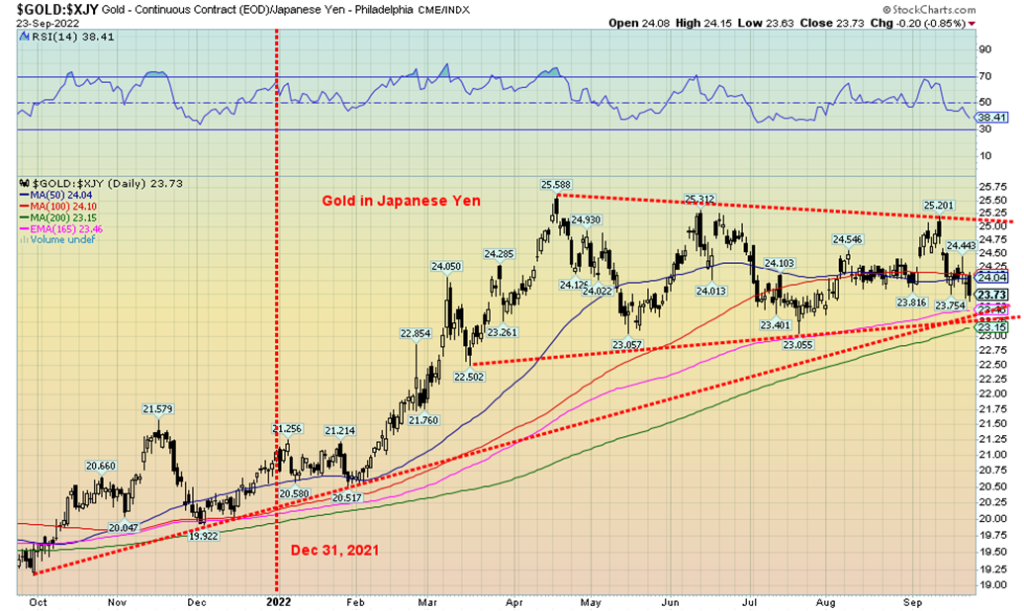
As bad as gold has been in U.S. dollars down about 10% on the year, we note that gold in Canadian dollars is down about 3%, in euros gold is up 6%, gold in pound sterling is up 13% and gold in Japanese yen is also up almost 13%. In other emerging market currencies gold is up even more. Gold has continued to act as an effective hedge against currency devaluation. As we have often noted, gold is money. Note the symmetrical triangle forming on gold in Japanese yen. That appears to us as a potential consolidation pattern which means it should break to the upside.
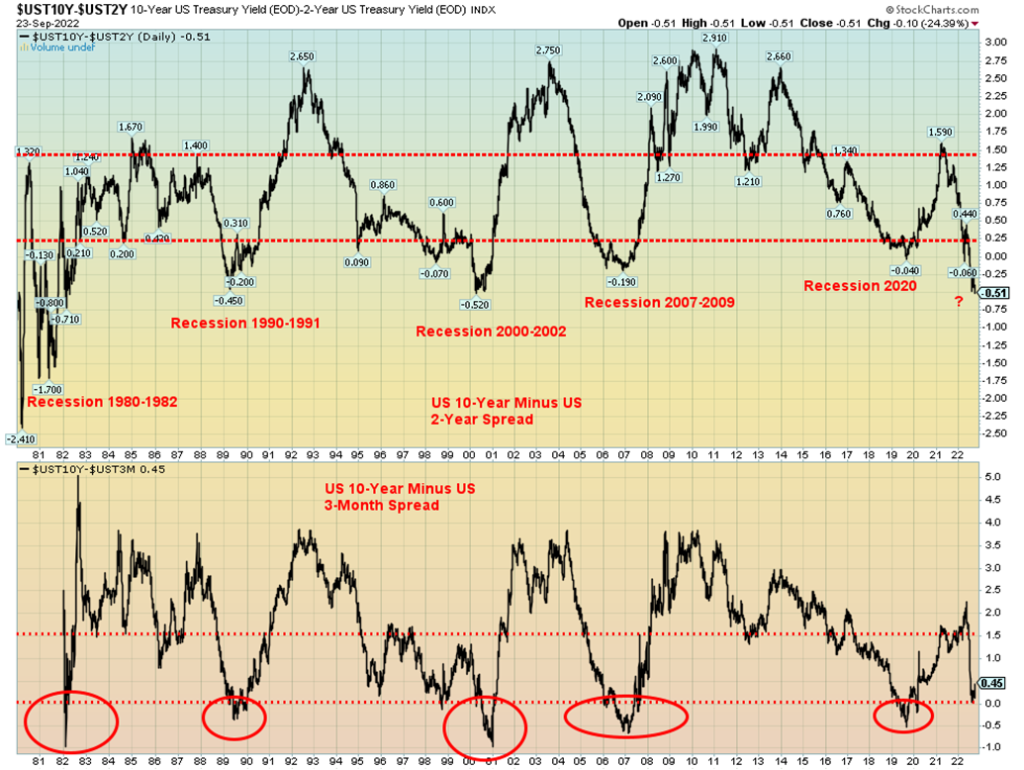
Bond yields have soared. The U.S. 10-year treasury note is up to 3.69% the highest level since 2010. The 2-year treasury note is up to 4.20% the highest level since 2007. That puts the 2-10 spread at negative 51 bp the highest we’ve seen since 1999. Stock markets don’t usually bottom until months after the 2-10 spread bottoms. The lag is at least six months, but it could stretch over a year. Negative spreads continue to point to a recession. Negative spreads have preceded every recession since 1950. Still as the chart below shows the 3-month T-Bill – 10-year T-Note spread has still not turned negative as it has done prior to previous recessions.
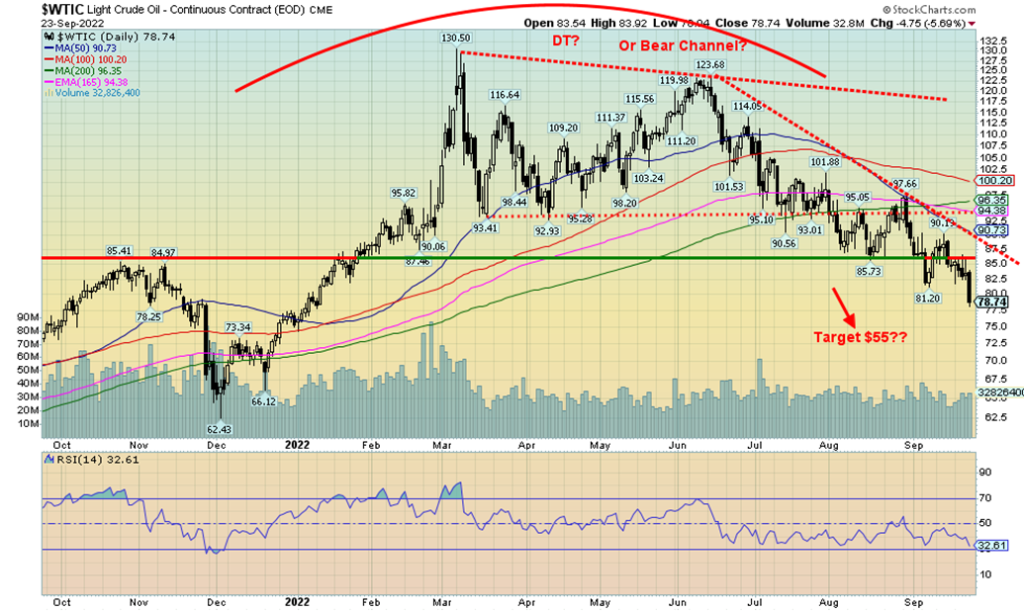
It’s looking more and more like oil put in a double top in March and June. The bear channel that appeared to be forming was destroyed and WTI oil fell through $85 targeting at least $75 and could even fall to $55. WTI oil fell roughly $6 this past week or 7.1% as fear of recession and demand destruction overtook everything else. Natural gas even fell, down 9.9% in North America and even off small in the EU as the fear of Russia cutting off supplies has been offset by word that the EU storage tanks are relatively full. But things could change in that volatile world as Russia potentially ramps up the war and cuts supply further and the lockdowns in China come to an end. We note that Russia has closed off Nord Stream 1 but that the pipeline through Ukraine is still operating. Is it next? But if EU tanks have ramped up, North American reserves are the lowest in some time.
Energy stocks were hammered with the ARCA Oil & Gas Index falling 9.3% and the TSX Energy Index (TEN) dropping 11.2%. They are at their lowest levels in months. All in all, not a good week for the energy market. Should help drivers at the pump though.
The markets and the economy are not in a good place. Things are liable to get worse before they get better. But a short-term bottom could be at hand given the oversold conditions. But rebound rallies could be fast and furious but signifying little.
Markets & Trends
| % Gains (Losses) Trends | ||||||||
| Close Dec 31/21 | Close Sep 23/22 | Week | YTD | Daily (Short Term) | Weekly (Intermediate) | Monthly (Long Term) | ||
| Stock Market Indices | ||||||||
| `S&P 500 | 4,766.18 | 3.693.23 | (4.7)% | (22.5)% | down | down | neutral | |
| Dow Jones Industrials | 36,333.30 | 29,590.41 (new lows) | (4.0)% | (18.6)% | down | down | neutral | |
| Dow Jones Transport | 16,478.26 | 12,129.30(new lows) | (5.4)% | (26.4)% | down | down | neutral | |
| NASDAQ | 15,644.97 | 10,867.93 | (5.1)% | (30.5)% | down | down | neutral | |
| S&P/TSX Composite | 21,222.84 | 18.480.98 | (4.7)% | (12.9)% | down | down | neutral | |
| S&P/TSX Venture (CDNX) | 939.18 | 578.06 (new lows) | (8.3)% | (38.5)% | down | down | down | |
| S&P 600 | 1,401.71 | 1,080.92 (new lows) | (5.6)% | (22.9)% | down | down | neutral | |
| MSCI World Index | 2,354.17 | 1,773.14 (new lows) | (4.1)% | (24.7)% | down | down | down | |
| Bitcoin | 47,907.71 | 18,655.20 (new lows) | (5.1)% | (61.1)% | down | down | down | |
| Gold Mining Stock Indices | ||||||||
| Gold Bugs Index (HUI) | 258.87 | 179.77 (new lows) | (5.8)% | (30.6)% | down | down | down | |
| TSX Gold Index (TGD) | 292.16 | 222.62 | (3.2)% | (23.8)% | down | down | down | |
| % | ||||||||
| U.S. 10-Year Treasury Bond yield | 1.52% | 3.69% (new highs) | 7.0% | 142.8% | ||||
| Cdn. 10-Year Bond CGB yield | 1.43% | 3.08% | (2.2)% | 115.4% | ||||
| Recession Watch Spreads | ||||||||
| U.S. 2-year 10-year Treasury spread | 0.79% | (0.51)% (new lows) | (18.6)% | (164.6)% | ||||
| Cdn 2-year 10-year CGB spread | 0.48% | (0.70)% (new lows) | (6.1)% | (245.8)% | ||||
| Currencies | ||||||||
| US$ Index | 95.59 | 112.96 (new highs) | 2.9% | 18.2% | up | up | up | |
| Canadian $ | .7905 | 0.7348 (new lows) | (2.4)% | (7.1)% | down | down | down | |
| Euro | 113.74 | 96.93 (new lows) | (3.2)% | (14.8)% | down | down | down | |
| Swiss Franc | 109.77 | 101.87 | (1.7)% | (7.2)% | down | down | down | |
| British Pound | 135.45 | 108.50 (new lows) | (5.1)% | (19.9)% | down | down | down | |
| Japanese Yen | 86.85 | 69.77 | (0.3)% | (19.7)% | down | down | down | |
| Precious Metals | ||||||||
| Gold | 1,828.60 | 1,655.60 (new lows) | (1.7)% | (9.5)% | down | down | down (weak) | |
| Silver | 23.35 | 18.91 | (2.4)% | (19.0)% | neutral | down | down | |
| Platinum | 966.20 | 858.70 | (4.7)% | (11.1)% | down | down | down | |
| Base Metals | ||||||||
| Palladium | 1,912.10 | 2,070.50 | (2.0)% | 8.3% | neutral | neutral | neutral | |
| Copper | 4.46 | 3.34 | (5.1% | (25.2)% | down | down | neutral | |
| Energy | ||||||||
| WTI Oil | 75.21 | 78.74 | (7.1)% | 4.7% | down | down | up | |
| Nat Gas | 3.73 | 6.99 | (9.9)% | 87.4% | down | up (weak) | up | |
New highs/lows refer to new 52-week highs/lows and, in some cases, all-time highs.
__
(Featured image by geralt via Pixabay)
This article may include forward-looking statements. These forward-looking statements generally are identified by the words “believe,” “project,” “estimate,” “become,” “plan,” “will,” and similar expressions. These forward-looking statements involve known and unknown risks as well as uncertainties, including those discussed in the following cautionary statements and elsewhere in this article and on this site. Although the Company may believe that its expectations are based on reasonable assumptions, the actual results that the Company may achieve may differ materially from any forward-looking statements, which reflect the opinions of the management of the Company only as of the date hereof. Additionally, please make sure to read these important disclosures.
Copyright David Chapman, 2022
David Chapman is not a registered advisory service and is not an exempt market dealer (EMD) nor a licensed financial advisor. He does not and cannot give individualised market advice. David Chapman has worked in the financial industry for over 40 years including large financial corporations, banks, and investment dealers. The information in this newsletter is intended only for informational and educational purposes. It should not be construed as an offer, a solicitation of an offer or sale of any security. Every effort is made to provide accurate and complete information. However, we cannot guarantee that there will be no errors. We make no claims, promises or guarantees about the accuracy, completeness, or adequacy of the contents of this commentary and expressly disclaim liability for errors and omissions in the contents of this commentary. David Chapman will always use his best efforts to ensure the accuracy and timeliness of all information. The reader assumes all risk when trading in securities and David Chapman advises consulting a licensed professional financial advisor or portfolio manager such as Enriched Investing Incorporated before proceeding with any trade or idea presented in this newsletter. David Chapman may own shares in companies mentioned in this newsletter. Before making an investment, prospective investors should review each security’s offering documents which summarize the objectives, fees, expenses and associated risks. David Chapman shares his ideas and opinions for informational and educational purposes only and expects the reader to perform due diligence before considering a position in any security. That includes consulting with your own licensed professional financial advisor such as Enriched Investing Incorporated. Performance is not guaranteed, values change frequently, and past performance may not be repeated.


Bitcoin Rally Faces Tests from Fed, ETFs, and Market Fear
Bitcoin rebounds above $64,000 after a short squeeze and whale accumulation, but remains far below its record high amid cautious...


Italy’s Startup Ecosystem Shrinks but Becomes More Digital and Specialized
Italy’s innovative startup ecosystem shrank in 2025 to 11,820 companies, down 19% from its 2021 peak. The sector is increasingly...


Robinhood Chain Surges with Rapid Adoption and Billion-Dollar Trading Volume
Robinhood’s new blockchain, launched July 1, is rapidly gaining traction, nearing $1 billion in daily volume. Built on Ethereum via...


Morocco Cuts Card Fees to Spur Digital Payments, but Uncertainty Remains
From October 1st, Morocco will cut card interchange fees to 0.50% and 0.15% for small merchants and public services to...


Germany Tightens Cannabis Reimbursement Rules: Approved Medicines Must Come First
Germany’s Parliament passed the Statutory Health Insurance Contribution Rate Stabilization Act on July 10th, 2026, changing cannabis reimbursement rules. Around...
 |
|
 |  |
 |
|
-

 Cannabis1 week ago
Uruguay and Brazil Deepen Medical Cannabis Cooperation
-
 Impact Investing15 hours ago
Italy’s Startup Ecosystem Shrinks but Becomes More Digital and Specialized
-

 Crypto1 week ago
Crypto Platforms Expand Stock Perpetual Trading
-

 Impact Investing2 weeks ago
Italy Approves First Hydrogen-Powered Train for National Rail Network