Featured
How to analyze Google stock using only one tool
GOOG stock is steps away from hitting the thousand-dollar marker.

Analyzing GOOG stock using technical analysis has been an easy endeavor because a simple tool has defined the entire bull market in this investment.
GOOGL stock: Keeping it simple
I have seldom come across a stock pattern that is as beautiful and exquisite as the one that is found on the Alphabet Inc (NASDAQ:GOOG) stock chart. Since inception, Google stock has only traveled in one direction. As traditional fundamental analysts pour over the company’s financials and management’s statements in order to get a grip on what the future may bring, all I need is a quick glance at the GOOG stock chart to determine whether the future of this company will continue to be bright, or if there will be bumps in the road.
I am finding it easier to give my opinion on this investment and being correct versus trying to justify how analyzing a price chart can actually produce positive results. The method of investment analysis I employ is known as technical analysis and it is responsible for all the great calls I have made this fiscal year. This method of analysis uses historical price and volume date in order to project the future direction of price. Technical analysis is open to interpretation and I have spent nearly two decades indulging myself in this craft. I’m sure that many of my followers can attest to the value this method of analysis can provide.
Analyzing GOOG stock using technical analysis has been quite an easy endeavor because a simple technical tool has defined the entire bull market in this investment. This simple tool is illustrated on the following Alphabet stock chart.
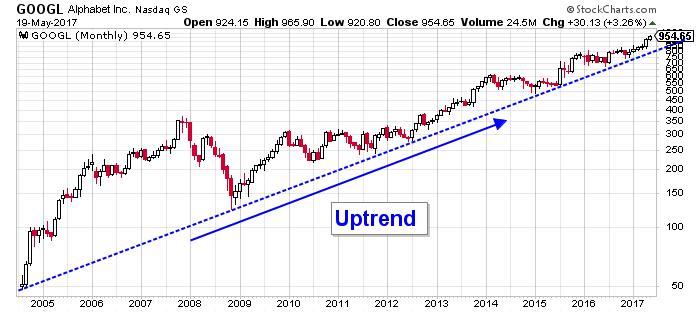
Chart courtesy of StockCharts.com
The price chart illustrates that a simple trend line has defined the entire bull market that began when GOOG stock first started trading in 2004. This simple trend line is created by connecting the dips on the price chart, and it serves to create an ever so effective plane that cannot be dismissed as anything but significant. This plane captures the quintessential characteristic that defines all bullish investments: a series of higher highs and higher lows.
This significant trend line that defines the bullish run towards higher prices is really the only indication I need to base a bullish or bearish view on GOOG stock. For anyone who has frequented my previous publications, they must be used to a multitude of charts and indications that support my view that an investment is either set to advance or set to decline, but this is not the case for Alphabet stock. This trend line, which has been in development for over a decade, is acting as the dividing line between Google stock being in a bull market, justifying higher prices, and GOOG stock being in a bear market, justifying lower prices.
I have to admit that very few stocks fit into such a category, where a single standing indicator acts as the tell-all, but this is what makes Google stock such a special investment. I believe that this trend line is so influential that it is also the crutch that the entire market is standing on. So that being said, if Google shares ever suffered the fate of falling below this trend line, I could only assume that the bull market that has been in development since 2004 has finally concluded and that a larger correction is set to ensue.
Given the weight I am placing on this simple trend line and its ability to influence the entire market, I will also have to assume that a bear market has gripped the entire market. Such an event has not occurred as of yet, but given the weight that Google holds in the Nasdaq index and its influence on the tech sector as a whole, I feel confident in making such an assumption.
Classifying a simple trend line as the dividing line for the entire equity market was not an easy statement to make, considering that I usually stress that a multitude of indicators is required to justify an investment view. But considering that this is Google, I am willing to make an exception. With that in mind, I can only assume that the bull market in Google stock is still intact. Higher prices are likely to continue, and with this trend, the equity markets will continue to chug along.
Google stock is only steps away from hitting the thousand-dollar marker, and I don’t think there is anything that will stop this investment from achieving this milestone. Hitting this milestone should also propel the tech-heavy Nasdaq index to new highs.
Bottom line on Google Stock
I am bullish on Alphabet stock and believe that a higher stock price is very much likely. My bullish view is predicated upon a simple trend line that began in 2004 when Google stock first began trading in the open market. This trend line is so influential that not only does GOOG stock hang in the balance, but the entire stock market as a whole.
—
DISCLAIMER: This article expresses my own ideas and opinions. Any information I have shared are from sources that I believe to be reliable and accurate. I did not receive any financial compensation in writing this post, nor do I own any shares in any company I’ve mentioned. I encourage any reader to do their own diligent research first before making any investment decisions.


Gilead HSV Plan Could Transform Market Outlook
Gilead’s upcoming development plan for Assembly Biosciences’ HSV drugs could reshape the herpes market. ABI-5366 and ABI-1179 have shown strong...


Talentir Secures €4M to Transform Global Payouts
Talentir, an Austrian-Swiss fintech, raised €4 million led by Redstone to scale its AI-powered payout platform. Using stablecoin infrastructure, it...


Coastal Cities Lead as Heat Strains Italy’s Urban Livability
Italy’s 2026 Climate Livability Index shows coastal cities, led by Ancona, outperform inland areas as global warming intensifies. Adriatic locations...


Bank of Africa Expands Sino-African Trade Partnerships in Beijing
Bank of Africa strengthened Sino-African ties by signing partnerships in Beijing with CIEC Group and CCCME to boost trade, investment,...


Commodity Markets Pause as Oil Falls, Metals Correct, and Grains Show Mixed Signals
Commodity markets in Africa saw mixed movements during June 15-19, 2026, with oil declining sharply, precious metals correcting, and grains...
 |
|
 |  |
 |
|
-

 Impact Investing2 weeks ago
EU Approves €23B Italian Renewable Energy Plan to Boost Climate Goals
-

 Business3 days ago
Markets Diverge as Oil Falls, Rates Hold, and Inflation Persists
-

 Biotech1 week ago
Advances in Biomarkers and Targeted Therapies Transform Kidney Care in Autoimmune Disease
-
 Impact Investing13 hours ago
Coastal Cities Lead as Heat Strains Italy’s Urban Livability
You must be logged in to post a comment Login