Featured
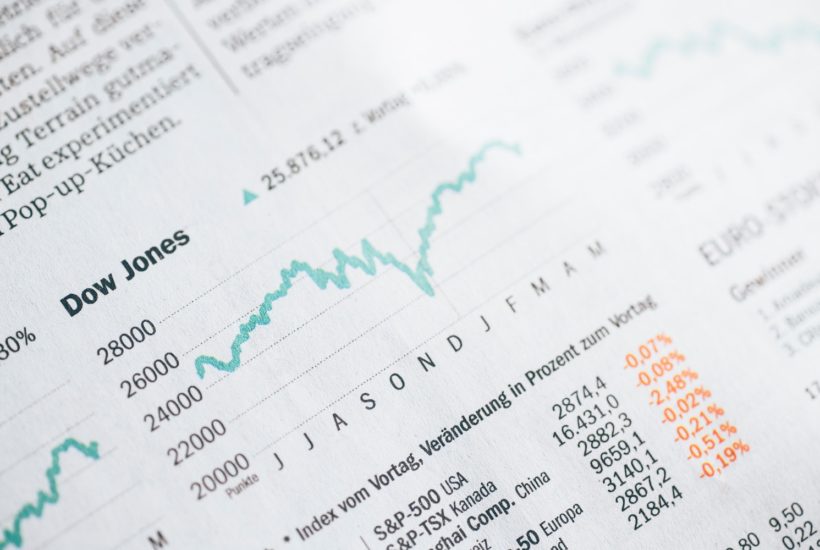
Are we about to sleepwalk into another market crash?
Is the market really going to continue to grow to unprecedented heights? Or is the house of cards about to collapse? Arguments are there for both. The average boom lasts twenty years and we’re just ten years in so history dictates a bright decade ahead. Yet there are warning signs that we might just be in for a surprise bust that catches the global community off guard.
Some calamities – the 1929 stock market crash, Pearl Harbor, 9/11 – have come like summer lightning, as bolts from the blue. The looming crisis of America’s Ponzi entitlement structure is different. Driven by the demographics of an aging population, its causes, timing and scope are known.
George Will, American conservative political commentator, The Washington Post, NBC News, MSNBC; b. 1941
After 1929, so many people had been traumatized by the stock market crash that there was a lost generation.
Ron Chernow, American writer, journalist, historian, biographer; b. 1949
If stock market experts were so expert, they would be buying stock, not selling advice.
Norman Ralph Augustine, businessman, Under Secretary of the Army 1975–1977, Chairman & CEO Lockheed Martin; b. 1935
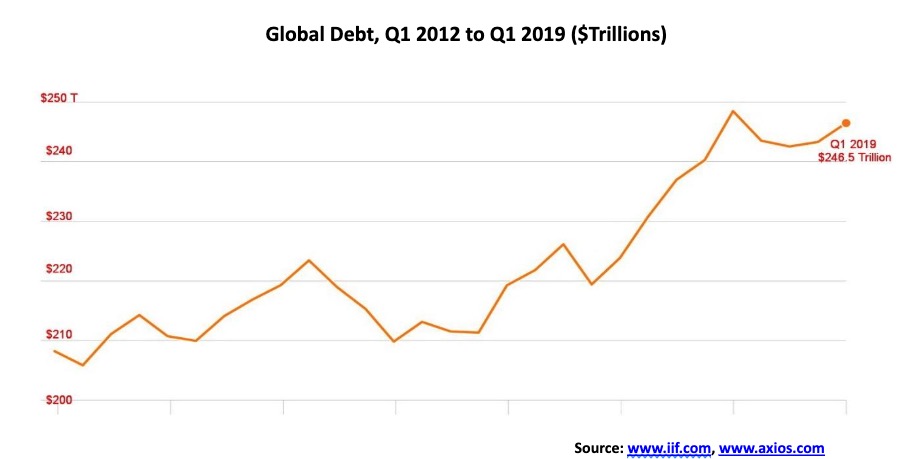
Market bubbles and financial crises seem to go hand in hand. Show us a bubble (stocks, commodities, etc.) and a financial crisis is sure to follow. In other words—been there, done that. Except it seems to occur over and over again and, as Carmen M. Reinhart and Kenneth S. Rogoff demonstrated in their book This Time is Different, Eight Centuries of Financial Folly, the only thing that is different is the circumstances. At the heart of it is excessive debt accumulation, whether it is by government, banks, corporations, or consumers. Since the 2008 financial crisis, global debt is estimated to have increased by at least $100 trillion and now stands at least around $250 trillion.
Since 1800 there have been five booms and each one was followed by a bust. We are in the midst of the sixth boom. Our summary is as follows:
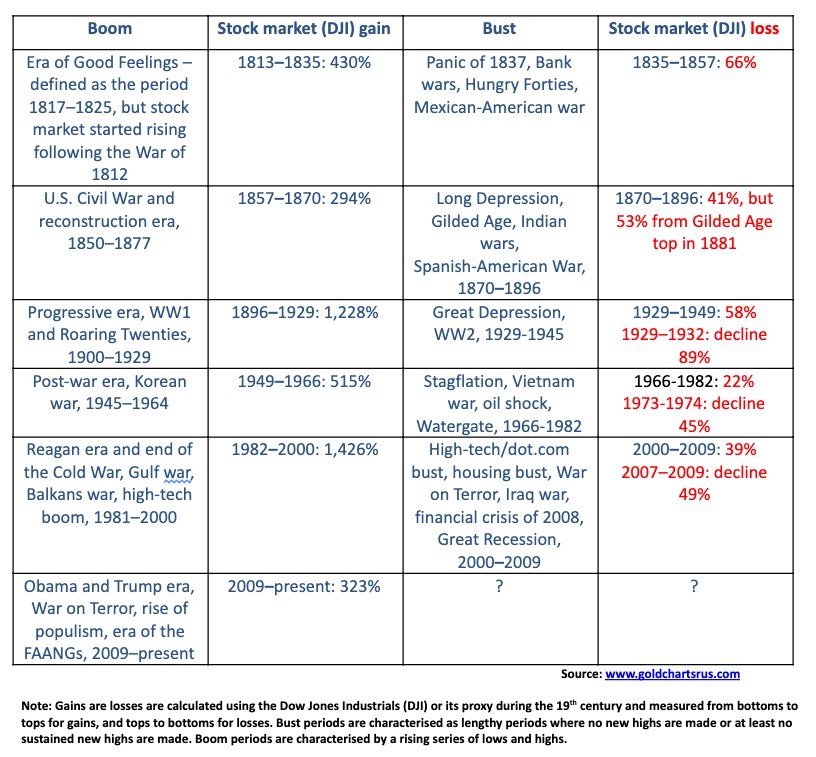
In many respects this particular boom hasn’t been that long, only 10 years. Previous boom periods lasted on average 20 years. By that measurement we may be only half-way through this one. Even during previous boom periods there were periods of corrections and recessions. The post-war boom 1949–1966 saw three recessions: 1953, 1958, and 1960–1961. However, the Reagan era, high-tech boom saw only one recession: 1990–1991.
Since 2009 we have had three corrective periods ranging from 15% to 20%: 2011, 2015–2016, and 2018, but no recessions but periods of reduced growth. Today, many are predicting that the next recession is just around the corner. During previous boom periods it was not unusual to have not only a stock market correction but a short recessionary period. However, each time the stock market did not make new major lows and eventually it returned to the upside. Busts averaged about 19 years even as the most recent one lasted only 9 years.
The current market is making new all-time highs following the corrective period that generally lasted from January 2018 to December 2018. However, it has not convincingly broken through to consider it a new up-leg until all markets are joining the S&P 500, Dow Jones Industrials (DJI), and NASDAQ in making new all-time highs.
That the markets are rising despite all the background noise of the impeachment crisis, a decade-long expansion that is long in the tooth, pervasive signs of a potential global slowdown, global unrest manifesting itself in violent street protests or separation movements (France, Hong Kong, Chile, Bolivia, Ecuador, Haiti, Iraq, Ethiopia, Honduras, Spain (Catalonia), Britain (Brexit), Lebanon, Algeria, Kazakhstan, Pakistan, U.S., and, yes, even Canada), and, of course, the never-ending trade wars triggered by the U.S.
There is also far too much debt. Student debt in the U.S. totals $1.6 trillion and delinquencies are rising because the students (millennials) cannot get good enough jobs to service them. Sub-prime auto loans are becoming a problem as defaults and delinquencies rise. There is an estimated $1.2 trillion of auto loans outstanding in the U.S. Some 7 million Americans are at least 3 months behind in their payments according to the Federal Reserve of New York. Overall, however, the delinquency rate is not as high as it was in 2010. Households and non-profit organizations hold a record $4.1 trillion of debt. But household debt to GDP is down to about 76% from a high of 100% seen in 2009. In Canada, it is another story as household debt to GDP is 101% of GDP, higher today than where the U.S. was in 2009.
Then there is the $17 trillion of negative interest rate debt. This debt is highly vulnerable to rising interest rates even as interest rates have been lowered to levels never before recorded. Of that debt $12.5 trillion is sovereign debt. China, despite its relatively robust 6% GDP growth, has seen its rate of growth declining now for 9 years. China is also buried in debt with an official debt level of non-performing loans of ¥2.2 trillion ($310 billion); however, the real level of delinquency is estimated at ¥9.3 trillion ($1.3 trillion). The problems are in what is known as China’s “Shadow Banking System.”
There are other looming problems. Global warming that is manifesting itself in record floods, wildfires, droughts, extremes in weather including both hurricanes and huge snow storms and bitter cold spells. Global warming is causing not only billions of dollars of damage but it is dislocating people. While the wealthy survive because of good insurance, many more have become permanently homeless or will be forced to move. Coastal cities are slowly sinking into the ocean as witnessed by Indonesia having to move its capital from Jakarta that is slowly being taken over by the ocean. However, Jakarta is not the only major city facing problems from rising oceans.
Insurers are raising the cost of insurance to prohibitive prices or are not offering it all. Corporations and financial institutions are becoming increasingly wary of global warming and taking it seriously to protect themselves from potential litigation. PG&E of California became the largest corporate casualty of global warming. Our oceans are buried in plastic and parts of India are buried in smog. As far as pollution and global warming are concerned, the worst and the costliest may be yet to come.
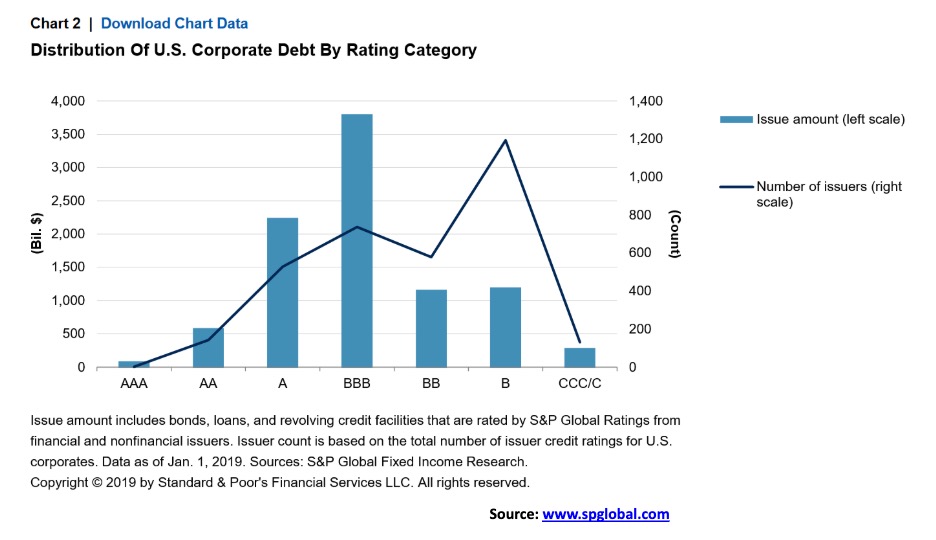
Despite all this, there are few strong signs of a recession, and corporate earnings remain relatively robust. However, industrial production has been weak, and retail sales are generally running below the rate of real inflation. Not quite the picture of sustainable growth the Fed likes to portray. The real danger lies in an unexpected event such as a large and sudden bankruptcy. Non-financial corporate debt in the U.S. is estimated at $15.5 trillion or 74% of GDP. Of that, a total of some $10 trillion belongs to large companies.
Of the large companies some 72% of the debt is investment grade rated BBB or higher. But of that some $3.8 trillion is rated BBB. Any downturn in the economy or sharp rise in interest rates could see some of this debt downgraded to non-investment grade. That in turn could spark a sell-off from funds that cannot hold non-investment grade debt. There is also concern that corporations do not have sufficient cash to cover debt in the event of a downgrade or a problem.
Many believe the high-yield sector is overvalued. The question is: what kind of spark could trigger an avalanche of defaults or downgrades and a selling panic? Spreads between government debt and junk bonds have widened, albeit very slowly, and nowhere near the levels seen in 2008. The slide from investment grade to junk bonds is one thing that makes markets nervous. However, the good news is Wall Street, for the most part, believes the corporate debt situation is manageable—at least for the next year or two. If there are any corporate debt bombs, they lie outside the U.S., particularly the real estate market in China. Still, if the corporate debt market did burst it would be a classic liquidity trap—meaning there are lots of sellers but no buyers at almost any price. This is effectively what happened at the height of the 2008 financial crisis.
If, today, there seems to be a worry, it is Deutsche Bank (DB-NYSE) and the European banking market. We have noted that the trouble at Deutsche Bank could be behind the Fed’s repo program of providing liquidity to the market (which we and others have named QE4). It is no secret that Deutsche Bank is bleeding cash and they have been laying off thousands of workers (18,000 in the past year). But will Deutsche Bank collapse? Deutsche Bank is often compared with Lehman Brothers that was at the heart of the 2008 financial collapse. Our chart of Deutsche Bank and Lehman Brothers is show below. The key similarity is they both plummeted during the 2008 financial crash. Deutsche Bank, however, is still operating, unlike Lehman Brothers.
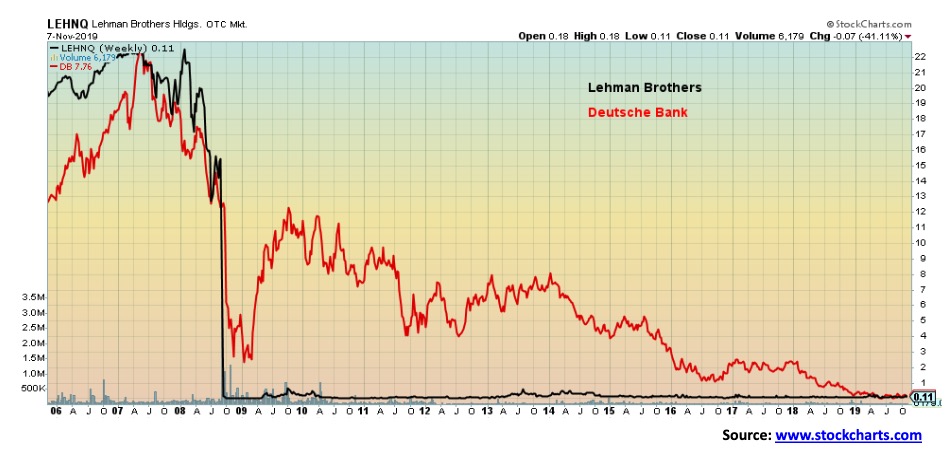
Deutsche Bank is losing money. In Q3 2019, they reported a loss of €832 million ($924 million). In Q2, the loss was €3.15 billion. Deutsche Bank’s shares have taken a pounding. But, despite the pounding, Deutsche Bank is higher today ($7.63) than it was in August 2019 (low $6.44). If Deutsche Bank does collapse it would make Lehman Brothers look small by comparison. This is a €1.345 trillion company by assets but they only have a market cap of €14.3 billion. Their derivatives portfolio is estimated at around $49 trillion but the actual exposure is closer to $1.2 trillion. Deutsche Bank pegs its exposure at $22.3 billion (€20.2 billion), but, as one can see, that’s more than enough to wipe out their market cap and their equity. Strangely enough, Deutsche Bank is still paying a dividend quoted as €0.11/annually for a yield of 1.6%.
Will Deutsche Bank go under? There certainly have been a lot of stories that they will, including some suggesting they are applying for bankruptcy. But the problems at Deutsche Bank have been known for some time and it is not in anyone’s interest to allow them to collapse. A controlled collapse maybe. Certainly, a collapse of Deutsche Bank would be catastrophic for the market, especially given the shaky EU banking system. It could, however, have a domino effect, including negatively impacting North American banks, particularly in the U.S. It would, in that sense, be a global financial disaster on a scale not seen since the Great Depression.
But will the authorities allow it? The Fed’s repo program is already combatting what many perceive as a liquidity problem in the markets. QE is in full force in the EU. The stock markets are setting new record highs spurred on by the Fed’s QE program and a potential truce in the trade wars. But, as you may recall, the Fed started liquidity injections in August 2007 as the Bear Stearns hedge funds were going under because of the start of the collapse in the sub-prime mortgage market. The market topped out in October 2007. Will history repeat itself?
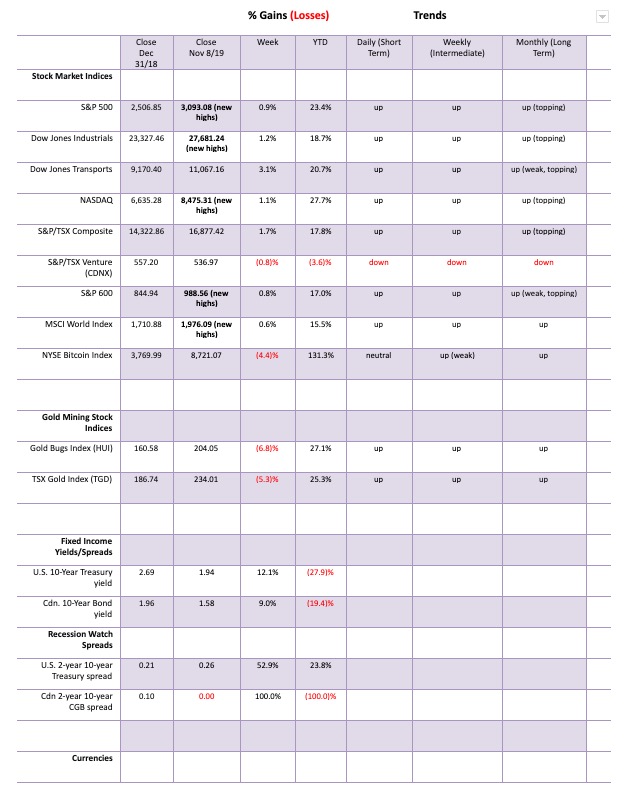
Spurred on by positive trade talks between China and the U.S., the equity indices soared to new highs this past week. Well, some of them at least, but not all of them. The S&P 500 made new all-time highs this past week with a gain on the week of 0.9%. The Dow Jones Industrials (DJI) also made new all-time highs gaining 1.2% on the week. The NASDAQ joined the party with a gain of 1.1%. However, the Dow Jones Transportations (DJT) continues to lag well off its all-time high even as it gained 3.1% on the week. The small cap S&P 600 also made a new 52-week highs gaining 0.8% (Note: we have switched to following the S&P 600 for small caps as, for whatever reason, StockCharts does not appear to be providing the Russell 1000, 2000, and 3000 any longer). The S&P 600 remains well short of its all-time highs.
Others did join the all-time highs party as follows: Dow Jones Composite (DJC), NASDAQ 100, the S&P 100 (OEX) and surprisingly the very broad based Wilshire 5000. Small caps and mid-caps did not follow as the AMEX and the S&P 400 failed to make new all-time highs. The NYSE and Value Line Index (VLE) are also short of their all-time high, although both made new 52-week highs. Failing is the Dow Jones Utilities (DJU) down 0.4% on the week and now off 5.5% from its all-time high. That is interesting as the DJU had been leading the way up. Could it now be signaling that it is the leading the market for a trend change to down from up?
In overseas action, the MSCI World Index made new 52-week highs, gaining 0.6% on the week, the London FTSE was up 1.0% but well short of new all-time highs, the Paris CAC 40 made new all-time highs, gaining 2.2%, while the German DAX is just short of its all-time high, gaining 2.1%. In Asia, China’s Shanghai Index (SSEC) gained 0.2% and Japan’s Tokyo Nikkei Dow (TKN) was up 2.0%. Neither are anywhere near their all-time highs. Hong Kong’s beleaguered Hang Seng Index gained 2% on the week. Unrest? What unrest?
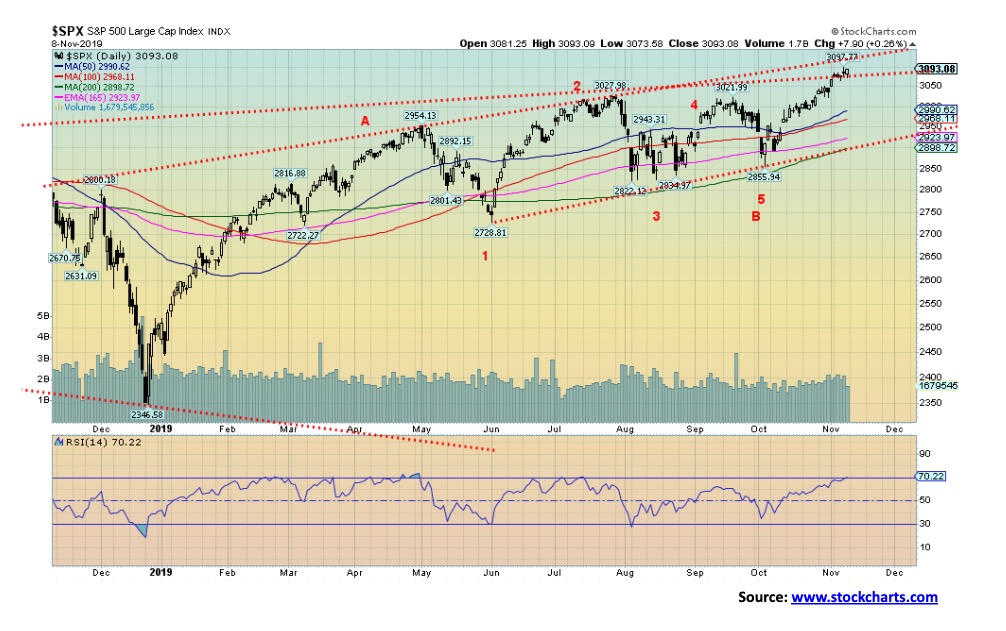
So, is this it? The S&P 500 is preparing for a bull run and about to bust out? While the S&P 500 did appear to break out over the broadening channel, we are not yet at a point where we can declare that the markets are about to take off on a blow-off run. We’d feel more comfortable if the index breaks out over 3,150. We are not far from that level, but above that level it would act as a confirmation. An overthrow in a bull market is not unusual. While the market responded positively to warming relations between China and the U.S. on the trade front, President Trump was walking things back at the end of the week. That could cause the markets to falter. Our first sign of trouble would be a break below 3,025. Under 2,990 could spark a decline to 2,970. Below 2,900 a bear market is possible and below 2,800 a bear market would be official.
So here we sit. High enough to encourage the bulls but at a level where it is make or break. We either continue higher from here or we falter and potentially fail. The November/December period is usually quite bullish as they are the two best months of the year. That didn’t work well last year as the market faltered after making new all-time highs in October, then failed in November and plummeted into December. Then again, as we have often pointed out, President Trump wants a rising stock market to help his re-election chances. And delivering a trade deal between China and the U.S. would be his crowning glory. He does, however, still have a year so he can still encourage then discourage any trade deal for awhile yet. And that in turn can make for a volatile stock market.
Note the RSI for the S&P 500 is now up to 70, approaching overbought territory. However, there are no divergences with the indicator as both the index and the indicator are making new highs together. Markets can remain in overbought (or oversold) conditions for some time. It is a warning, not necessarily a top (or bottom when under 30).
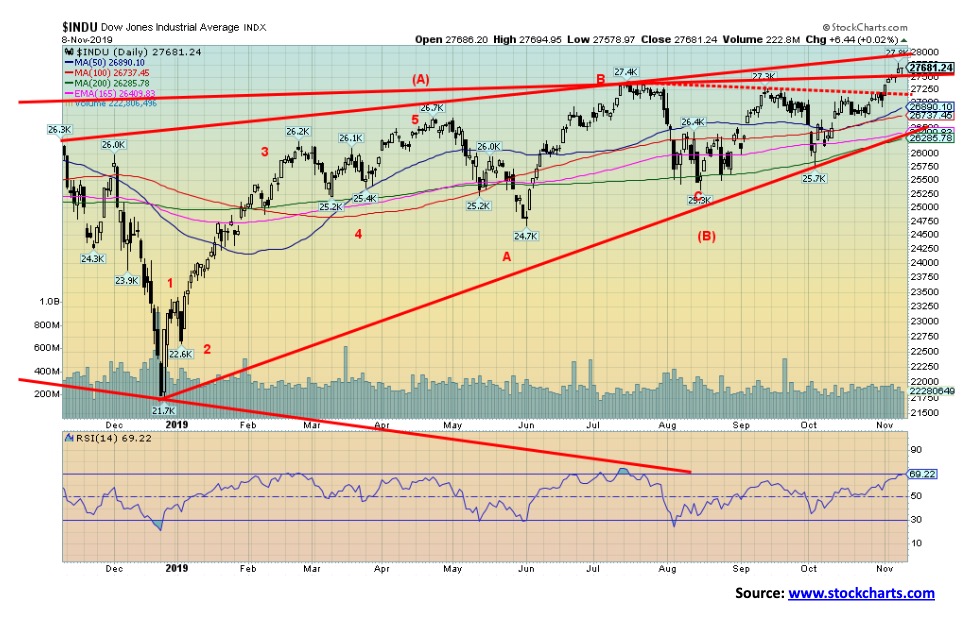
Like the S&P 500, the DJI is breaking out over its broadening channel, making new all-time highs. However, there is resistance just above from another channel line. A breakout over 28,000 would go a long way to confirm the breakout and a potential new up-leg for the market. A return and break under 27,200 would be short-term negative. The DJI breaks down under 26,400 and, below 26,200, could enter a bear market. Our broadening channel scenario that we have noted for some time is not dead but it is being challenged. However, a confirmed breakout to a blow-off top is not a sure thing either. Not yet, anyway.
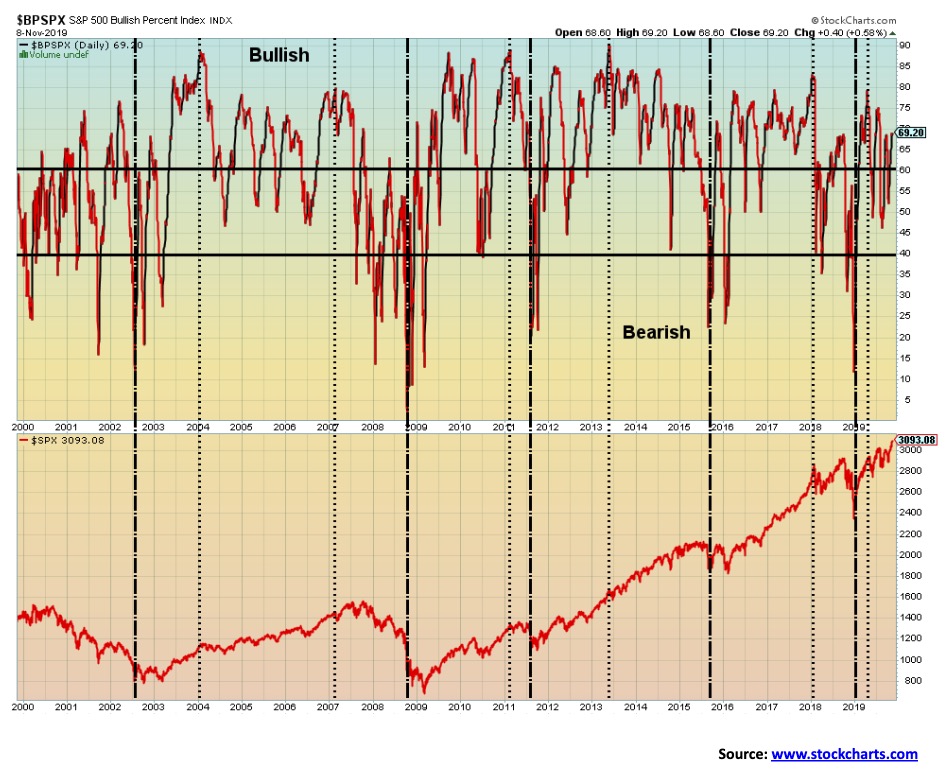
The S&P 500 Bullish Percent Index (BPSPX) is a breadth indicator that measures bullish and bearish sentiment in the markets. Right now, the index is firmly entrenched in bullish territory. However, the index is diverging with an earlier high. That’s not necessarily a good sign as it may be indicating that the market is approaching a top. Something to consider as the market moves higher. Given the high number of stocks contained in the NYSE, this index would never reach 100% or 0%, unlike the gold bullish percent indicator that has far fewer stocks. However, readings over 70% are considered bear alert territory. The index closed at 69.2% on Friday; however, it hit a high of 79 back in April 2019. Each subsequent high has been lower even as the index made a higher high. This is a divergence between the indicator and the index and, again, is often a warning of a potential change in direction.
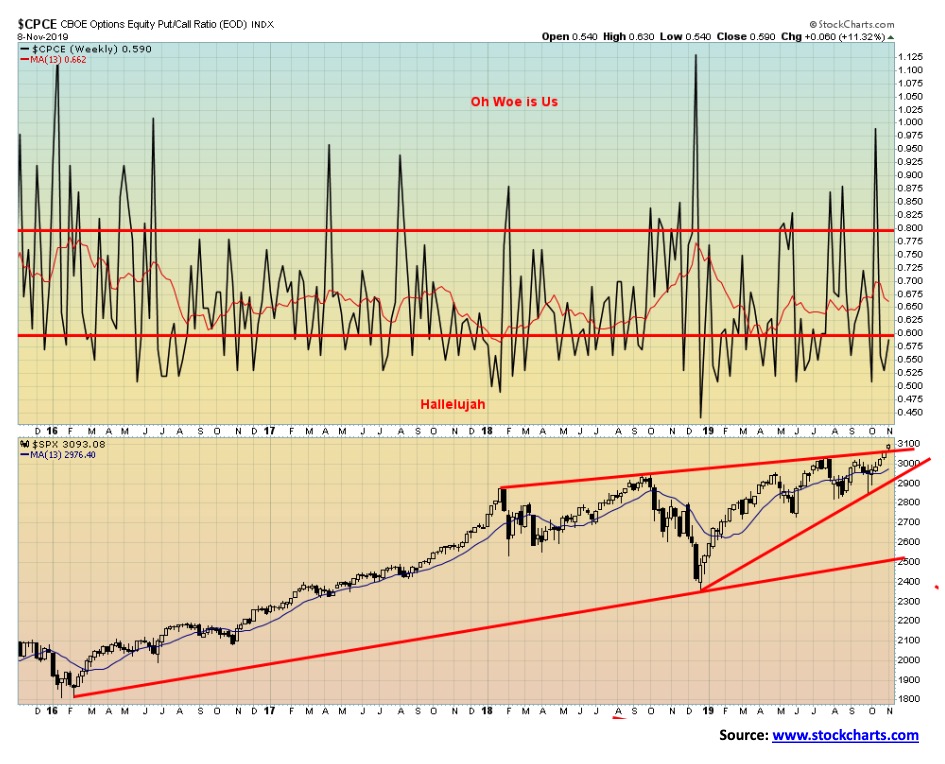
The put/call ratio is a barometer of market sentiment. When the ratio is high—meaning there are more puts than calls—the market is usually considered too fearful (we have labeled it “oh, woe is us”). But if there are more calls outstanding than puts, then the market could be greedy (labeled here as “hallelujah”). Right now, the market is in hallelujah mode. The stock market is rising and traders think it is going to go even higher. That is not necessarily a good sign as they are often wrong at tops and bottoms. So, this is something to consider as the market moves higher.
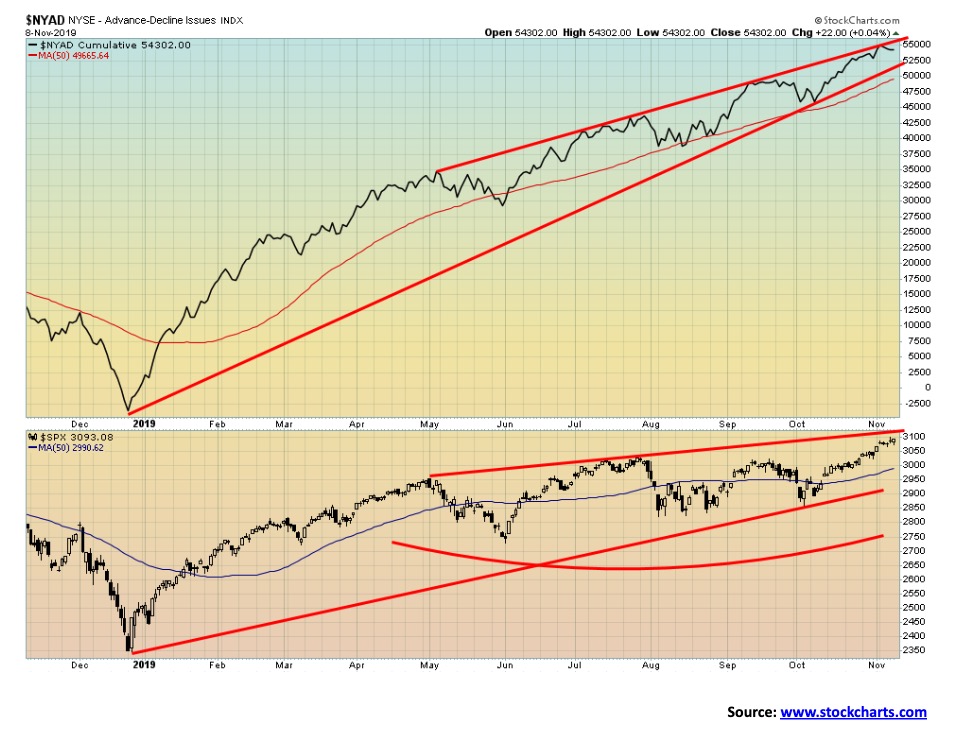
The NYSE advance–decline line has been a source of wonderment for stock market bulls. It has been rising steadily since the low seen last December, usually making new highs well in advance of the stock market making new highs. The AD line is still rising, although it slowed a bit this past week even as the stock market made new all-time highs. The AD line also appears to have hit the top of a channel. A faltering AD line as the S&P 500 moves higher would not be a positive sign and could signal an impending top.
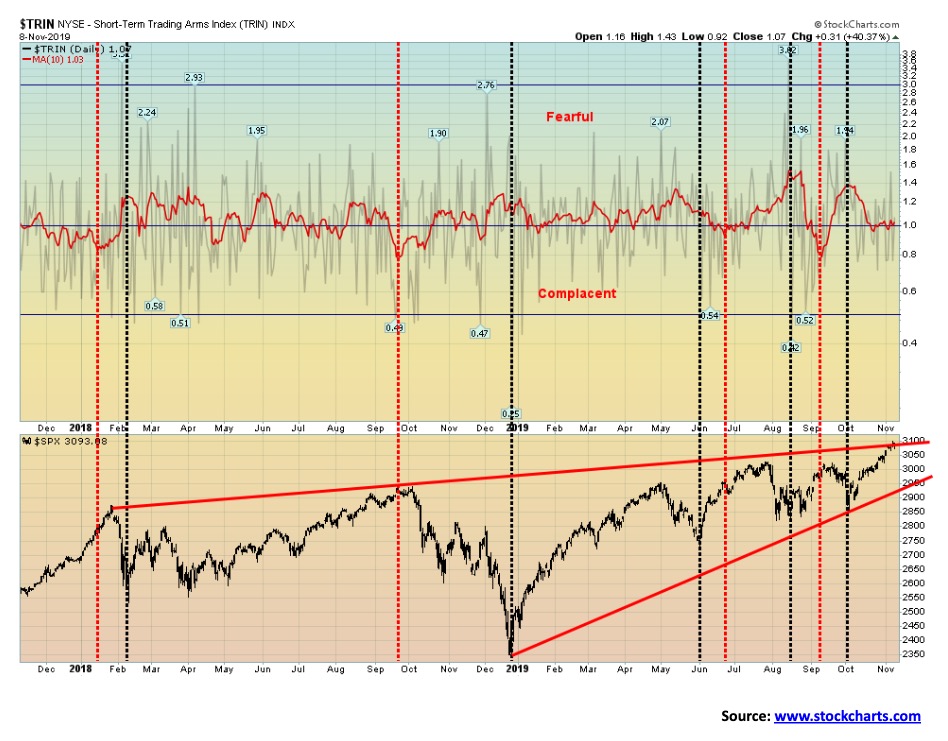
Our TRIN index continues to hover along the divide between fearful and complacent. The TRIN compares the number of advancing and declining stocks (AD ratio) to advancing and declining volume (AD volume). It is a gauge of overall market sentiment. Under 1 is considered complacent and the market is potentially getting too high. Over 1 indicates the market is fearful and potentially is getting too low. With the S&P 500 trading at or near the top of its broadening channel it is surprising to see the TRIN at +1, just inside fearful territory. Fear and greed drive markets. So, with the market rising, is it fear of missing out on the rise?
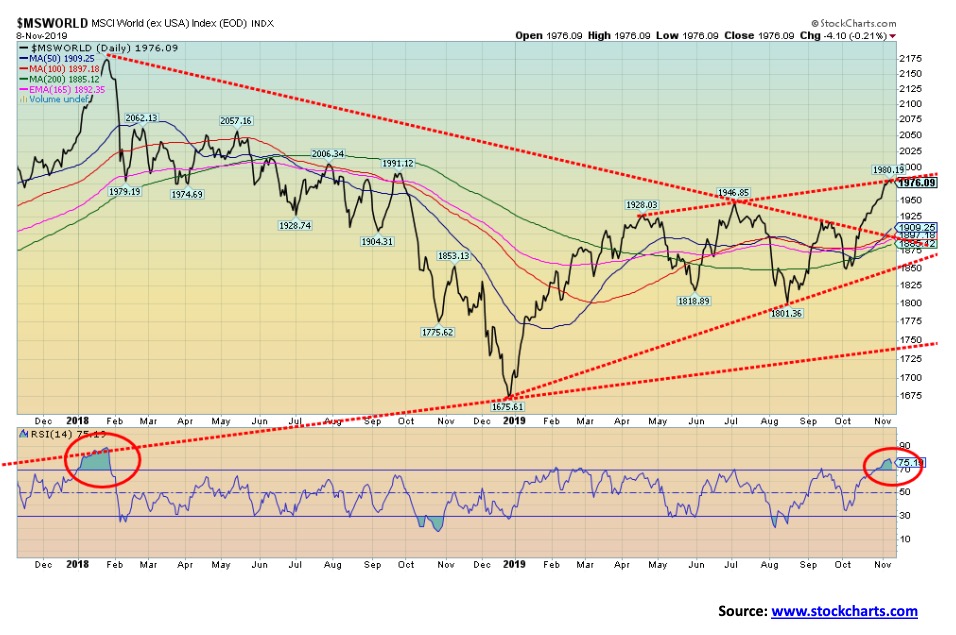
The MSCI World Index (ex U.S.) has reached what appears to be the top of a channel. The MSCI made new 52-week highs this past week although it remains well short of new all-time highs. With an RSI well over 70 the MSCI is signaling that it is overbought and, given it is also at the top of a channel, some caution might be warranted. A firm breakout over 2,000 would send the index sharply higher.
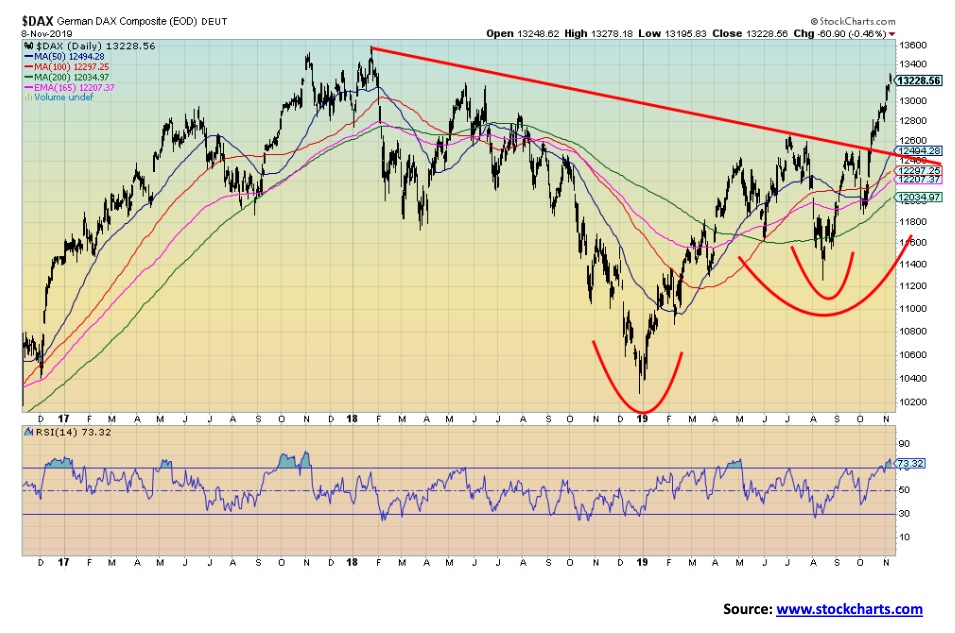
European markets have been soaring along with North American markets. Here is the German DAX that recently broke out over a downtrend line from the all-time highs seen back in early 2018. The market is becoming overbought at this point with the RSI over 70. That alone doesn’t signal a top; however, it is a warning. The DAX does appear to have broken out of an inverse head and shoulders pattern. Targets are up to 13,800, another 600 points from current levels. Reaching that level would also be new all-time highs for the DAX. If the German economy is faltering, the stock market is not confirming it. But then QE from the ECB definitely helps.
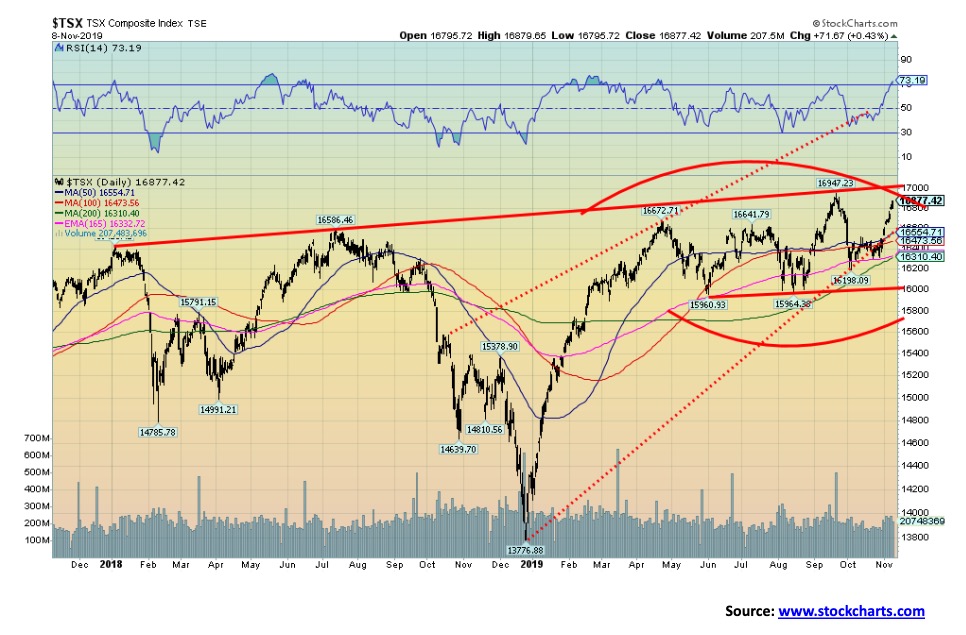
Will the TSX break out, or will it fail at the top of the channel? The TSX Composite gained 1.7% this past week and is now rapidly approaching the channel line from the January 2018 high. A breakout over 17,000 could send the TSX Composite higher (beware of false breakouts), but a failure here could trigger a sharp drop. Trouble starts under 16,550 and would accelerate under 16,000. Leading the way this past week and breaking out to new highs as well was the Financials sector (FS) with a gain of 2.2%. No, it wasn’t the best but it was significant, given that the financials are the largest sector by weight in the TSX. Featured later is the TSX Energy Index (TEN) with a gain this past week of 7.4%. That helped propel the TSX, offsetting losers elsewhere. Leading the way down was Golds off 5.3%, Materials down 1.4%, Real Estate off 1.0%. Information Technology down 0.7%, Metals & Mining down 0.7%, Income Trusts down 0.2%, and Utilities off 0.1%. The gainers, besides Financials and Energy, were Consumer Discretionary up 2.9%, Consumer Staples up 1.1%, Health Care (rebounding) up 3.1%, Industrials up 2.4%, and Telecommunications up 2.3%. But it was Financials and Energy, the two largest sectors by weight on the TSX making up almost 50% of the index, that led the way. If they can continue their rise, then the TSX Composite could rise to new all-time highs and break out over 17,000. The Energy sector, as we have noted later, looks interesting coming off potential lows. The Financials are high but could rise more.
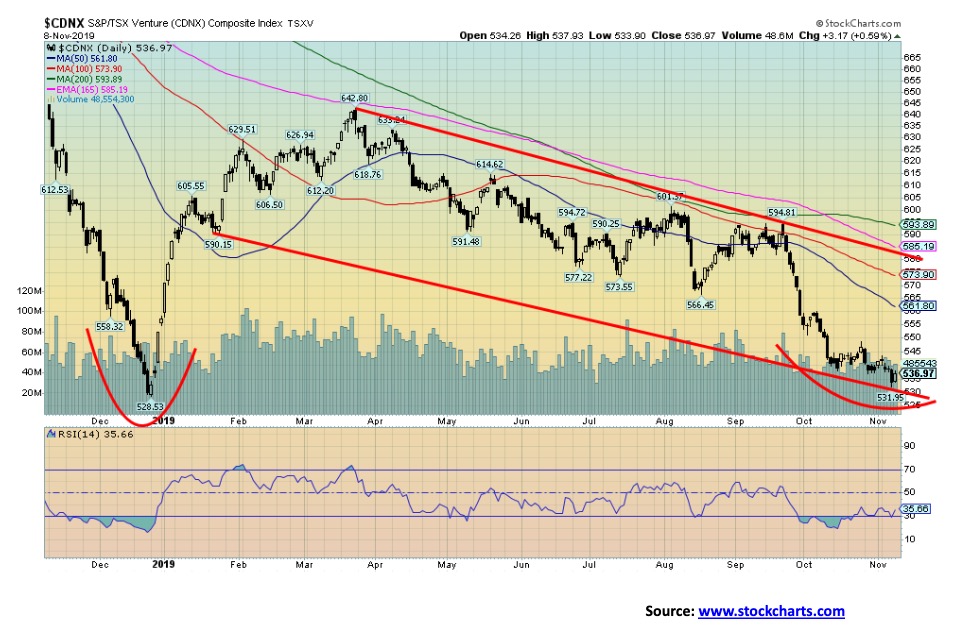
Oh, woe are those who are investors in the stocks that make up the TSX Venture Exchange (CDNX). If there was ever a spot to not be invested in, it is the CDNX. That is not quite true, because when the CDNX is the place to be it can have stellar gains. From 2002 to 2008 the CDNX gained 437%. Then, from 2008 to 2009, it fell 80%. The period 2009 to 2011 saw the index gain 263%, but then another bust from 2011 to 2016 saw it fall 81%. Since then the CDNX rose 101% to a top in 2018; however, once again down it went losing 43% so far. If you have the stomach for those kinds of gains and losses you will enjoy playing the stocks that make up the CDNX. Over 50% of the index is mining stocks, primarily exploration companies. However, what is interesting right now is that the index has fallen to levels last seen in December 2018. A possible double bottom? Naturally we have no proof of one at this point but, given the gloom that is currently a part of the CDNX and the junior mining sector in particular, this might well be worth a speculative look. We have been making new lows with the RSI currently diverging, not making new lows. A breakout over 545 could send the index higher. Major resistance is seen from 580 to about 600. Over 600 things brighten up.
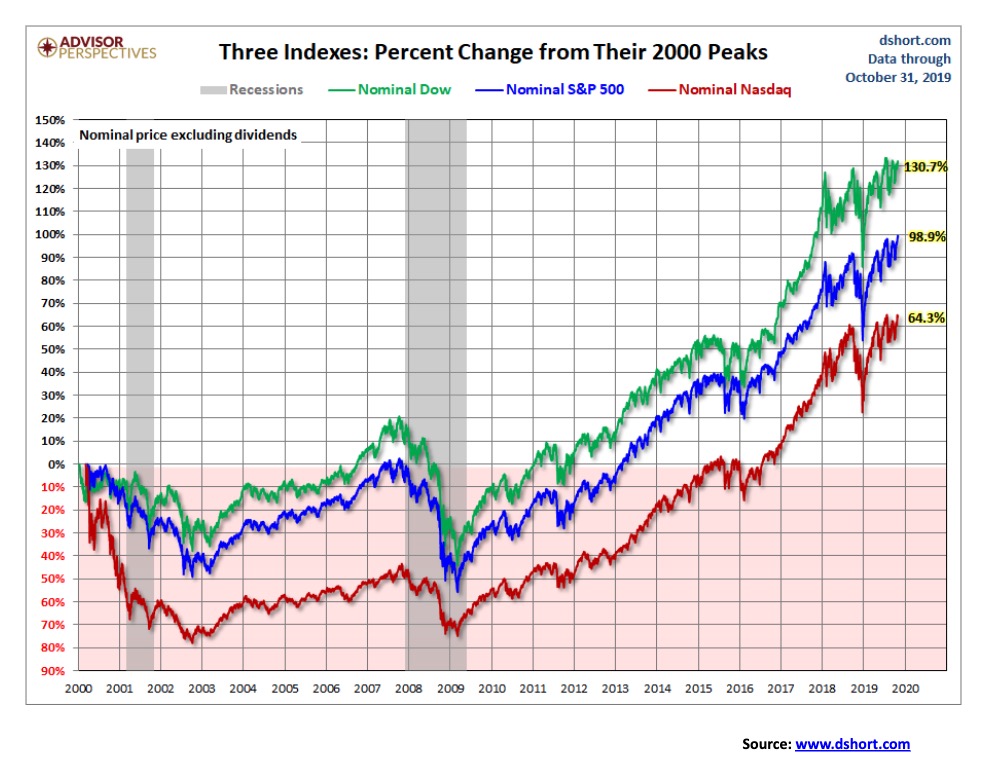
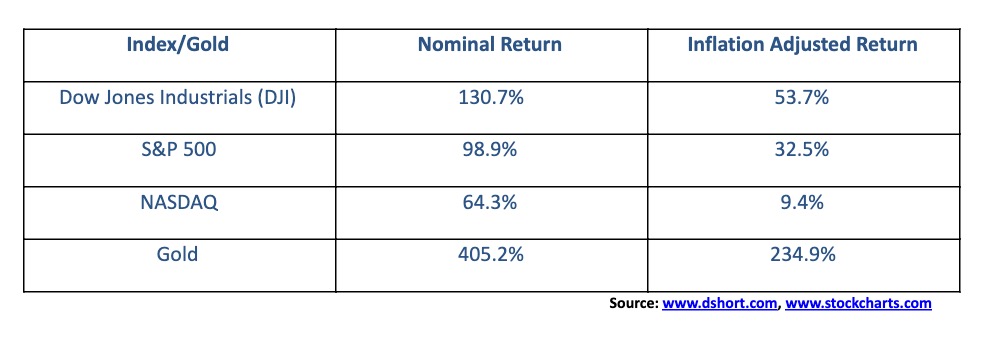
We are showing a series of three charts on the performance of markets since 2000 on both a nominal and inflation adjusted basis. The first two charts shows the nominal returns for the S&P 500, the DJI and the NASDAQ while the second chart shows the inflation adjusted returns. The third chart shows both the nominal and the inflation adjusted return for gold. Little explanation otherwise is need for the three charts. Summary is as follows:
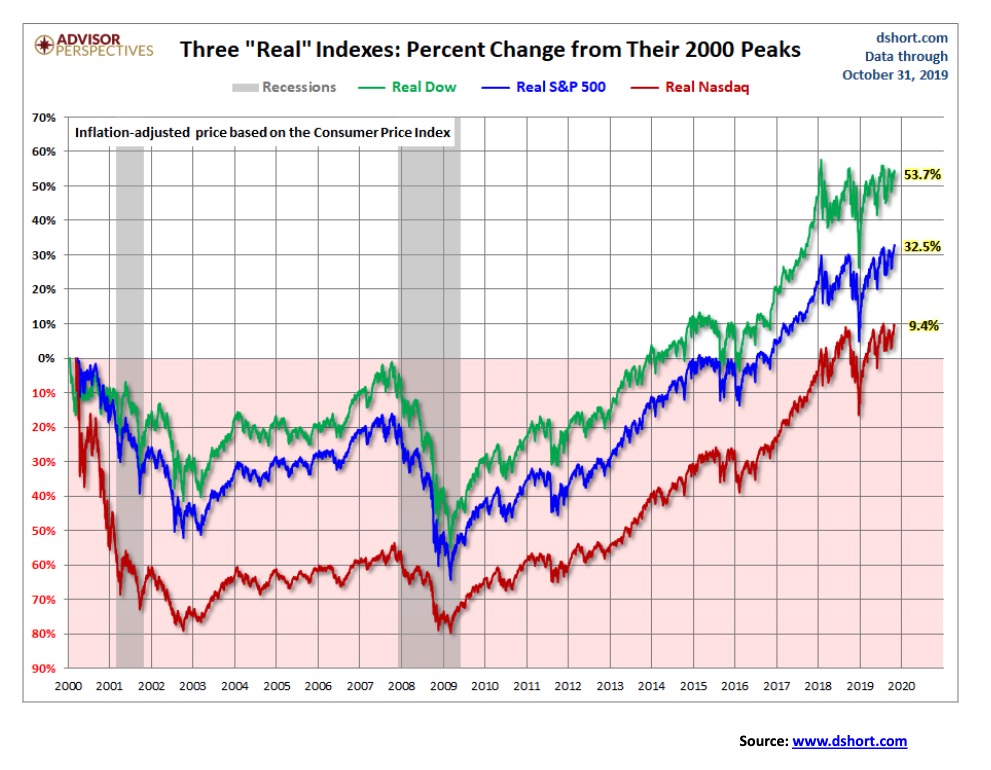
On an inflation-adjusted basis it does show that stock markets do bounce back following a period of down markets. However, it does take some time. So far, the returns are not stellar for the equity markets in the 21st century with the DJI averaging 2.8%/annually.
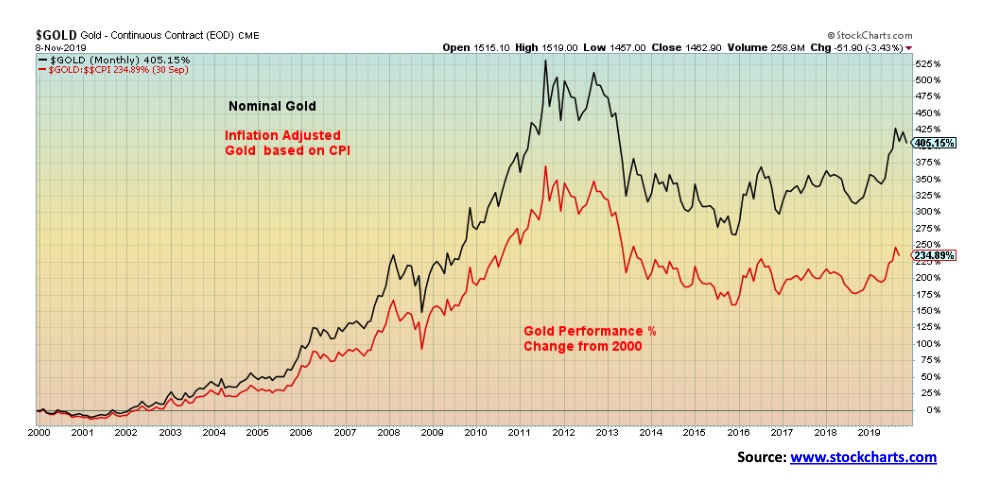
The clear winner so far is gold, up 405% on a nominal basis and 235% on an inflation-adjusted basis. On an inflation-adjusted basis, the return averages 12.4%/annually. It too has been uneven with 2000–2011 being stellar and the last 8 years anything but stellar. But despite that, gold is still outperforming the equity indices.
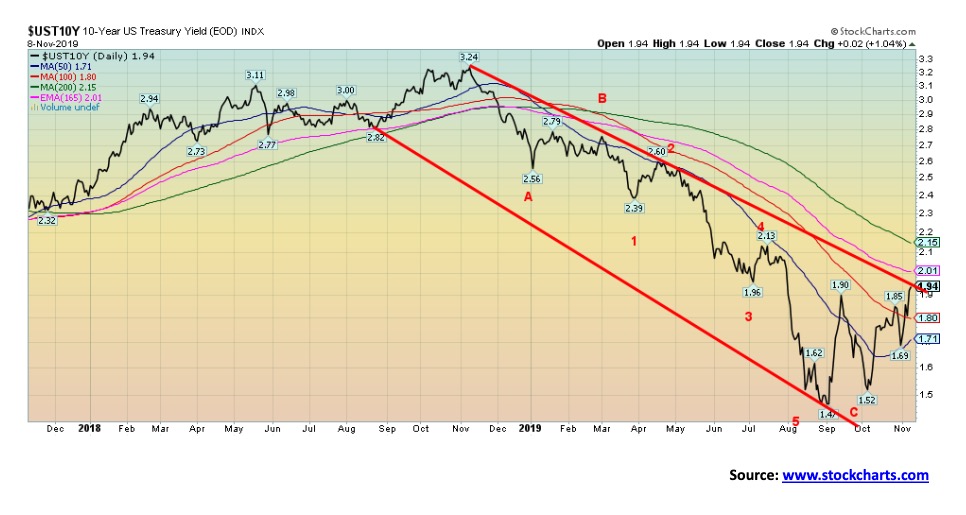
The recent sell-off for bonds continues. With some tensions easing between the U.S. and China over trade, the bond market is reacting as it lessens the potential for an economic reckoning. Yields are rising (yields move inversely to prices). The yield on the U.S. 10-year Treasury note has jumped from 1.47% in September to 1.94% this past week, a gain of about 32%. It’s happening in Germany as well as the yield on the German 10-year bund has jumped from negative 0.72% to negative 0.26%—still negative but considerably less so. With upwards of $17 trillion of negative yield bonds ($12 trillion of sovereign bonds) out there, the rise in yields could have a negative impact on investors in these bonds as prices fall. Of course, that is only a problem if they had to sell them, but for those who were speculating that bond yields would keep falling it could prove disastrous. At this time, however, we have heard nothing on the potential for a blow-up of a bond fund. But it is a possibility. As well, with short-term yields falling as a result of the Fed cutting interest rates, interest rate spreads between short-term treasury bills and short notes and bonds and long-term bonds have also been rising (see recession spreads). Inflation rates are also rising and that puts further pressure on bond yields. In a world with roughly $250 trillion in debt, rising yields (falling prices) in the bond market is not necessarily healthy. The 10-year has now hit a downtrend line from the highs seen in November 2018. At this point, the odds favour at least a reprieve. But if the 10-year breaks through the downtrend line, then a bear market for bonds could be underway. The 200-day MA is at 2.15% so it would take a move above that level to trigger an official bond bear.
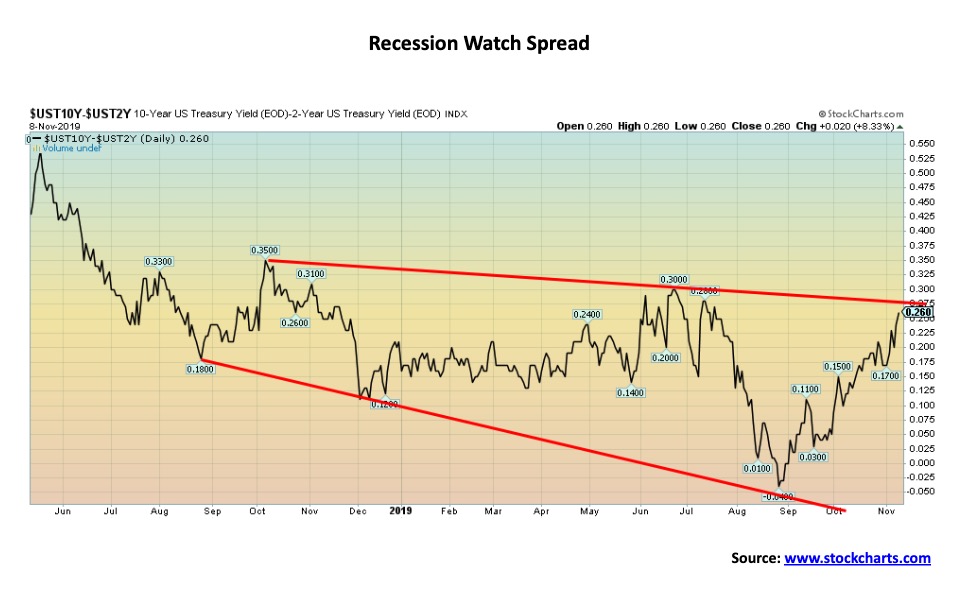
With long-term interest rates rising and short-term interest rates falling, it is no surprise that the spreads have once again been widening. The 2–10 spread is now up to 26 bp from 17 bp a week ago. The spread is rapidly approaching a downtrend line. A break over that line could send the spread even higher. The 2–10 spread was only briefly negative. Many had been using negative spreads of an impending recession. However, we have noted that while going negative was the sign of a potential recession, the potential rises as the spread returns positive once again.
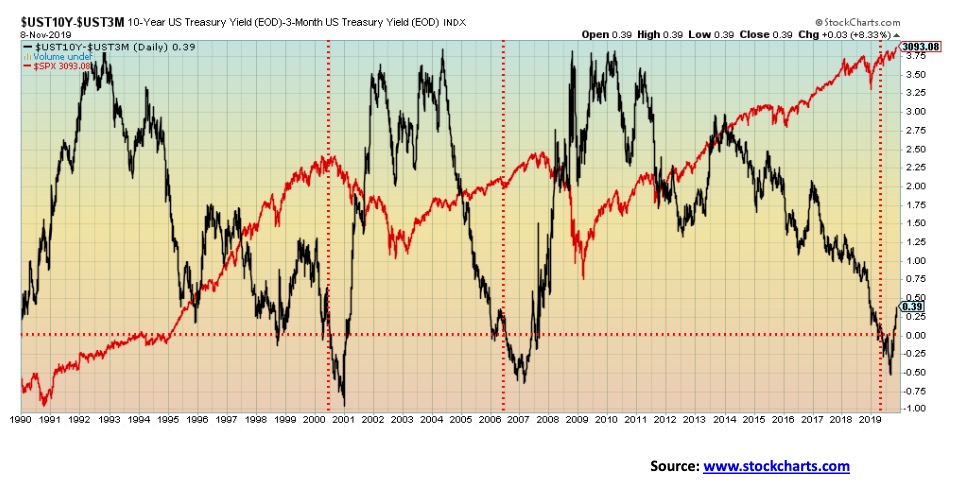
The 3-month T-Bill—10-year Treasury note spread continues to rise. Since bottoming at negative 52 bp in late August, the spread is now positive 39 bp. We have noted that a negative yield curve was the sign of a potential recession. However, the recession never got underway until the spread turned positive once again, as the chart above shows. Once it turned positive following a period of negative spreads, the stock market faltered and fell. Right now, the stock market is still rising. But could that be about to change?
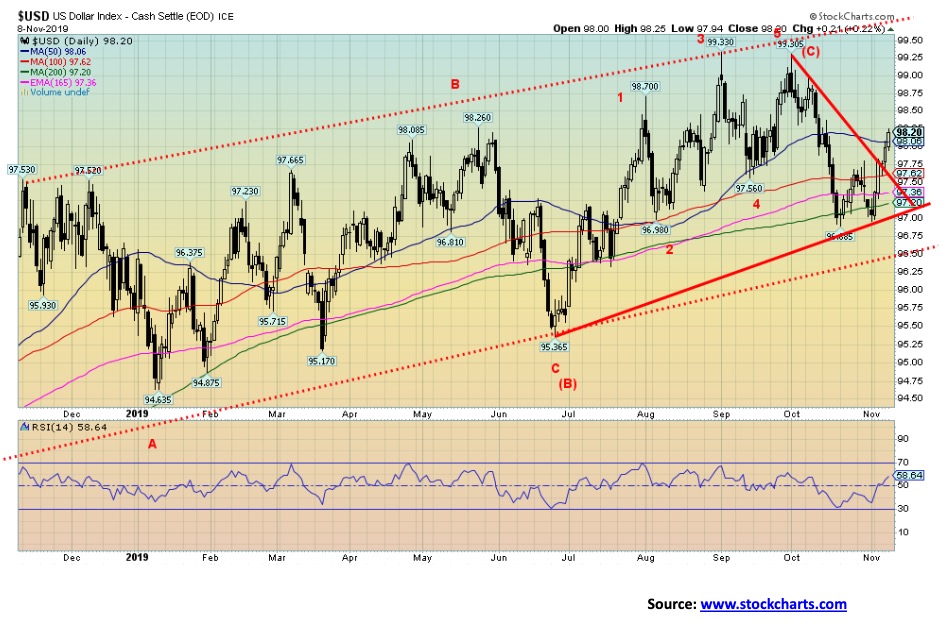
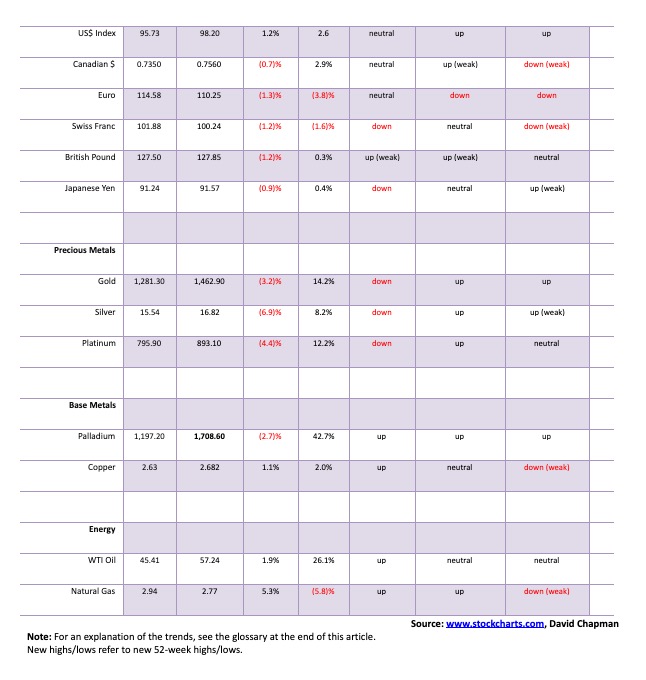
The US$ Index has once again broken out to the upside. Throughout 2019, the US$ Index has been exceptionally whippy with numerous up and down moves that have made a series of higher lows and higher highs. So far this year, we count 15 whippy up and down moves and this is the 16th. If previous action holds, we could see new highs above 99.30 with potential to go as high as 100. The US$ Index was up 1.2% this past week. Other currencies took it on the chin with the euro down 1.3%, the pound sterling off 1.2%, the Swiss franc also down 1.2%, and the Japanese yen down 0.9%. The Canadian dollar was down 0.7%. Admittedly all the whippy action on the US$ Index has made it difficult to read. Under 97.60, the US$ Index could fall once again to test 97. An initial breakdown zone is at 97 with the key breakdown zone at 96.50. The rally this past week was sparked by the potential for peace between the U.S. and China on trade.
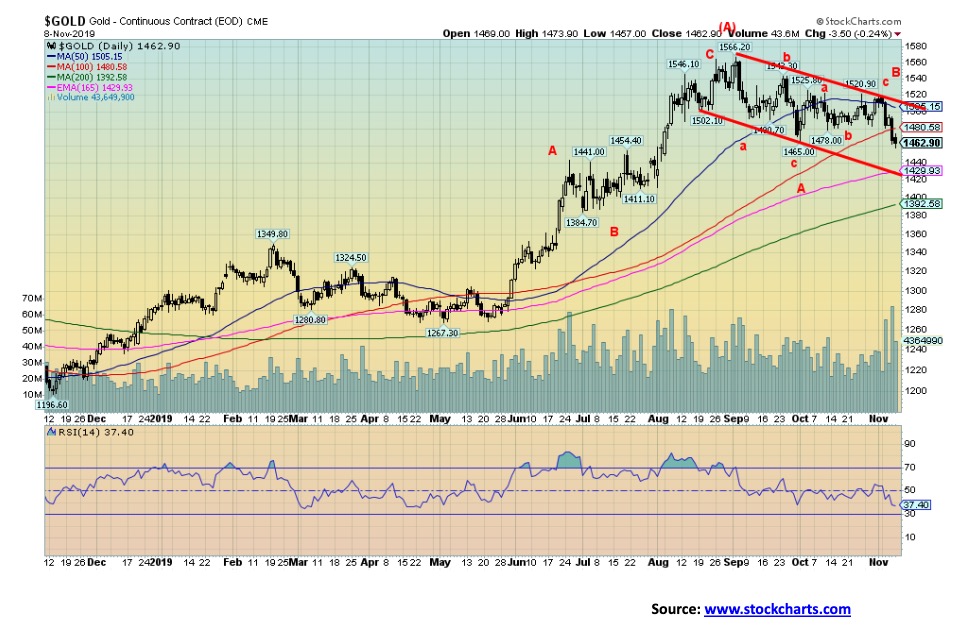
Gold and silver had a miserable week. For whatever reason, gold reacted negatively to news that the U.S. and China may be making trade peace. A strong U.S. dollar added to gold’s woes. Gold fell 3.2% on the week while silver was slammed down 6.9%. Platinum was also hit down 4.4%. Palladium wasn’t spared either and its string of new all-time highs was broken as it fell 2.7%. Volume was high on the fall, suggesting that this was bailing action. Gold hit a low on the week on Friday at $1,457. There is some support at $1,440–$1,445, but below that we could fall to stronger support at $1,430. Below that, support is seen at $1,390 with major long-term support at $1,350. Below $1,350 we could enter a major bear market for gold. With an RSI at 37 gold is not yet oversold enough to suggest a potential low. We’d prefer to see the RSI under 30. Sentiment, while down, is not yet at bearish extremes.
We are reading mixed signals on gold’s current performance. One is bearish while the other is bullish. The bearish forecast has gold entering another major phase to the downside that could in its extreme draw prices below $1,000. The more bullish scenario has gold with another major leg up once this corrective period is over. The up move could take us to targets we have noted ranging from $1,725 to over $2,000 and new all-time highs. At this stage we acknowledge the bearish scenario but believe the current pull-back is merely the B wave correction. The A leg topped out at $1,566 in August. We have had considerable resistance at $1,520 so once we break through $1,515 to $1,520, we believe we could on our way towards $1,600. First, however, we need to find our current low and trust that we don’t bust down under $1,430 and definitely not under $1,390.
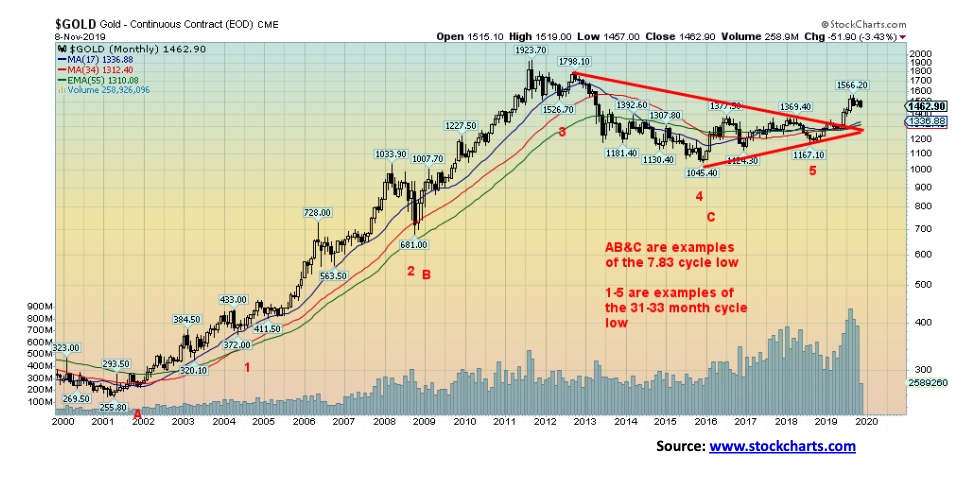
We have cited gold’s cycles in the past but it is worth repeating. Cycle analyst Ray Merrima has determined that gold could have a 7.83-year cycle. Basically, it is a long cycle of 23.5 years to 25 years divided by three. Gold’s last major 23.5-year cycle low was seen in 2001 making the next one due anywhere from late 2020 to early 2027. That’s fairly wide, so the 7.83 cycle could help us narrow that range. Since 2001 we have seen what we believe is three examples of the 7.83-year cycle low: 2001, 2008, and 2015. The range dating from the 1970s is 86–102 months. This puts the potential low February 2023 to June 2024. The first two cycles were quite bullish for gold. This being the third and final cycle, it can be extremely bullish and even extremely bearish. Given we broke out of what appears to be a multi-year triangle pattern, the projected target could be up to 2,100–2,200. The multi-year bottom pattern has suggested targets for us up to $1,725.
The 7.83-year cycle breaks down into three cycles of 31.33 months or two phases of 47 months. We suspect the last 31.33-month cycle occurred in August 2018 at $1,167. Our next 31.333-month cycle low is projected to occur somewhere between January 2021 and August 2021. This would only be the second 31.33-month cycle dating from the 7.83-year cycle low of 2015. The bearish cycle is usually the third and final 31.33-month cycle to take us into the final 7.83-year cycle low and the 23.5-year cycle low. That would take us into 2023/2024. Gold has also demonstrated an 11-month cycle. We are currently in that window, dating from the August 2018 low. Once that low is in, we could go on another up wave.
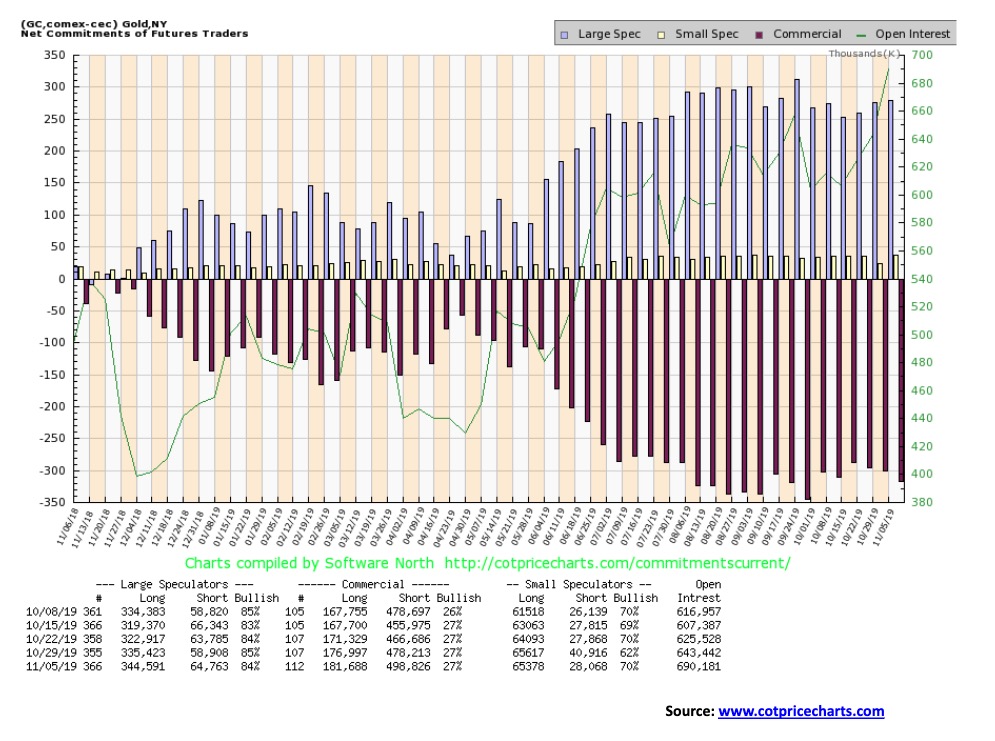
The gold commercial COT was steady this past week at 27%. However, the composition changed as long open interest actually rose almost 5,000 contracts while short open interest jumped over 20,000 contracts. The big jump in short open interest we’d consider somewhat bearish. The large speculators COT (hedge funds, managed futures, etc.) did fall to 84% from 85%. This report is as of November 5 so next week’s report could prove interesting as it would capture the sharp drop seen on November 7. The commercial COT needs to get back over 40% for us to consider gold being bullish once again.
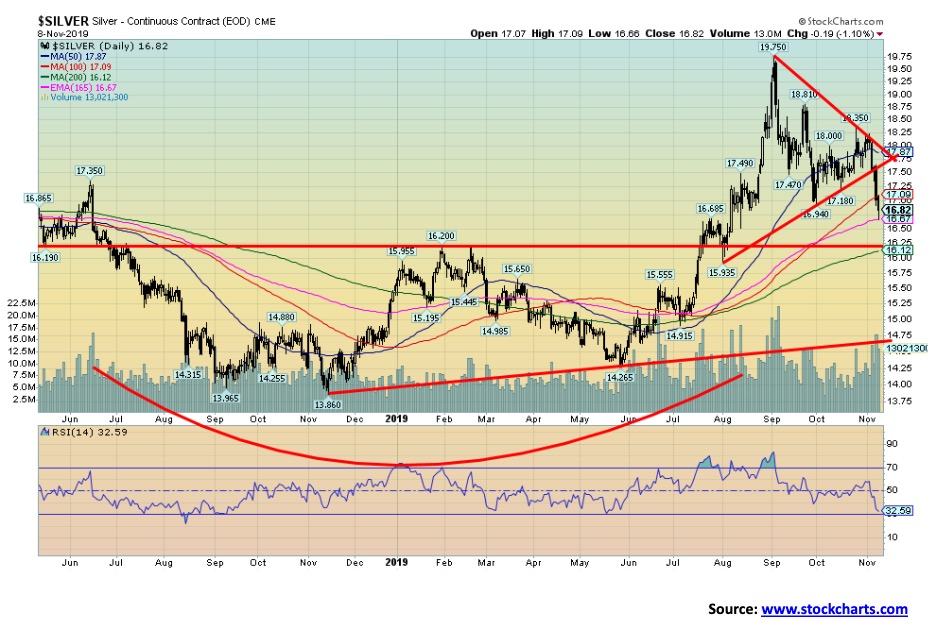
Silver broke down out of the triangle this past week, falling as low as $16.66 before closing up from that level at $16.82 down a sharp 6.9% on the week. It was not a stellar performance. Silver initially found support at the 165-day EMA ($16.67). We are into a potential danger zone. We’d prefer not to see silver prices fall much lower from here. We have some support at $16.50 then down to $16.10. Below $16.10 we could fall into the $15’s with major long-term support down at $14.75. As a saw-off we’d consider a move below $16.25 as negative and suggest that recovery is going to be more difficult. As with gold, there are various interpretations of the action. The bearish one has silver falling to that major support zone at $14.75. A more bullish interpretation is that silver stabilizes around current levels and once we are back over $17.75, we could be on our way to test the highs and even higher. Sentiment is not yet at bearish extremes, while the RSI at 32.60 is also not quite at oversold levels under 30.
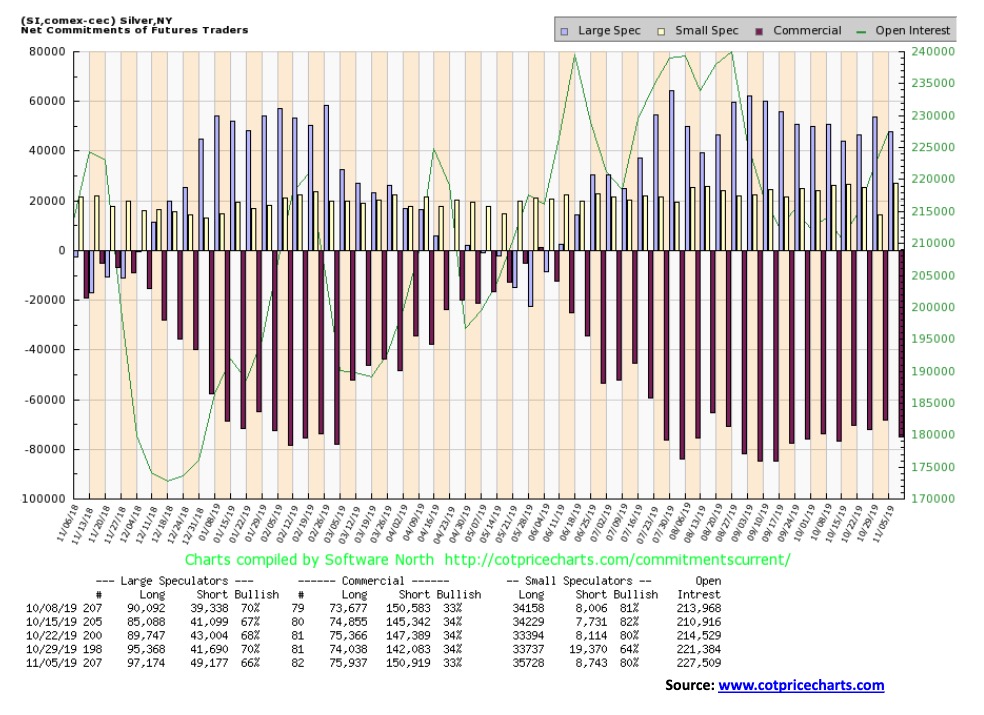
The silver commercial COT slipped to 33% this past week from 34%. The large speculators COT also slipped to 66% from 70%. Long open interest for the commercials was up just under 1,000 contracts while short open interest rose almost 9,000 contracts. Despite the fall for the large speculators, we have to view the silver commercial COT as still bearish towards silver. We’d like to see the commercial COT up over 40% to suggest a possible bottom.
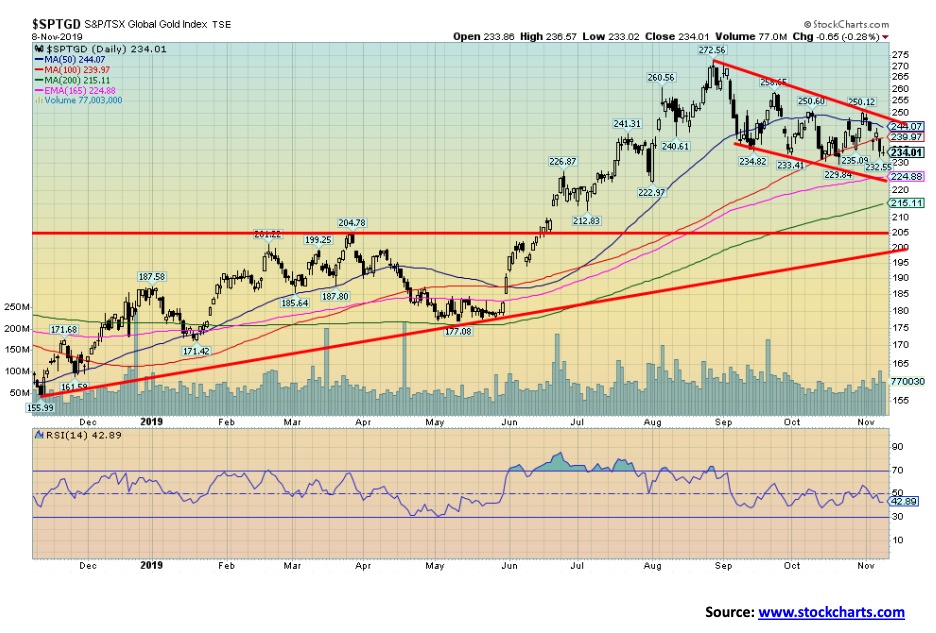
With both gold and silver down on the week the gold stocks didn’t stand a chance. The Gold Bugs Index (HUI) fell 6.8% while the TSX Gold Index (TGD) was down 5.3%. An unpleasant week. The good news is that the TGD did not see new lows for the move down. Nor did the HUI. The bad news is in all likelihood we will see a new low. Channel support for the TGD is seen down to 224.90 and the 165-day EMA. A breakdown under that level could project the TGD down to 182 in a worst-case scenario. There is, however, major support seen at 200. There is also support around 215. The gold stocks are still up on the year with the HUI up 27.1% and the TGD up 25.3%. The RSI still has room to move lower and is not yet oversold (under 30). All this suggests that there is still room to move lower. The HUI and the TGD are tied to the price of gold and silver. Gold stocks are still quite inexpensive with the Gold/HUI ratio at 7.15. The high was seen back in 2015 at 10.90. Gold stocks are not considered overvalued to gold until the ratio gets under 2.5. That was last seen from 2003–2008 and briefly in 2009–2011. The gold stocks have been overvalued to gold since 2014. It is the most sustained period of cheap stocks vs. gold that we have ever seen.
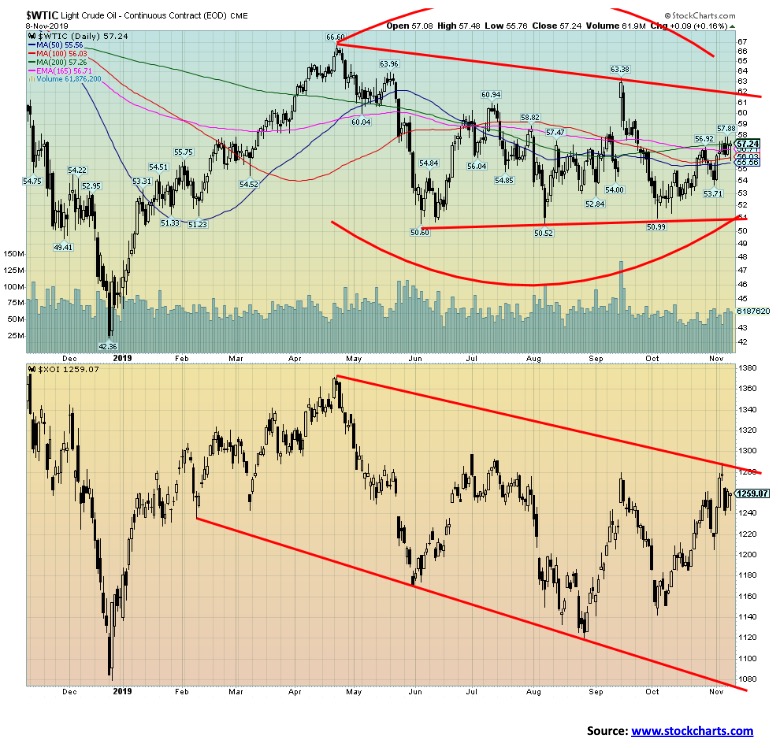
Oil prices rose this past week on hopes for peace in the U.S.-China trade war. With each seemingly offering concessions, oil prices rose along with the stock market. It Also helped that the rig count fell another eight rigs this past week. Traders are expecting the rig count to continue to decline. That in turn can put upward pressure on oil prices. WTI oil gained 1.9% this past week, but the real uptick came with Natural Gas (NG) up 5.3% on the week continuing its recent positive run. The oil & gas indices responded accordingly with the Arca Oil & Gas Index (XOI) up 1%, but the real star was the TSX Energy Index (TEN) gaining 7.4%. We note the TEN next.
After rising, the XOI pulled back from the high, suggesting that 1,260 area was resistance. The next key point for the XOI is up at 1,320. Above that level new highs are possible. The breakdown zone is now at 1,200. For WTI oil it ran into resistance at the converging 200-day MA and the 165-day EMA ($56.70 to $57.25). Once through $58, oil could run to $60–$62. Only above $62 would it be considered a breakout.
Support is at $55, but major support remains at $50. Below $50, a test of the 2019 low near $42 is possible.
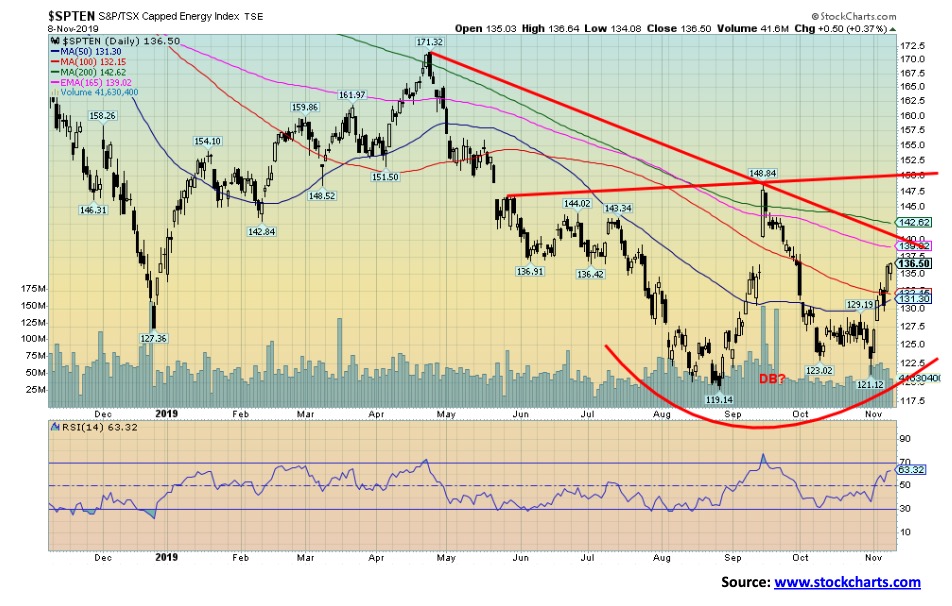
Are the energy stocks making a bottom? The TSX Energy Index (TEN) has been one of the worst performing sub-indices of the TSX Composite in 2019. It is down 1% on the year, but consider that during the month of December 2018 the energy stocks were hit hard along with everything else. The TSX Composite is up 17.8% on the year so the energy stocks have been a drag. The energy sub-index makes up 16.4% of the TSX Composite, making it the 2nd highest weighting. Thus, its importance on the index as a whole. But the TEN may be making a double bottom. There is resistance up at around 140, but above that level we could test what appears to be the neckline of the possible double bottom. A firm breakout over 150 could project the TEN up to about 180. That’s almost 32% from current levels. The strong seasonals for energy stocks is December to June so we are moving into the positive period just as we did last year. From December 2018 to the top in April 2019 the gain for the TEN was 34%.
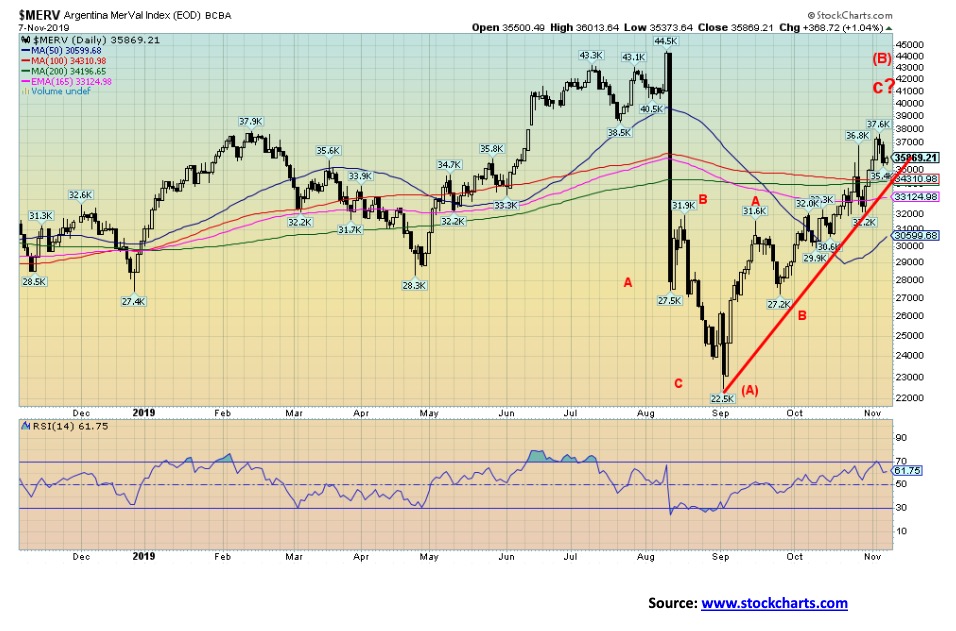
Picture of a stock market crash. Yes, this was more than a few weeks ago but it is not something that pops up in the North American press. This is Argentina’s MerVal Index. On August 12, 2019, the MerVal Index plunged 37% in one day. It was the second largest stock market drop in a single day for any index since 1950. Apparently, the winner still is the Sri Lanka stock market that plunged 62% in a day back in 1989 at the onset of a civil war. This one was sparked by the defeat of the incumbent president Mauricio Macri by the left-leaning Alberto Fernandez by a far wider margin than was expected. The Argentinian peso also plunged 15% and bond prices collapsed some 25% as well. Seems that Macri’s austerity measures weren’t going over too well with the Argentinian people and poverty under Macri rose sharply. Of course, what it puts in doubt is Argentina’s debt. Those with money were bailing.
After hitting rock bottom on September 3, down 48% from the high, the market has undergone a strong recovery up 55%. Maybe Fernandez is not so bad after all. Then again, the rebound may be only a B wave recovery with a C wave down to come. Before the collapse, the MerVal had been up 46% on the year and had gained over 1,800% since 2012. Macri was elected in 2015 and the MerVal rose 260% to the high following his election. Odd since the market had gone up from 2012 to Macri’s election some 460% from 2012 under former president Cristina Fernandez de Kirchner who is now Alberto Fernandez’s running mate.
—
(Featured image by Markus Spiske via Unsplash)
David Chapman is not a registered advisory service and is not an exempt market dealer (EMD) nor a licensed financial advisor. We do not and cannot give individualised market advice. David Chapman has worked in the financial industry for over 40 years including large financial corporations, banks, and investment dealers. The information in this newsletter is intended only for informational and educational purposes. It should not be considered a solicitation of an offer or sale of any security. The reader assumes all risk when trading in securities and David Chapman advises consulting a licensed professional financial advisor before proceeding with any trade or idea presented in this newsletter. David Chapman may own shares in companies mentioned in this newsletter. We share our ideas and opinions for informational and educational purposes only and expect the reader to perform due diligence before considering a position in any security. That includes consulting with your own licensed professional financial advisor.
DISCLAIMER: This article was written by a third party contributor and does not reflect the opinion of Born2Invest, its management, staff or its associates. Please review our disclaimer for more information.
This article may include forward-looking statements. These forward-looking statements generally are identified by the words “believe,” “project,” “estimate,” “become,” “plan,” “will,” and similar expressions. These forward-looking statements involve known and unknown risks as well as uncertainties, including those discussed in the following cautionary statements and elsewhere in this article and on this site. Although the Company may believe that its expectations are based on reasonable assumptions, the actual results that the Company may achieve may differ materially from any forward-looking statements, which reflect the opinions of the management of the Company only as of the date hereof. Additionally, please make sure to read these important disclosures.


The TopRanked.io Weekly Affiliate Marketing Digest [The Top VPN Affiliate Programs Roundup]
Want to be let in on a little secret about two massive affiliate opportunities you can take advantage of today?...


Sustainable Finance Faces Hurdles as Green Asset Ratio Reforms Fall Short of Full Transparency
The Green Asset Ratio (GAR) measures banks' alignment with the EU Taxonomy but remains low due to methodological flaws and...


XRP Hits New All-Time High Amid U.S. Crypto Policy Shift and Ripple’s Expansion
XRP surged past its 2018 all-time high, reaching $3.65 amid renewed political support for crypto in the U.S. under Trump....


Germany Moves to Curb Medical Cannabis Abuse, Sparking Access Concerns
Medical cannabis imports in Germany have surged, but health insurance-covered prescriptions remain low. Easy online access raises concerns about abuse...


JPMorgan’s Data Fees Shake Fintech: PayPal Takes a Hit
JPMorgan Chase will charge fintechs for customer data, threatening business models reliant on free access. PayPal’s stock plunged 5.7% after...
 |
|
 |  |
 |
|
-

 Biotech1 week ago
Biotech Booster: €196.4M Fund to Accelerate Dutch Innovation
-
 Business5 hours ago
The TopRanked.io Weekly Affiliate Marketing Digest [The Top VPN Affiliate Programs Roundup]
-

 Crypto1 week ago
Bitcoin Traders Bet on $140,000: Massive Bets until September
-
 Crypto2 weeks ago
Caution Prevails as Bitcoin Nears All-Time High