Featured
Strategies on how to avoid the next 50% market crash
During the next debacle the typical balanced portfolio designed by Wall Street will no longer provide much protection at all. In this sense, it is anticipated that the bull market may soon face the third collapse. So, what should we do as investors? Pento Portfolio Strategies uses the Inflation/Deflation and Economic Cycle Model SM to determine the macroeconomic condition of the economy.

This ageing bull market may soon face the third market collapse since the year 2000. Nobody can predict the exact starting date of its decline—but either a recession or stagflation will surely be its catalyst. During the next debacle, the typical balanced portfolio designed by Wall Street, which consists of approximately 60% stocks and 40% bonds, will no longer provide much protection at all. In fact, that type of portfolio construct has become downright dangerous.
The simple reason for this is that for the first time ever both stocks and bonds are in a massive and unprecedented bubble; and are therefore both vulnerable to significant selloffs. Bonds will no longer provide a ballast or offset to your stock portfolio once reality hits both of those asset classes.
If a bond has a 5% yield and has 30 years left to maturity; that holder would lose 25% of his principal if interest rates rise by just 2%. Given the fact that bond yields are the lowest in history, an increase of 2% is certainly not out of the question; and is in fact most likely inevitable.
What happens with the equity portion depends on the reason why rates are rising. If rates increase because of a surge in economic growth, then equities should do well for a while longer. However, if rates rise because of inflation or credit risks; then stocks would likely get hurt very badly indeed. In that case, there is a high probability of losing money in both your equity and fixed income buckets.
Therefore, a smarter way to invest–rather than just blindly buy and hold a closet Index fund and hope for the best—is to map the economic cycle. Given that Wall Street’s version of diversification will most likely no longer work, it is now imperative to understand where the economy lies along the spectrum between Inflation/Deflation and Growth/Recession.
An alternative investment strategy is now necessary because the Fed decided around 20 years ago that recessions could be abrogated and it had the tools to repeal the business cycle. It kept pushing interest rates lower every time there was either a downturn in the economy or a sharp selloff in stocks. This is exactly what happened in the wake of the NASDAQ bubble of 2000 and the Housing Crash of 2008. Indeed, Greenspan started this practice in 1987; but its roots were planted in 1971 when the US left the gold standard completely.
Each iteration of this cycle served to push asset prices higher than what the underlying economy could support. This also caused even more debt to be accumulated. Now, we have a triumvirate of asset bubbles (stocks, real estate and bonds) that exist globally.
Speaking of the real estate market bubble–although it is no longer the nucleus of the current bubble–it should be noted that National Home prices have increased for 91 months in a row and have advanced 5.9% y/y—far above the pace of income growth. The sad truth is that the Fed, in full cooperation with Wall Street, has once again made home prices unaffordable for many first-time buyers.
Relevant data points
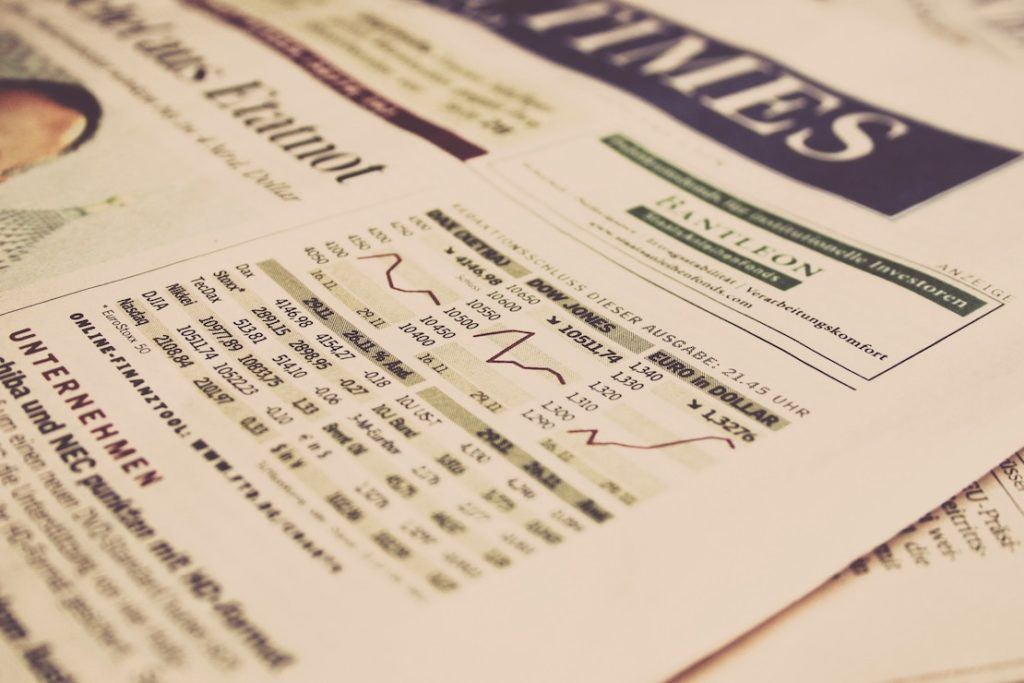
The fact is that debt levels have exploded worldwide and yet at the same time interest rates have never been lower than they are today.
Here’s some data points that we all should and need to be aware of:
- Total market cap of equities as a share of GDP is now 145%. That ratio was 100% in 2007, and has averaged just 80% since 1971.
- $15 trillion worth of sovereign debt with a negative yield.
- 500 billion euros of junk bonds in Europe with a negative yield.
- $5.4 trillion of BBB, Junk and Leveraged Loans in the US, there was only $1.5 trillion of sub-prime mortgage debt in 2007.
- The US Treasury yields 1.7% but its average is above 6%.
- US deficits breached above $1 trillion in fiscal 2019 and the CBO projects deficits will be $1.2 trillion each year for the next decade but that assumes interest rates never normalize and the economy never has a recession. If rates rise and/or we have a recession, the annual deficit could approach 15% of GDP. Adding to our already-huge national debt of $22.6 trillion.
- Total global debt has soared to $250 trillion up over $70 trillion from 2008 and is now a record 330% of GDP.
- US Non-financial debt has soared from $33 trillion in 2007 to $53 trillion in 2019.
- US National Debt was $9 trillion in 2007 and has skyrocketed to $23 trillion today.
- Business debt has jumped by nearly 60% since 12 years ago.
The point here is not to scare you; but to help you make good investment decisions.
The gravitational forces of deflation are immense and trying to bring about a healthy recession. This would cause a significant paring down of debt along with an even greater correction in equity, junk bond and property values. That is, if the economy was left alone and market forces were allowed to rectify the imbalances. However, global central banks are fighting these market forces and trying to keep asset bubbles afloat by pushing interest rates even lower and returning to QE.
The problem with central banks
The problem is, central banks are simply running out of room to reduce borrowing costs. And speaking of central bankers, if any of you still believe in the Fed’s omnipotence and omniscience then please remember that it was in Quantitative Tightening only a few months ago and now has returned to QE–just don’t call it that–even though Chair Powell is monetizing debt exactly like Bernanke and Yellen were doing.
Therefore, buying $60 billion of short-term Treasuries is QE in every sense of the word. The only difference between QE 4 and QE’s 1,2 &3 is the Fed is now trying to steepen the yield curve, while the other iterations of QE were about pushing down long-term interest rates. In either case, it is debt monetization just like any other banana republic would do. Only this round of QE is worse than all others before it because investors know for sure it is permanent. The Fed can no longer pretend QE was temporary.
The truth is that central banks have destroyed free markets and the global economy has become massively unstable. We have artificial interest rates that are in the basement of history as a direct result of global central banks printing the equivalent of $22 trillion since 2008. This has in turn caused a humongous distortion in most asset prices that are now perched at dangerously high levels.
What should we do as investors?

What we should not do is just take a 50% stake in gold and go 50% short stocks and then claim that someday we will be right because of what ought to be happening right now. Instead, market investors need to intelligently model the economy to determine what sectors and style factors of stocks to own. And, what asset classes should they be most exposed to; equities, bonds or commodities depending on the rate of growth and inflation.
Pento Portfolio Strategies uses the Inflation/Deflation and Economic Cycle Model SM and its 20-components to determine the macroeconomic condition of the economy.
Both public and private debt levels have grown so large that it must be defaulted on; either through inflation or deflation. How governments choose to default on the debt will make a world of difference in how you invest your money. Think back to 2018. It was a year where we were on a path towards interest rate normalization and QT.
But that led to a crash in stocks by the end of the year. Now, most central banks have turned dovish and the Fed has redefined stable prices by making 2% inflation a floor rather than a ceiling. The major issue is that there is very little room at all to reduce borrowing costs in order to re-inflate asset prices and the economy.
So, the question now is do central banks have enough ammo to avert a recession? The recession of 2001 saw the NASAQ lose 80% of its value and the Great Recession of 2007-2009 saw the S&P lose half its value and home prices drop by 33%. The sad truth is the distortions evident in the prior two recessions are dwarfed by the record triumvirate of asset bubbles that exist today on a worldwide basis.
The whole idea is to make money slowly and carefully in the current environment but then also make sure we try to protect and profit from the inevitable recession and/or inflation with its mean reversion of interest rates.
This dynamic strategy gives us an opportunity to vastly outperform the major indexes during cycles of stagflation and recession/depression, in which equities undergo a bear market. Holding a static portfolio did not work during the Great Recession and it probably won’t work during the next crisis either.
Given this exceptional time in history–one where the main stream financial news has never been more incompetent and corrupt; and where the global economy has never been more unstable—a source like PPS is mandatory to obtain the correct market guidance.
—
(Featured image by AbsolutVision on Unsplash)
DISCLAIMER: This article expresses my own ideas and opinions. Any information I have shared are from sources that I believe to be reliable and accurate. I did not receive any financial compensation for writing this post, nor do I own any shares in any company I’ve mentioned. I encourage any reader to do their own diligent research first before making any investment decisions.

-

 Business6 days ago
Legal Process for Dividing Real Estate Inheritance
-

 Markets2 weeks ago
Stock Markets Surge Amid Global Uncertainty, But Storm Clouds Loom
-

 Fintech4 days ago
PUMP ICO Raises Eyebrows: Cash Grab or Meme Coin Meltdown?
-

 Africa2 weeks ago
Morocco Charts a Citizen-Centered Path for Ethical and Inclusive AI


