Featured
Global economy slows down but US seems resilient
The global economy is still slowing but the U.S. appears to be resilient. Or is it? The recession spreads are starting to turn positive after being negative as long interest rates are starting to rise and short rates are falling thanks to two Fed cuts since July. Markets look toppy. October is already here and it can be scary. Will it bring a crash or is it the start of another leg up?

October is coming. Halloween, stock market crashes, and a “bear killer.” Yes, it does seem difficult to believe that, despite October’s reputation for stock market crashes, the worst six months of the year tend to end in October. According to the Stock Traders Almanac 2019, Jeffrey A. Hirsch & Christopher Mistal, October has ended many bear markets. Some notable endings to bear markets occurred in 1946, 1957, 1960, 1962, 1966, 1974, 1987, 1990, 1998, 2001, 2002, and 2011. One could even argue that the 2008 financial crisis ended in October even though the final low was not seen until March 2009. But tops have also occurred in October: most recently in 2018 and more famously in 2007.
October doesn’t even rank as the worst stock market month of the year. It’s number 7. But in pre-presidential election years since 1950, it ranks dead last. A reminder that this is a pre-presidential election year. October is also famous for crashes: 1929, 1987, a big 554-point drop in October 1997, back-to-back massacres in 1978 and 1979, Friday the 13th in 1989, and the October 2008 meltdown that started in September. October 2019 marks the 90th anniversary of the 1929 stock market crash of October 28–29 where the Dow Jones Industrials (DJI) fell 23% over the two days. The FOMC just happens to be holding its October meeting on those dates in 2019. Karma?
As this is the 90th anniversary of the October 1929 crash, we’d thought we take a look at what happened during October on decennial anniversaries. Who knows what 2019 will bring, but there are some potential market breakers churning in the background—impeachment, the chaos in the repo market, Iran, and the looming Brexit date. And there remains the ever-changing conflict between the U.S. and China.
This October also marks the 11th anniversary of the current bull market. March 2009 might have been the nominal bottom of the stock market, but the real bottom to the 2008 financial crisis was seen on October 10, 2008. That date marked the low from the collapse of Lehman Brothers that got underway on September 15, 2008.
The Decennial of Octobers During Years Ending in 9
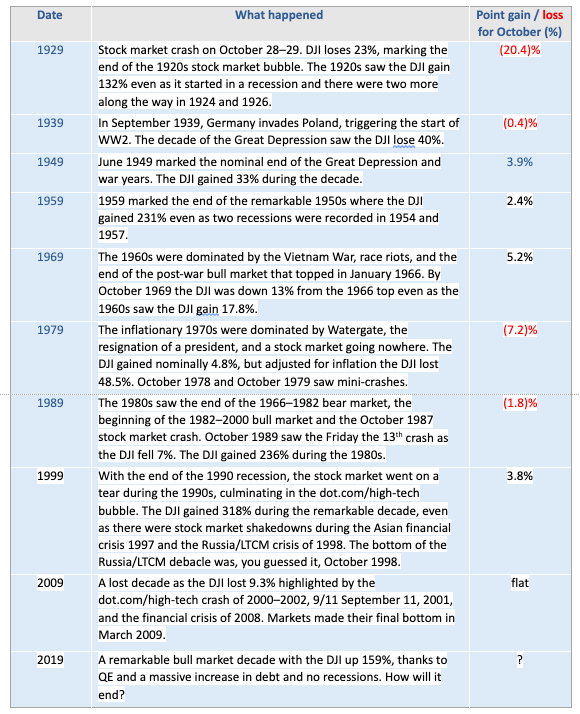
It is pretty even since 1929 with four up Octobers, four down Octobers, and one flat. But what does October 2019 bring? Of the four down Octobers, three saw a crash: 1929, 1979 and 1989.
Impeachment hearings are now underway against President Trump. It promises to be a “knock him down, drag him out affair” with plenty of drama. But what does impeachment mean for the markets?
Since the founding of the U.S., there have been two presidents who were impeached by Congress and one resigned before he was impeached. The first was Andrew Johnson, president 1865–1869. Impeachment proceedings began in February 1868. He was impeached by Congress, but his trial in the Senate failed and he was cleared in May 1868. The second was Richard Nixon. The impeachment process got underway on October 30, 1973 following the “Saturday Night Massacre.” It ended on August 9, 1974 with the resignation of the President. Nixon was never formally impeached. His political support had eroded and he resigned. The DJI fell 19.7% during the period. Gold gained over 53%.
The last impeachment was Bill Clinton. The impeachment process got underway on October 8, 1998. In December 1998 Congress adopted the articles of impeachment, making Bill Clinton only the second president to be impeached. On February 12, 1999 Clinton was acquitted of the charges against him as the Senate failed to obtain the required two-thirds majority. The stock market yawned, gaining 20% during the period as the dot.com/high-tech euphoria continued. Gold also yawned losing 3.6%.
So, what do the impeachment hearings for President Trump potentially mean? They could mean continual chaos in Washington for the next year. Many things could take a back burner as the push and pull, legal maneuverings, tweeting, and name calling suck up all the air. It could translate into situations like Iran and even the trade war with China being pushed to the sidelines. The ensuing chaos could also embolden both Iran and China to take a harder line. Impeachment hearings could also have a negative impact on elections for both Congress and the Senate. Investors may see it as a tempest in a teapot, given that the impeachment process could result in conviction in the Democrat-controlled Congress but fail in the Republican-controlled Senate. Irrespective of this, it is just another potential crisis against the backdrop of a slowing global economy and ongoing trade wars in a world laden with debt.
So, what is going on in the repo market? A week ago, Friday, the Fed made it clear that their interventions in the overnight repo market were going to continue into October. Ongoing intervention in markets buying up securities even if it is for a night (or two) is, according to some, just another form of quantitative easing (QE). The excuse that there are cash shortages because of tax settlements, treasury auction settlements, and other factors doesn’t make a lot of sense when, alone in the U.S., you have a banking system where the four largest banks alone have deposits of $5.5 trillion.
Yet there is the Fed doing daily operations of $75 billion plus an additional $30 billion on 2-week repos—not once, but three times alone over the past week. Note: repos are short-term borrowings, usually occurring overnight, whereby a dealer, bank, or others with cash to go lend money against collateral, usually government securities. But banks with huge deep pockets can’t seem to come up with $75 billion against trillions in deposits?
This is the first time these operations have been carried out since the financial crisis of 2008. This begs the question: is there a liquidity crisis somewhere? Is there a major bank in trouble somewhere? Are there major shortages of U.S. dollars somewhere? If we have a liquidity crisis unfolding, the question is where will it hit? We know that Mario Draghi’s tenure as head of the ECB is coming to an end and is being replaced by Christine Lagarde. She is a firm believer that cash should be eliminated. That in turn could spark cash hoarding, especially outside the U.S. There is currently more cash outside the U.S. than there is in it. Cash hoarding is already taking place, predominantly in U.S. dollars.
As well, foreign central banks continue to buy up U.S. treasury securities. In the past year alone, the amount of U.S. treasury securities held by foreign central banks has jumped by over $400 billion. It hasn’t been China. China’s holdings have fallen by $61 billion, effectively replaced by Japan whose holdings jumped by $65 billion. Japan is now the largest holder of U.S. government securities with China falling to second place. The U.K. has also picked up $62 billion and even Canada is up $13 billion. Numerous other central banks have also picked up the slack. France has added $25 billion. Belgium added $52 billion.
But what if the central banks need money? Then they would have to sell, and who will buy their securities? The Fed? We noted that the Fed’s balance sheet that had been falling steadily for the past two years has started to rise again, up $85 billion since the end of August. It is the first significant rise since 2014. If there is a liquidity crisis, the question is who? Deutsche Bank is often mentioned, especially since its proposed merger with Commerzbank fell through.
Deutsche Bank has been on the sick list for years. Apparently, it now has only $16 billion of capital. It has reported losses in three of the past four years. It has a book of $49 trillion of derivatives. Okay, that’s notional, not real, meaning it’s not like a loan. Futures, options, and interest rate swaps are derivatives. The question is, how much of it might be at serious risk. Even 1% is $490 billion. A mere 0.1% is $49 billion more than enough to wipe out their capital. In a worst-case scenario, our guess is that Deutsche Bank would have insufficient capital to cover losses. Deutsche Bank is heavily interconnected with the global banking world, especially with other large European banks and U.S. banks like JPMorgan Chase, Goldman Sachs, Bank of America and Morgan Stanley. The IMF has cited the danger that Deutsche Bank poses to the global financial system.

Deutsche Bank has remarkably followed the downward spiral of Lehman Brothers and, oddly enough, the downward trend for interest rates as represented here by the U.S. 10-year Treasury note. No, Deutsche Bank (DB-NYSE) is not bankrupt, but the downward trend is persistent. We could have added as well the downward trend of the 10-year German bund. Rates on the 10-year bund are negative 0.58%. Yes, negative.
Is the bankruptcy of Thomas Cook, the British travel group that went into voluntary liquidation on September 23, 2019 the tip of an iceberg? Seems innocuous enough. While it certainly had ripple effects throughout the world, it doesn’t appear to be the kind of collapse that could start an avalanche. But the collapse of a couple of Bear Stearns hedge funds back in July 2007 didn’t appear to be an end of the world event either. A year later, the global financial system nearly collapsed, led by the Lehman Brothers bankruptcy as the sub-prime mortgage market unravelled, triggering a real estate collapse. Many have cited Wells Fargo Bank (WFC-NYSE) as being a potential candidate for collapse. They have been immersed in a fraud scandal, closing branches and laying off employees. They are operating under a Federal Reserve asset cap through 2019 and possibly into 2020.

The monthly chart of Wells Fargo looks dangerously toppy, forming what appears as a potential head and shoulders top. Beware a collapse under $40.
Then there is China’s real estate market. So far in 2019 nearly 300 property developers have gone bankrupt. Chinese consumers, and, corporations have accumulated a massive amount of debt to fuel the real estate market. Consumers have some $6.8 trillion of debt. Household debt to GDP is 53.6%. Non-financial corporate debt totals $3.2 trillion. As it turns out these amounts are small compared to the U.S. and the EU. PBOC has the wherewithal to manage a crisis even if there are dislocations. The consumer in China still only makes up roughly 32% of GDP compared to 70% in North America.
Something is amiss. Impeachment hearings, the action in the repo market, the ever-changing conflict between the U.S. and China, Iran, and Brexit—they are symptoms of a fracturing system. Forecasts for the U.S. economy, and by extension the world, while indicating a slowing, do not suggest any collapse is imminent. By some estimates, nine major countries with total GDP of over $16 trillion (over 18% of the global economy) are either sliding into recession or on the brink of one. They are Germany, Italy, South Korea, Mexico, Singapore, Argentina (a basket case), Russia, Brazil, and the United Kingdom. The bumbling-along economy seems to be a good description of where we are at. October is coming. Will it bring a bottom or a crash?
Markets and trends
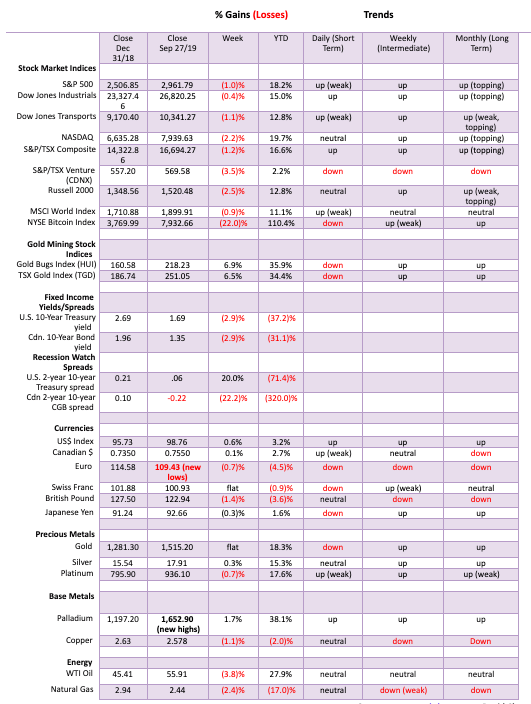

For the second week in a row, the S&P 500 fell, losing 1% this past week. The Dow Jones Industrials (DJI) lost only 0.4% while the Dow Jones Transportations (DJT) continued to underperform, falling 1.1%. The NASDAQ was hit harder, falling 2.2% thanks to Netflix (NFLX). The small cap Russell 2000 was down 2.5%. Notably, in the recent market rise the only index to make new highs was the Dow Jones Utilities (DJU). It remains near that high, but if the rest of the market falters then it too should fall. Elsewhere, the TSX Composite lost 1.2% while the TSX Venture Exchange (CDNX) continued its troubles, down 3.5%. In the EU markets, the London FTSE was actually up almost 1%, the best performer, but the Paris CAC 40 fell 0.9% and the German DAX was down 0.6%. In Asia, China’s Shanghai Index (SSEC) was down 2.5% while the Tokyo Nikkei Dow (TKN) dropped 0.9%. The troubled Hong Kong Hang Seng Index dropped 1.8% and seems poised to fall even further. The 4-year MA has been providing support (along with the 200-day MA) but the Hong Kong index appears poised to break both, plunging it into an official bear market.
The stock markets are being held up by whatever happens on U.S.-China trade. If it looks negative, then the market falls. If they are talking “nice” to each other, the market rallies. The most recent volley in that war is an attempt growing to prevent China’s companies from accessing the U.S. markets or at least to limit their access. Citigroup has called it an ‘’extreme potential American move.’’ Chinese companies on the major U.S. exchanges have a market cap of $1.2 trillion. It is just another layer of uncertainty. If China shifted its listings back to China, then that too would weigh on U.S. stock markets, causing them to fall. A shift to the Chinese companies raising their funds in Asia on Shanghai or Hong Kong would also pose a problem for the U.S. markets. Add in the currency war between the U.S. dollar and the yuan and things could soon get out of hand.
The impeachment process is also bound to weigh on markets, especially if it gets ugly as many expect it to. And, as we have pointed out, we don’t know what is going on the repo market but it could portend a large financial institution in trouble.
It is amazing how the S&P 500 neared the top of its broadening channel and now appears poised to break down. We have called this potential wave down either a C wave or an E wave depending on how the count has played out since what we believe was the nominal top way back in January 2018. That was the top that coincided with the outbreak of the trade war between the U.S. and China. This, despite a slightly higher high in October 2018 and another higher high in July 2019. Since they were all just slightly higher highs, we call these three thrusts to a final high, which normally turns out to be a very dangerous pattern. What follows is usually a sharp drop.
The bottom of the broadening channel is way down around 2,200 for the S&P 500 and the channel is falling. There also appears to be an ascending wedge and, if correct, it portends a decline to the December 2018 at a minimum.
Could we be wrong? Of course. The bulls would argue there’s no need to worry—just buy on these pullbacks. We are going higher. Right now, we’d say that could be correct if we could regain back above 3,000 and especially above 3,025. But we are perilously close to a breakdown. Under 2,900 would be the first negative and under 2,800 would confirm. Late summer tops in the market are not unusual and often that can bring us a scary October. If the technicals are correct, then the drop could be significant and play out into year-end or January.

The NASDAQ Composite appears poised to break its uptrend line. Leading the way could be the FAANGs (Facebook, Apple, Amazon, Netflix, Google). Netflix (NFLX) in particular has taken quite a tumble, down almost 32% from its recent highs. Facebook (FB) is down 15%, Amazon (AMZN) is down 15%+, Google (GOOG) could be making a double top even though it is down only 3% from a recent high and Apple (APPL) is still holding up, down roughly 5% from its recent high but also potentially making a double top. The NASDAQ Composite is down about 5% from its high. Netflix could be the canary in the coal mine. If the FAANGs can’t go up or they just falter, then the markets could be in trouble. Note the awkward-looking potential head and shoulders top forming on the NASDAQ. A break of 7,800 would confirm a breakdown underway.

We set the DJI against the backdrop of an inverted VIX volatility indicator. Both should move relatively in tandem. However, there are divergences. The VIX has broken its 50-day MA while the DJI has not. The VIX appears poised to break its uptrend line. The DJI has not, although it could be poised to break a level of support. When the VIX has broken its uptrend line over the past year or so the markets have tended to plunge quickly. So that bears watching.
Most other indicators we are following are still positive, including the NYSE advance-decline line, the McClellan Summation Index (RASI), although the TRIN has turned negative. Many are enamoured with the NYSE advance-decline that keeps heading into record territory. It is supposed to be a sign that the market will also keep on rising. But there have been instances in the past where the advance-decline was rising while the stock market lagged.

Consumer confidence in September, as represented here by the Michigan Consumer Sentiment Index, was at 93.2 in September, up from 89.8 in August and above the projected 92. All consumer indices came in higher than expected in September. That was reflected in consumer spending that jumped 0.4% in September following a revised 0.8% rise in August. The market had expected only a rise of 0.2%. If the consumer keeps spending, then the U.S. economy appears to be healthy. But to no surprise we note that consumer credit also jumped sharply. The last figure available was for July and it rose $23.3 billion, well above the expected rise of $16 billion. Irrespective of this, it is surprising to see such a strong consumer confidence number against the backdrop of growing financial instability and the potential impeachment of a president. But then maybe they are just not paying attention. We’ll see how October plays out.
U.S. Student Loans Owned and Securitized, Outstanding

Is it a bird? Is it a plane? Is it a straight line? It might be all of them. But no, it is student loan debt in the U.S. that has been on a straight-line trajectory for years. Student debt has doubled since 2009 and now sits at over $1.6 trillion. Much of it has been securitized, similar to the sub-prime loans of a decade or so ago. Of course, we know what happened to sub-prime loans when the proverbial stuff hit the fan. Delinquent student loans hit $166 billion in the 4th quarter of 2018 but it was understood that it was only about half of them, according to the Federal Reserve Bank of New York. That would imply that, in reality, over $300 billion is delinquent (that’s almost 19%) and it could be even higher now. The U.S. Treasury has disbursed over $400 billion in trying to help the market. Huge debts of student loans mean these students aren’t forming households, getting married, or anything. Many are stuck in low-paying jobs and are having trouble paying back their debt which they are not supposed to default on. It is the same in Canada but not as bad as the U.S. Tuition and costs of higher education do not hit the heights of the U.S. We were struck by the straight-line trajectory of student loan growth. For the record, the sub-prime mortgage market that collapsed wasn’t as large in 2006–2008 as student loans are today. Another area of growing concern is car loans, another market over $1 trillion and much of it securitized with rising delinquency rates as well.

World stocks, as represented here by the MSCI World Index (ex U.S.), look quite toppy. The index lost 0.9% this past week, but what’s worse, it appears to be forming a potential head and shoulders top pattern. We hate those downward sloping necklines but we have seen enough of them to not be too concerned. The breakdown comes around 1,780 and could project down to 1,635. Numerous international indices are looking toppy. We are not exactly seeing bottom patterns forming. Some, such as emerging markets, Hong Kong, and Singapore, look quite dangerous.

Isn’t it amazing how the TSX Composite hits the top of its channel and then turns down. The TSX Composite hit an all-time high at 16,947 which was effectively the top of a channel and then it turned south and has since fallen 1.5%. It appears poised to re-enter the sideways channel that formed from April to September. The breakdown point continues to appear at around 16,000. The TSX breaks an uptrend line around 16,400. If this fails, then the breakout to new highs would constitute a false breakout. False breakouts are not uncommon, but they do sucker a lot of innocents in. Naturally this failure is not as yet confirmed. New highs would change that in a hurry. But we are not optimistic of seeing new highs. We do note how volume spiked into the all-time highs as many became convinced we were embarking on a new bull run. Considerable caution is warranted for the Canadian market right now. But there will always be pockets that remain good. Income trusts, for example, were still making new highs this past week. Financials burst out to new highs as well a couple of weeks ago. But that too could be a false breakout. A break back below 305 for the TSX Financials would be a negative sign. The TSX Venture Exchange (CDNX) continues to look rather miserable, but then the stocks there are overlooked, ignored, and cheap.

We have been fascinated as to how Bitcoin appears to be tracking the Dow Jones Industrials (DJI). Or is it the other way around? No matter. Bitcoin fell sharply this past week. The DJI was down but not what we could consider sharply. When Bitcoin was crashing into its December 2018 low the DJI followed. Could Bitcoin be crashing again? And the DJI will follow? Amazing as to how they seem to top and bottom together. Bitcoin did fall 22% this past week. There are still over 2,900 different cryptocurrencies listed at Coin Market Cap (www.coinmarketcap.com). The market cap of all cryptos is $216.5 billion and Bitcoin at $146.5 billion represents an astounding 67.6% of the market. The top three cryptos—Bitcoin, Ethereum, and XRP represent 81% of the market. There remain 12 cryptos with a market cap of over $1 billion. Even our favourite Dogecoin is the 29th largest with a market cap of $269.3 million.

The U.S. 10-year Treasury note fell in yield this past week from 1.74% to 1.69%. We believe that yields bottomed in August at 1.47% and the jump to 1.90% was the first wave up of a possible five wave advance for bond yields. The second wave may have completed at 1.64%. A break above 1.80% could set in motion the third wave up. There is considerable resistance up to 1.95% to 2.10% to 2.15%. Despite all the action in the overnight repo market, that doesn’t necessarily impact yields on longer dated securities. There has been considerable weakening in the junk bond market and bonds poised to move from the lowest investment grade to junk bonds. That could spark a wave of selling. As well, with China not participating in U.S. treasury auctions, that is putting pressure on others to make up the difference. Low interest rates and waning demand help push down prices and increases yields (yields move inversely to prices). So, rather than lower yields, we could soon be seeing higher yields which in turn could spark trouble in the bond market, especially with bond funds that might have been playing for lower interest rates and rising prices. Unless, of course, they are happy to hold them to maturity.
Recession Watch Spread

The closely watched 2-year—10-year spread was largely unchanged this past week at 6 bp vs. 5 bp the previous week. Negative spreads were short-lived. While negative spreads usually preceded a recession, it was when the spread stared to rise again that a recession was more likely. The 2–10 spread was barely negative at all so it is possible that this spread could fall once again.
Recession Watch Spread 2

The 10-year U.S. treasury note 3-month treasury bill (3M—10 spread) spread has become even more closely watched than the 2–10 spread. After hitting a low of negative 52 bp, it has been rising and is now only at negative 11 bp. As we have noted, while negative spreads have preceded recessions, it was when the spread began to turn positive again that a recession actually set in. We are not positive yet, but we are getting there. A firm break into positive spreads could send this one higher quickly as the 10-year rises in yield and the short term 3-month falls in yield with the Fed cutting interest rates.

With the U.S. dollar rising against many currencies it is difficult to imagine gold continuing its upward traction (see gold below). The US$ Index rose 0.6% this past week to 98.76. That’s shy of the recent high of 99.33. There is potential to move higher in the channel to new highs at 99.50. The loser was the euro where negative interest rates and a slowing economy relative to the U.S. continue to plague them. Brexit doesn’t help either as, while it hurts the U.K., it will also hurt the euro zone. The euro fell to new 52-week lows, losing 0.7%. The Swiss franc showed some resilience and was essentially flat. The Brexit-challenged pound sterling lost 1.4% while the Japanese yen fell 0.3%. The Canadian dollar managed to eke out a gain of 0.1%. A high U.S. dollar continues to hurt all the debt outstanding in U.S. dollars held by foreign entities. They borrowed in U.S. dollars but their revenues are in their falling home currency while they have to pay back U.S. dollars that are rising in value. Chinese companies are particularly vulnerable even as the yuan is somewhat pegged to the U.S dollar. Despite that, the yuan has been weakening against the U.S. dollar and if the yuan were set to trade freely it would most likely fall even further. While the US$ Index is trading at the upper end of its channel it still has room to move higher. A breakout over 99.50 could set up an even higher move to the top of the next channel near 100.80. Breakdown appears below 98 but a more serious breakdown does not get underway until below 96. Peace on the trade front and a U.S. economy that continues to outperform both the EU and Japan are the prime reasons the U.S. dollar remains relatively strong.

Gold prices are looking toppy here. Gold could be forming a head and shoulders top pattern. If so, it is sitting on the cusp of a breakdown. The breakdown point is at $1,490 (futures) and potentially projects down to $1,415. That would set up a good test of the multi-year breakout and probably bring sentiment for gold down into the teens if not lower. Gold spiked this past week to $1,543 but it failed as trade talks between the U.S. and China became more optimistic and the U.S. dollar rose. A fall to $1,415 would represent a $151 decline or about 10% from the high at $1,566. And it would represent roughly a 50% correction of the rise from $1,267 in May to the peak at $1,566. We note that the 100-day MA is currently at $1,424 and the 165-day exponential MA is at $1,410. A test of that zone would not be unusual. Seasonally gold tends to be soft into October, November, and even December before rising into the first two or three months of the New Year.
Gold was flat this past week while silver gained a mere 0.3%. Platinum fell 0.7% but palladium continued its recent strong run to new all-time highs with a 1.7% gain on the week. Copper, a sign of strength or weakness in the economy, fell 1.1%.
The gold stocks have been falling and falling gold stocks is often a sign that the market has reached a top; in this case, we hope, a temporary one. We doubt that the rally that began May is over just yet. We have noted that gold fell for four years 2011-2015 (A wave down) and then was up, but in a consolidation pattern for another three years (2016-2019) for the B wave. We have, we believe, embarked on the C wave up. This should play out for at least a couple of years and could take gold prices to new all-time highs. Our minimum target is $1,725. Given the high sentiment and record managed futures a pause here would refresh rather than be a killer. Only a break back above $1,535 would suggest to us that a new up leg might be underway.

The gold commercial COT remains bearish. It fell to 24% this past week from 25%. Long open interest did rise about 500 contracts but short open interest rose about 27,000 contracts. The large speculator COT (managed futures, etc.) rose to 86% as long open interest jumped roughly 29,000 contracts. Managed futures traders were holding a record net long position. Sentiment was routinely over 90% at the recent high. The COT is telling us to be cautious right now on the precious metals.

Despite the negative look of the silver chart, silver prices were actually up 0.3% this past week. However, the price spiked and immediately came right back down, falling over 6% from the spike high of $18.81. Silver is down 10.6% from the $19.75 high seen in August. However, it is up 23.6% from the May 2019 low. Silver is currently finding support at the 50-day MA. But a solid break under that level (currently at $17.47) should send silver prices to the 100-day MA near $16.20. Ultimate targets could be down to the uptrend line near $15.75. That level would represent a 73% retracement of the move from May to August. Harsh but not unusual. Real danger only comes with a break of $15.75 and ultimately back under $15.50. That would be dangerous and suggest that the May low of $14.27 could fall. We need to regain back above $18.50 to suggest higher prices.

We love to show this chart as a reminder of just how much the purchasing power of a $ has been lost. It would show the same in Canadian dollars as well. Setting aside the downward spike during the U.S. civil war, the real collapse of purchasing power got underway after the devaluation of 1934 and the end of Bretton Woods in 1971. For many years $1,000 would get around 50 ounces of gold. Of course, not many had $1,000 back in those days. Today, millions of people have $1,000 but that will only get you 0.66 ounces of gold, as the result of monetary inflation. Far too much money (fiat currency) and not enough gold (hard currency). Gold prices have generally moved higher as inflation has moved higher. By many measurements, the price of gold should be at least over $2,000 now just to keep up with inflation. Until gold was set free following the demise of Bretton Woods, it was kept artificially low as it was used as a peg to the U.S. dollar even if the peg did not make sense. A good reason as to why it collapsed.

The silver commercial COT remains bearish. This past week it was unchanged at 33%. There was little change in the open interest with long open interest up maybe 300 contracts while short open interest fell just over 500 contracts. The large speculators COT did slip to 68% from 71% so that is a positive development. We note that they increased their short open interest position by roughly 4,700 contracts while long open interest fell about 600 contracts.

The TSX Gold Index (TGD) gapped down on Friday and wound up losing 3.7% on the week. The Gold Bugs Index (HUI) fell 3.5%. We could make an argument that the TGD is forming a symmetrical triangle, or it could be forming a head and shoulders top. Symmetrical triangles can be consolidation patterns or they can form at tops and bottoms. The key levels to watch here are first 235 then 230. A break below 235 could target down to 185 while a break of 230 could target down to 190. Either way, both are signaling a potential sharp drop ahead. There are, however, potential areas of support at 220/225 and again at 205. The former level appears to represent minimum targets. That would represent just over 50% of the move from the May low at 177 to the peak near 273 in August. No matter how we look at them, the gold stocks appear to be headed lower. Only a breakout above 255 and preferably over 260 would suggest that the uptrend has resumed. Sentiment was quite high at the recent peak for the gold stocks; however, it wasn’t a record. We’d like to see sentiment fall rapidly on this pullback.

Since spiking a couple of weeks ago after the drone attack on the Saudi Aramco fields—an attack that supposedly took offline some 5%+ of the world’s oil supply—oil prices have swiftly fallen back to earth. This past week WTI oil fell 3.8%. Natural gas did not fare any better, falling 2.4%. The oil indices quickly joined them as the NYSE Arca Index (XOI) dropped 2.4% while the TSX Energy Index (TEN) fell 3.4%.
There appear to be at least a couple of reasons why the price fell. First the Saudis, announced that they should be back online by the end of the month. That’s an amazing feat considering the accusations against Iran as the culprit with no one offering any real proof. It is also amazing considering the supposed damage done. Second, the Saudis have announced a partial cease-fire in Yemen. It was the Houthis of Yemen who declared they were responsible for the drone attack—except that nobody believed them. Over the past few years the Saudis have waged an endless war since 2015 against the Houthis, who are Shia Muslim backed by Iran, in defense of the Sunni government of Yemen backed by the Saudis. Both the Houthis (Shiites) and the Sunnis claim to be the government of Yemen. The Saudis lead a coalition of Sunni states plus the pro-Hadi (Sunni) government of Yemen and are backed by U.S. and French commands. The Houthis (Shiites) are supported by Shia Iran and have some support from Russia. The war has caused a humanitarian crisis where over 85,000 children have died and over 90,000 have been killed, mostly civilians, compared to only 500 killed in Saudi Arabia plus over 1,500 killed from the Saudi coalition. There has also been a cholera outbreak.
Any cessation of the war would cause the price of oil to soften. And while the rhetoric has been high against Iran, the odds of a war are slim to none although economic sanctions will strengthen. However, both Russia and China are helping the Iranians get around economic sanctions.
WTI oil sits on the cusp of a possible breakdown. A firm break below $55 would target $50 while a breakdown under $50 could send WTI oil down into the low $40s. Seasonally, oil is in a soft spot as the strong season for oil prices does not get underway until at least December. The failure following the drone attack indicates that oil prices are more likely to fall rather than rise.
Chart of the Week

Here is a chart of repo rates over the past couple of years. The repo rate generally tracks the effective Fed funds rate or the Fed overnight rate. The repo market is a key important market for the financing of inventories of U.S. treasury securities and many other securities. But if the lenders are fearful of something in the financial system, funds may dry up.
The spike at year-end is typical as everyone scrambles to have their positions covered. As a long-time money market dealer, it was not unusual for me to see overnight lending rates spike at year-end even back into the 1970s, 1980s, and 1990s when I worked on institutional money market desks. But the current spike is very unusual and could signal a problem in the market.
The chart below shows the reserves of depository institutions vs. the U.S. monetary base. As the Fed conducted QE1, 2, and 3 along with lowering interest rates to zero the U.S. monetary base grew as did bank reserves. The growth in bank reserves told us that rather than lending funds out into the market the banks were hoarding their cash as reserves because of a better rate paid. As the Fed began hiking interest rates and beginning to unwind QE, it wasn’t a surprise that the monetary base fell as did bank reserves. Money into the system, money out of the system.
If we are right that the current repo operation is actually a return to QE (Let’s call it QE4), then we should soon see bank reserves and the monetary base rise. But what if they don’t?
Total Reserves of Depository Institutions/St. Louis Adjusted Monetary Base

But, as we surmised in our main essay, what if there is a problem somewhere? We noted Deutsche Bank. There apparently has also been a high rate of cash hoarding in Germany, mainly U.S. dollars. Deutsche Bank, as we noted, has a huge derivatives portfolio which is closely linked to U.S. banks who also have huge derivative portfolios (JPMorgan Chase, Bank of America, Goldman Sachs, Citigroup, and Morgan Stanley).
All of those bank stocks are under pressure. Surprisingly, Wells Fargo that we also highlighted earlier does not have a huge derivatives portfolio. Recall that, in the 2008 financial crisis, AGI the giant insurance company blew up because of credit default swaps that were out of the money but suddenly in the money and AGI couldn’t pay. That alone sparked a liquidity crisis and the Fed was forced to ride to the rescue. Repo operations by the Fed had actually started before the onslaught of the 2008 collapse of Lehman Brothers and AGI. So, what is happening now? That is the question. Irrespective of this, we can’t think of a better description than to “buckle up.” Something is going on, and we confess we don’t know what. Maybe it’s a tempest in a teapot. But then again, maybe not. October could prove to be interesting and volatile.
__
DISCLAIMER: David Chapman is not a registered advisory service and is not an exempt market dealer (EMD). We do not and cannot give individualized market advice. The information in this article is intended only for informational and educational purposes. It should not be considered a solicitation of an offer or sale of any security. The reader assumes all risk when trading in securities and David Chapman advises consulting a licensed professional financial advisor before proceeding with any trade or idea presented in this article. We share our ideas and opinions for informational and educational purposes only and expect the reader to perform due diligence before considering a position in any security. That includes consulting with your own licensed professional financial advisor.


Youth Cannabis Use in Colorado Is Falling — But the Full Story Is More Complex
The 2026 Colorado survey shows teen cannabis use fell to 10 percent in 2025, down from 21 percent in 2015....


Morocco’s Growth Holds at 4.6% as Agriculture Offsets Economic Pressures
Morocco’s economy grew 4.6% in Q1 2026, driven by a strong agricultural rebound offsetting declines in industry. Services expanded moderately...


Abivax Shares Surge as New Trial Data Eases Safety Concerns Over Ulcerative Colitis Drug
Abivax shares surged nearly 36% after positive updated trial results for its ulcerative colitis drug obefazimod reassured investors following earlier...


El Dorado Raises $9M to Expand Cross-Border Fintech Platform
El Dorado, a Latin American fintech improving cross-border financial services, raised a $9 million Series A led by Paradigm with...


Bitcoin Stalls Near $60K as Strategy Moves, ETFs Outflow, and EU MiCA Rules Take Effect
Bitcoin hovers near $60,000 with ETF outflows, while Strategy boosts reserves, sells BTC, and raises dividends to reassure investors. Ethereum...
 |
|
 |  |
 |
|
-

 Biotech2 weeks ago
Bavarian Biotech Sector Expands with Record Funding and Startup Growth in 2025
-

 Africa2 days ago
BOAD Approves Major Funding Boost to Drive West African Development
-

 Business1 week ago
Markets Diverge as Oil Falls, Rates Hold, and Inflation Persists
-

 Impact Investing6 days ago
Coastal Cities Lead as Heat Strains Italy’s Urban Livability