Featured
Currency wars: Stock markets plunge, gold soars
Bond yields fall and the yield curve inverts more. History is littered with trade wars and currency wars. But negative yield bonds? $15 trillion and counting. Gold is making new all-time highs in at last count 72 currencies. But is it gold rising or currencies falling? It’s the latter. We live in either fascinating times or dangerous times. It leans towards the latter.
And so it goes. The “tweeter in chief” followed up that tweet with even more bashing of China—how they steal hundreds of billions from the U.S. through unfair trade practices, and how they steal U.S. business and factories, hurt jobs, depress worker’s wages, and harm farmer’s prices. Trump then continued to bash the Federal Reserve, once again telling them they have to drop interest rates right away and take action to lower the value of the U.S. dollar.
Trump should also tell his economic adviser Larry Kudlow and his Treasury Secretary Steve Mnuchin that as well. Kudlow has said the administration would not undertake currency intervention. Mnuchin has refrained from calling China a currency manipulator. Someone should also remind Trump that it is the U.S. consumer that is paying for his tariffs. China’s retaliation has hit the U.S.’s breadbasket hard as China found its soybeans elsewhere. In its place, the U.S. has had to provide upwards of $16 billion in subsidies to keep America’s farmers quiet. Trump has tied Huawei to China’s purchase of U.S. agricultural goods. It’s a never-ending game with negative consequences all around.
It is not as if this is the first time that China has adjusted their currency. They did it in August 2015 and December 2015. Each time the Dow Jones Industrials (DJI) fell 10% or more. So, what happened this time? The DJI promptly fell over 800 points. But is China really a currency manipulator? Or is it simply adjusting its currency? Only around 1% of global trade is carried out in yuan even though China accounts for 15% of global trade. As well, China’s trade with the U.S. represents only about 18% of its total exports. China trades almost as much with Hong Kong as they do with the U.S.
But what if China were to just float its currency? If that happened, the yuan is likely to fall further, not rise. Trade matters but capital flows matter even more. China always had a quid pro quo relationship with the U.S: the U.S. buys China’s exports, China buys the U.S. debt. As of May 2019, China held $1.1 trillion of U.S. treasuries. Okay, that’s down from almost $1.2 trillion in May 2018. But China is still number 1 in holdings of U.S. Treasuries. Overall, foreign holdings of U.S. treasuries are up over $300 billion in the past year. The U.K. and others have picked up the slack, given that China is largely absent from U.S. Treasury auctions these days.
Chinese Yuan (US$/Chinese Yuan)

As if on cue, the stock market fell from what appears as the top of a large broadening top pattern. The S&P 500 also appears to be breaking down from a large ascending wedge pattern. The NASDAQ and DJI are also breaking down, although the breaks are not as yet conclusive. The S&P 500 found support just above the 200-day MA and rebounded. Key would be a break of the June 3 low of 2,728 S&P 500, 24,680 DJI, and 7,298 NASDAQ. The S&P 500 seems destined to fall to the bottom of a broadening channel near 2,200. That’s a further 25% decline from current levels.
It has been a volatile week as U.S. treasury yields plunged, stocks fell and then rebounded, and gold shot to new highs above $1,500. Silver finally joined the party and soared over $17. While the U.S. dollar was down, it was not falling rapidly as many would think. So far, its key supports have held. The pound sterling remains weak as does the euro but both the Swiss franc and Japanese yen moved higher. Both gold and silver saw their daily sentiment indicators (DSI) soar well past 90%. That is usually the sign of a potential top, not the start of a major move.
What is going on? Is it a race to the bottom? U.S. treasury bond yields plunged and spreads are becoming more negative even as there appears to be no imminent recession in the U.S. Then three Asia Pacific central banks surprised everyone by slashing their key bank rates. New Zealand led the way with a half-point cut to 1.00%, Thailand dropped theirs by a quarter point to 1.50% while India slashed theirs 35 basis points to 5.40%. Is this just another volley in currency wars?
The 10-year U.S. Treasury note fell to as low as 1.60% before rebounding to 1.74%. A weaker than expected 10-year auction helped push the yield back up. The record low is 1.37% seen in July 2016. The 30-year Government of Canada closed at a record low of 1.48% on Wednesday. A week earlier it was 1.74%. The U.S. 2-year–10-year spread is still positive at 11 basis points, but the 3-month Treasury bill 10-year spread is getting more negative, now minus 31 basis points. The Canada 10-year–2-year spread is now negative 11 basis points. Inverted yield curves have often proven to be precursors of a recession.
S&P 500 – Down we go?

But the really scary stuff is in the negative yield bonds. It was only a week ago we were noting that negative yield bonds were $14 trillion. Forget that. They’re now $15 trillion. As one pundit said, this is “a race to hell.” What was once considered “economic lunacy” has now become “economic normalcy.” The number of negative yield bonds has grown exponentially since the Fed announced it would no longer tighten or as it became known the “Powell pause.” Not only are there negative yielding government bonds but also corporate bonds and even some euro junk bonds. The German 30-year bund slipped briefly into negative territory this past week, marking the first time that all German government bonds were negative yields. Swiss 30-year bonds currently yield negative 0.322% and they have been negative since mid-2016.
There are now 12 countries with negative yield bonds – Germany, Switzerland, Denmark, Netherlands, Sweden, Austria, France, Finland, Belgium, Japan, Slovakia and Slovenia.
Why so many with negative yield bonds? This is not how a global economy is supposed to function. But at the bottom of it all lies the faults with the central banks, the China-U.S. trade war, deflationary technology and shifting global demographics. Governments (and even corporations) are being paid to borrow money. We’d hate to think what would happen if interest rates started to rise, but mega bond collapse comes to mind.
The insanity of it all has seen the number of global junk bonds grow because of the low cost of borrowing. There is an estimated $1.2 trillion of junk bonds outstanding in the developed countries. And that is not even counting economic sovereign basket cases like Argentina, Turkey, Ukraine, Zambia, and others.
Market cap negative yield bonds

“As global yields continue to fall, and in some cases turn negative, there appears to be a direct correlation between global net negative yielding debt and the price increase in gold, highlighting that as yields decrease, the opportunity cost of holding gold decreases making it more attractive.” —World Gold Council
With stock markets wavering, bond yields plunging, and negative yield bonds growing, no wonder gold is looking the best since 2009–2011 when prices soared from $680 in October 2008 to over $1,900 by September 2011. Grant you, the gold crash was a shock to the gold bugs as the price collapsed to $1,045 by December 2015. Gold crossed $1,500 this past week hitting a high of $1,523.
But gold crossing $1,500 in U.S. dollars is only a part of the story. The real story is gold hitting new all-time highs in, at last count, 72 currencies. Included are the Canadian dollar, Australian dollar, pound sterling, Japanese yen, Russian ruble, and possibly significantly, the Indian rupee. Global-backed gold ETFs are also seeing record flows. Gold is rising in all currencies, not because gold is rising, but because fiat currencies are falling vs. gold and silver. Central bank buying continues as a record 651 metric tonnes was purchased in 2018 and buying continues into 2019. The central banks of both Russia and China continue to add to their reserves. Both Russia and China continue their quest to diversify away from the U.S. dollar.
Gold – The big breakout

Gold has broken out of a multi-year basing pattern. It formed what appears as a huge multi-year head and shoulders bottom pattern. The pattern has a projection to $1,725. Gold fell for four years from 2011–2015, then based for another four years from 2015–2019. It is highly unlikely that this rally is three months and done. Gold’s 23–25-year cycle low is not due until 2023–2025 based on the last major double low of 1999 and 2001. That cycle breaks down into three 7.6-7.8-year cycles. Again, based on the 1999–2001 double bottom low, the first low was seen in October 2008 and the second one in December 2015. That puts the current cycle on target for mid- to late-2023. In the interim, our targets could be seen as could sharply higher prices.
Gold is reacting to a breakdown in confidence of governments, central banks, and fiat currencies. The monthly RSI is over 70; however, that doesn’t imply an imminent breakdown. For this current up-move, targets could be higher—closer to $1,600 before a correction sets in. For gold stocks, the targets could also be sharply higher. Junior exploration stocks that primarily trade on the TSX Venture Exchange are just beginning to come to life.
Gold in currencies

Could we see another 50% plus collapse in the stock market? The thought cannot be treated lightly. Since the world came off the gold standard, such as it was, in August 1971 we have come through five major recessions: 1973–1975, 1980–1982, 1990–1991, 2000–2002, and, 2007–2009. On three of those occasions the stock market fell 45% or more. A reminder that the past ten years have witnessed the most prolific growth in debt ever seen and the easiest monetary policy ever recorded. Yes, the stock market has done well, but is that because of fundamentals or is it because of massive liquidity (debt), capital inflows, and speculative bubbles?
The Buffett Indicator suggests that stocks have rarely been so overvalued. The Buffett Indicator measures the market cap of corporate equities to GDP (U.S.). At a current level of 146.4%, it is not far from the peak seen in 2000 at the height of the dot.com/high-tech bubble. The indicator was lower at the top of the housing bubble in 2007, yet the stock markets still fell over 50%. It took massive amounts of liquidity injections (quantitative easing) and massive amounts of debt to prevent what might have turned into another Great Depression. Keep in mind that this is an indicator only. It is not a sell signal; however, it would seem to urge caution.

If one adds in inverting yield curves, negative yields on bonds, massive debt, rising gold prices (falling currencies), trade wars, sanctions, military maneuvering along the Russian border and the South and East China Seas, along with the negative effects of global warming, the potential for an accident is rising. It takes many years for a speculative bubble to build. It can be wiped out in a very short time. Bull markets can last for years. Bear markets can wipe you out in a couple of years. Since 1900, the average bull market has lasted 772 days but the average bear market is over in 422 days (Stock Trader’s Almanac – 2019), with many bear markets being short, swift, and devastating.
The warning signs are there. But are they being heeded?
Quick market update
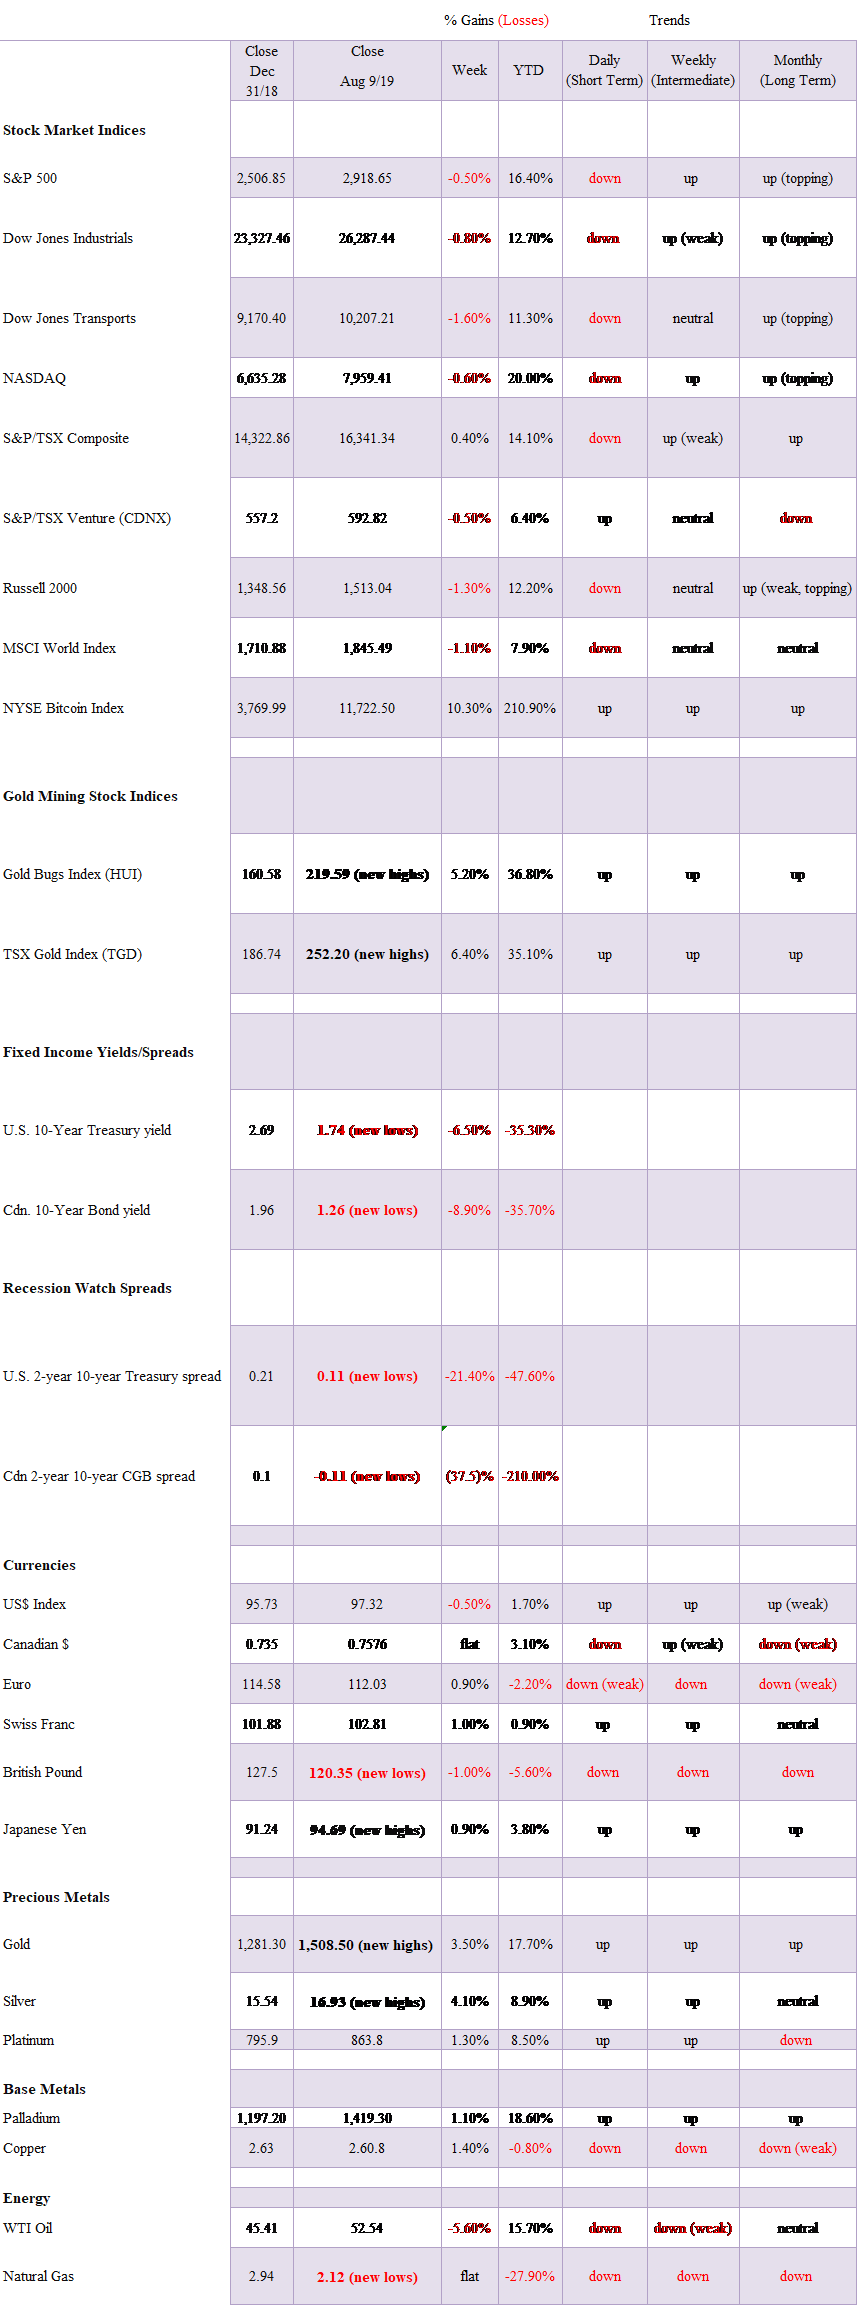
It was a whipsaw week that saw stock markets fall sharply following the Chinese yuan devaluation, then come right back. The bounce-back has the look of corrective rebound. Stock markets, including the DJI, S&P 500, and NASDAQ ended the week testing the 50-day MA. Some indicators such as the VIX volatility indicator spiked, but are nowhere near levels that would indicate a low. The put/call ratio spiked to more puts than calls but before a low is seen it typically spends several weeks with an imbalance of puts to calls. The McClellan Summation Index (ratio-adjusted) (RASI) fell under 500 for the first time since June. The NYSE advance/decline line is turning down. Sentiment is no where near levels that would suggest a low. It is far too early to call a low and our suspicion is the snap-back seen this week is a “suckers” play to bring people back in. The TSX Composite outperformed this past week thanks to a strong up week for gold and mining stocks. The market doesn’t get extremely dangerous until the June lows are taken out. For the S&P 500, that level is seen at 2,728. So far, the 200-day MA (2,792) has acted as support with the 50-day MA acting now as resistance (2,936). Short-term trends have turned down and the intermediate weekly trend is weakening.
Gold, silver, and the gold stocks as represented by the Gold Bugs Index (HUI) and the TSX Gold Index (TGD) all made new 52-week highs this past week. But a cautious note is the very high sentiment indicators that were well over 90% for both gold and silver and an 87.50 reading for the Gold Miners Bullish Percent Index. No, that is not at 100 that was seen at the top in July 2016, but it is in cautious territory, suggesting no new buying and selective profit-taking. The commercial COT for gold fell to 23%, the lowest level seen in months—striking another note of caution. We still have potential targets of up near $1,580–$1,600 for gold and up towards $18 for silver before this market tops. Seasonals are also working against gold and silver, but once this period is over both tend to be strong from December to March when another leg up could get underway.
Markets and trends
__
DISCLAIMER: David Chapman is not a registered advisory service and is not an exempt market dealer (EMD). We do not and cannot give individualized market advice. The information in this article is intended only for informational and educational purposes. It should not be considered a solicitation of an offer or sale of any security. The reader assumes all risk when trading in securities and David Chapman advises consulting a licensed professional financial advisor before proceeding with any trade or idea presented in this article. We share our ideas and opinions for informational and educational purposes only and expect the reader to perform due diligence before considering a position in any security. That includes consulting with your own licensed professional financial advisor.


Youth Cannabis Use in Colorado Is Falling — But the Full Story Is More Complex
The 2026 Colorado survey shows teen cannabis use fell to 10 percent in 2025, down from 21 percent in 2015....


Morocco’s Growth Holds at 4.6% as Agriculture Offsets Economic Pressures
Morocco’s economy grew 4.6% in Q1 2026, driven by a strong agricultural rebound offsetting declines in industry. Services expanded moderately...


Abivax Shares Surge as New Trial Data Eases Safety Concerns Over Ulcerative Colitis Drug
Abivax shares surged nearly 36% after positive updated trial results for its ulcerative colitis drug obefazimod reassured investors following earlier...


El Dorado Raises $9M to Expand Cross-Border Fintech Platform
El Dorado, a Latin American fintech improving cross-border financial services, raised a $9 million Series A led by Paradigm with...


Bitcoin Stalls Near $60K as Strategy Moves, ETFs Outflow, and EU MiCA Rules Take Effect
Bitcoin hovers near $60,000 with ETF outflows, while Strategy boosts reserves, sells BTC, and raises dividends to reassure investors. Ethereum...
 |
|
 |  |
 |
|
-

 Biotech2 weeks ago
AseBio 2025 Report Highlights Growth and Future Potential of Spanish Biotechnology
-
 Cannabis5 days ago
Tilray (TLRY) Falls as Bearish Momentum Persists Despite Marketing Push
-

 Biotech1 week ago
New Gene Therapies Transform Rare Disease Care, but Gaps Remain
-
 Biotech2 hours ago
Abivax Shares Surge as New Trial Data Eases Safety Concerns Over Ulcerative Colitis Drug