Featured
Are Things Getting Grim in the Banking Sector?
The banks broke below their BEV -50% line in mid-May, as banks in Silicon Valley had runs on them, recovering to their BEV -35% line since then, but closed the week just a tad over their BEV -40% line. Let’s look at that May BEV -50% bottom. What’s notable, is ten weeks earlier, late February, these banks were at their BEV -20% line. A 30 BEV point decline in only ten weeks, is a big decline.

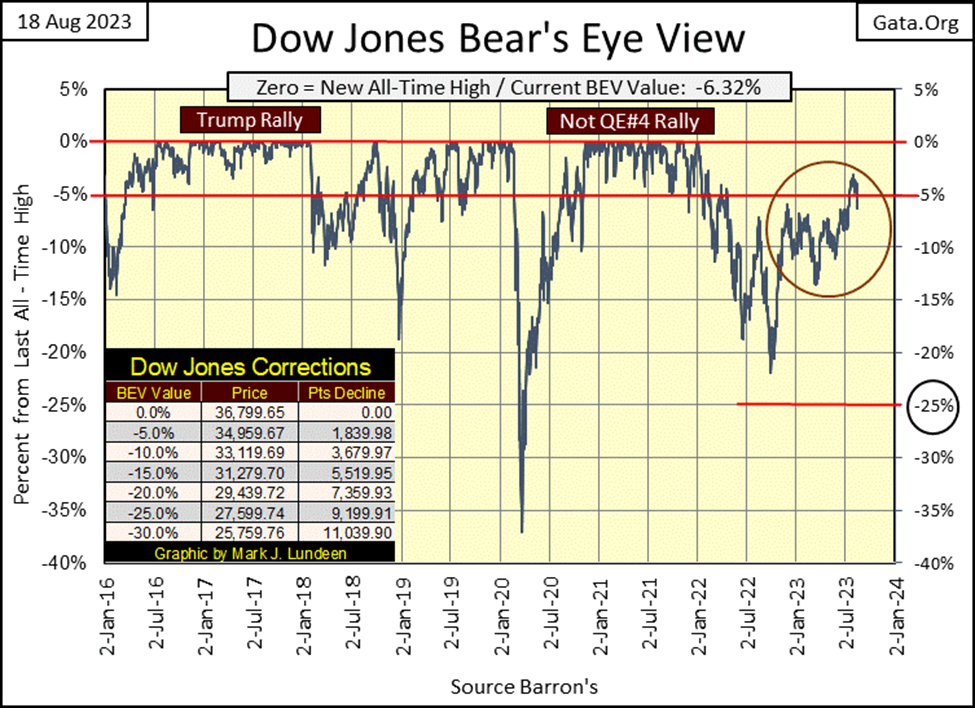
Last week with a BEV of -4.13%, the Dow Jones closed in scoring position. This week it gapped down to a BEV of -6.32%, which isn’t in scoring position. Is this just a correction, a pause that refreshes before the Dow Jones once again makes another assault on market history, with its first BEV Zero since 04 January 2022? Yes, it could be. But studying the plot within the red circle, I get the feeling these aging bulls are getting tired, in need of a rest.
Each week the idiots pull more “liquidity” from the financial system, and have been doing that since May of 2022. “Liquidity” is the juice that makes Wall Street’s bulls run wild. For as long the idiots continue with their QT, I can’t make a case where we see much action that could be called bullish in the stock market.
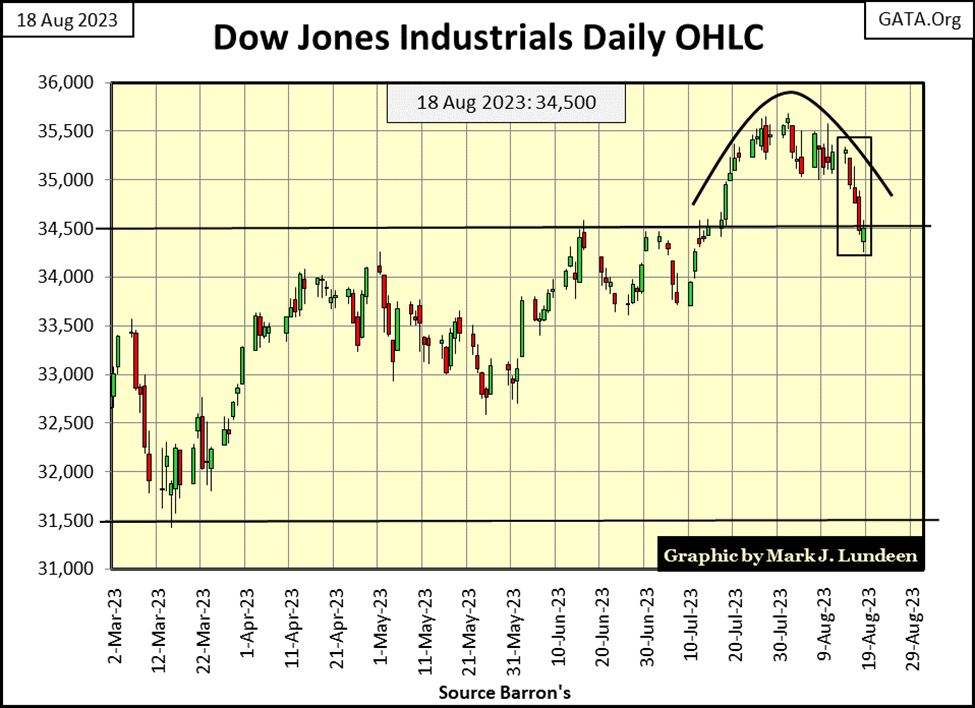
Below, the assault on 35,500 didn’t take long before it pooped out – one month. Seeing the Dow Jones closed the week at its old resistance level of 34,500 is a bit of a disappointment, or should be if one is a bull on the stock market.
I feel obligated to remind everyone that the market can do anything, at any time. The Dow Jones is not all that far away from making a new all-time high; a close above 36,799, is only 6.32% BEV points away. Could this happen before the first Friday of September? Yeah, it could.
But looking at these two charts, the Dow Jones’ BEV above, and its daily bar chart below, I’d say the Dow Jones hasn’t a snowball’s chance in Hell of doing that. More valuation deflation for the Dow Jones is most likely in the foreseeable future.
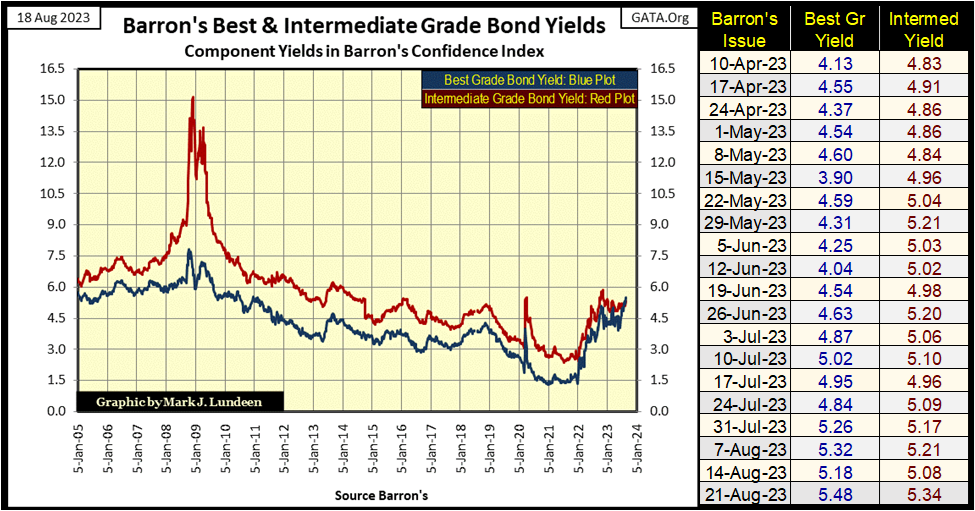
The fact that corporate bond yields continue rising doesn’t help the bulls. You heard this here first; Barron’s Best-Grade Bond Yields have increased to where they were in July 2010. Their Intermediate-Grade Bond Yields are approaching their highs of last November; 5.85%.
How much longer before we see the second bear-market yield spike in these bonds below?
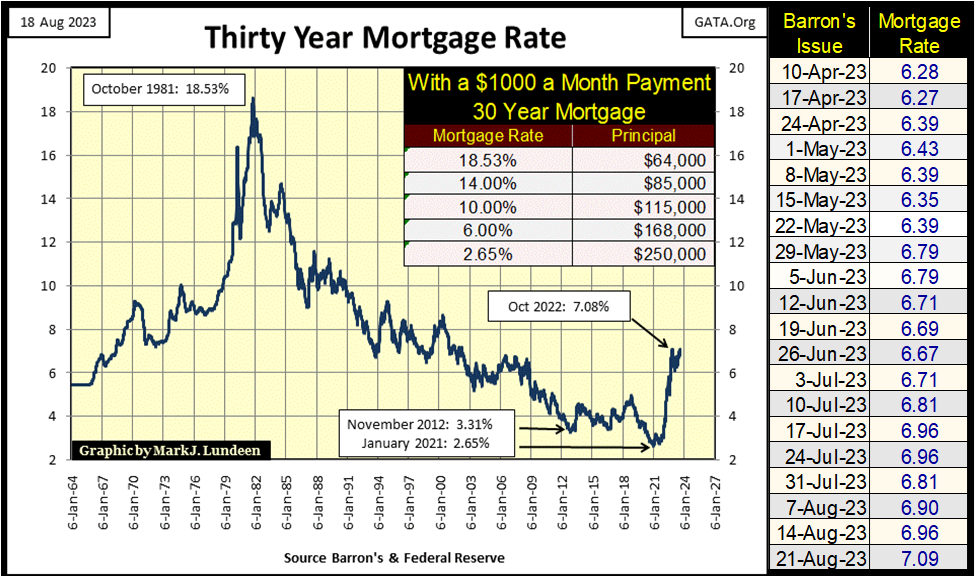
Mortgage rates continue rising (chart below). This week mortgage rates closed above their highs of last October. Not by much, only 1 basis point. Nonetheless, a new high in mortgage rates not seen since 2001, and that can’t be good if you’re a bull.
Real estate today is a mess. Thanks to the Covid hoax, commercial real estate is being abandoned, as everyone is shopping online. For single-family housing; this chart below is a tale of woe. With mortgage rates increasing from 2.65% in January 2021, to 6% not all that long ago, the available pool of money for the banks to make mortgages has contracted by: ($168,000 / $250,000)-1 = 32.8%. With mortgage rates closing this week at 7.09%, its worse than that.
In days gone by, I’d see for-sale signs outside peoples’ houses, popping up now and then as I drove down the road. Thinking about it, I haven’t seen a for-sale sign outside someone’s home for a long time now.
I have a friend who wants to sell her house, but she is still living in a world where mortgage rates are at 2.65%. Real estate agents have moved on to our world of 7% mortgages, for only those who qualify. They’ll list her home at her asked price, but they know it won’t move because with today’s higher mortgage rates, the money is just not there.
If she would reduce her asked price by above 32.8%, she’d get action. But people who don’t understand markets, refuse to understand why they can’t sell their homes at a price they think is fair. Let me tell you something about the world we live in; since day #1 it was round, not for a single day was it ever fair. Valuations for single-family homes will only go lower as mortgage rates continue to climb. The math only becomes harder as this bear market progresses.
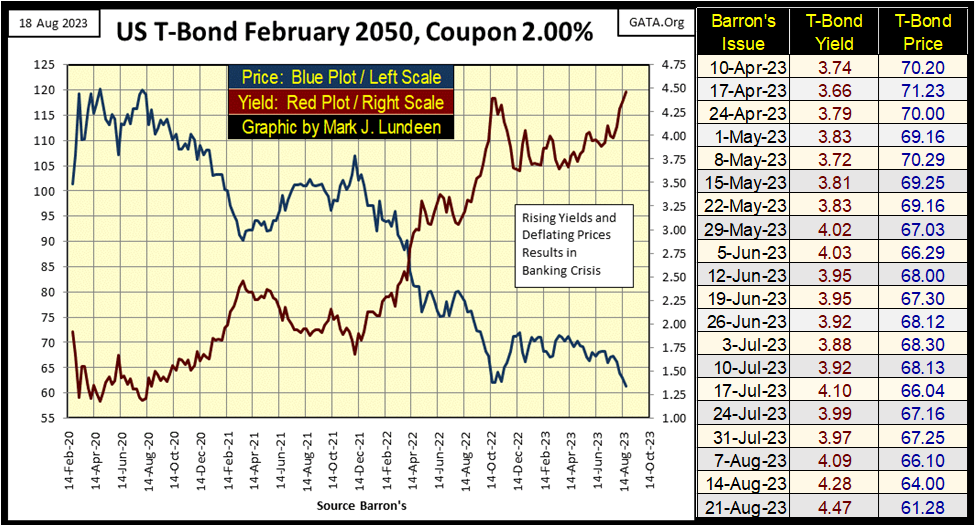
The yields for the long US T-bonds continue rising. This 30Yr bond issued in February 2020 (below), saw its yield close the week at its all-time high, and that isn’t good for most things trading on Wall Street.
If you take this bond’s valuation (Blue Plot) at its August 2020 top; 120, with this week’s close of only 61.28, this T-bond’s valuation has deflated by 48.93% in the past three years. Let’s call that 50%. Speaking for all the widows and orphans out there, whose financial advisors placed their life’s savings into the “security of Treasury debt” – ouch!
When is this going to stop? I’ll give you a hint; looking at the big spenders running Washington DC and the scammers running Wall Street – this isn’t going to stop anytime soon. For what it’s worth, my advice would be to get ready for things to get much worse in the not-too-distant future.
Taking all the above into consideration, is it any surprise seeing the major market indexes I follow below continue deflating? On Monday’s close, we see four indexes in scoring position. Not so on Friday’s close. The NASDAQ Banking Index (#20 below) is once again below its BEV -40% line; more on that later in this article.
The XAU continues deflating, closing the week with a BEV of -51.22%. Ignore that, it’s a head fake. I admit it; my reading of the market’s tea leaves isn’t all I’d like it to be. And every time I gaze into my market’s crystal ball, all I can see is smoke belching around inside. Still, I have faith with time, as this bear market on Wall Street develops, owning shares in the precious metal miners will richly reward their owners.
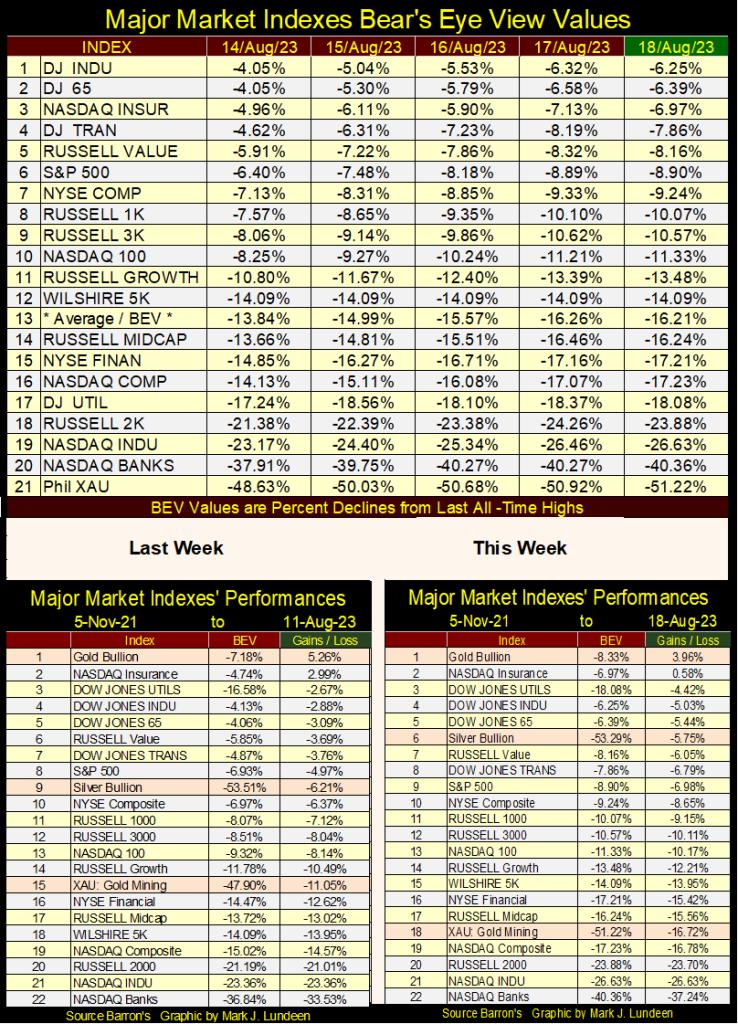
Of course, seeing the XAU fall from #15 last week to #18 this week in the performance tables above, suggests I may be wrong about the gold miners. But developments in the credit markets may soon change that.
If the rating agencies are finally downgrading the banks, things must be getting grim in the banking sector.
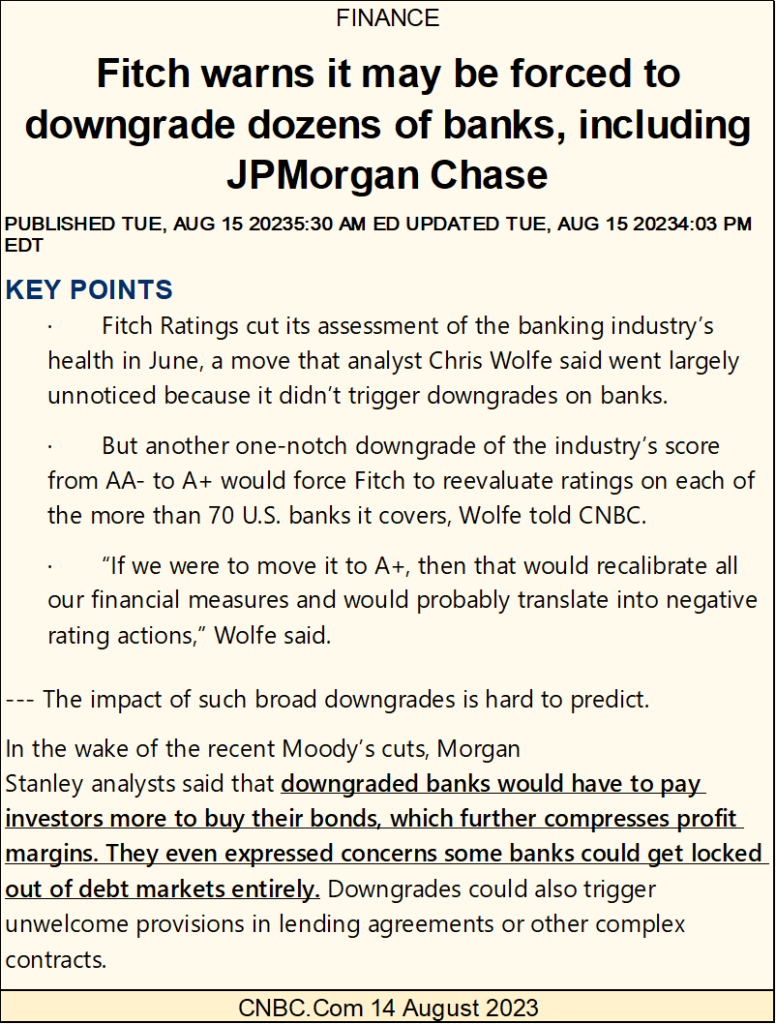
https://www.cnbc.com/2023/08/15/fitch-warns-it-may-be-forced-to-downgrade-dozens-of-banks.html
“They even expressed concerns some banks could get locked out of the debt markets entirely.”
This one sentence above, precisely explains what happened during the sub-prime mortgage crisis; the big banks, with their reserves jammed packed with toxic mortgages, got locked out of the debt markets.
Why? Because no other bank wanted to buy their worthless mortgages, just as they too refused to buy worthless mortgages from other banks. Worthless mortgages all these banks created with abandon since 2002, using what at the time was called “structured finance;” “bundling” garbage mortgages with equally worthless derivatives, elevated CCC junk grade debt, to investment grade AAA.
We can laugh about this today, but back then “structured finance,” marketed by the financial main-stream media, made the implausible seem possible. Wall Street discovered the alchemist’s philosopher’s stone. But instead of transmuting base metals into gold, Wall Street’s “structured finance” transmuted abandoned mortgages in a bad part of Chicago, into instruments of credit on par with US Treasury debt. Pension and mutual funds, insurance companies, and trust funds paid top dollar for this trash.
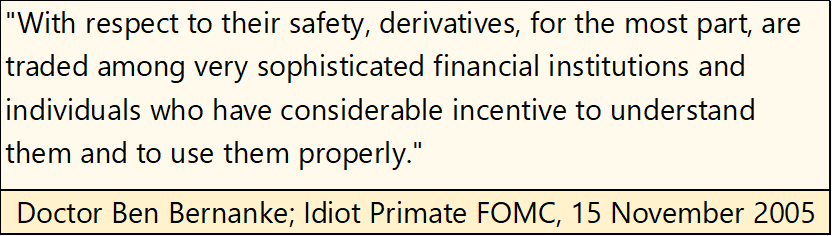
And why not? Structured finance, and derivatives were taken very seriously by America’s top economists, and Wall Street’s “market experts.”
In September / October 2008, the global banking system almost shut down, because tens of trillions of dollars of mortgage-backed assets became illiquid; unloved, unwanted, and untradable. Sub-prime mortgages, a multi-trillion-dollar market in August 2008, became a Zero-dollar market in October 2008. Quicker than you can say “pouf,” the big Wall Street banks went bankrupt fifteen years ago.
This is why Doctor Bernanke implemented his QE-1 in early 2009; to use monetary inflation to purchase garbage assets from the banks * AT TOP DOLLAR *, to “reliquefy” a banking system that deserved to die.
What is the problem today? The vast amount of debt created by the banking system following the sub-prime mortgage debacle can no longer be serviced by the underlying economy it weighs down on. The banking system still encourages debtors to take on even more debt, as in the “financial article” below on credit scores. Note the word SPEND at the top of the article. Click on the link below and you’ll see CNBC put it there, not me.

“No benefit to scoring higher; says ‘expert.’” “Experts” like this, as is the entire financial news media, publishers of rubbish like the article above are paid agents for the banking system; not providers of helpful advice on how best to get along in the world, on our life’s journey from our mother’s womb to our tombs. Trust me; if you’re a “consumer,” life without debt is much better than life with it.
Here is a mental picture for your consideration. You’re dining in an exclusive restaurant high in a skyscraper in Chicago or New York. It’s after sundown, and looking down on the city, you realize for the first time everything you can see and touch are only the collateral for loans provided by the Federal Reserve System.
The thousands of automobiles seen traveling on the streets and interstate-freeway system, all have auto loans on them. The people seen walking far below all carry consumer debt, most of them owing more to the banks than is good for them. The land and buildings as far as the eye can see, including the skyscraper and restaurant you are dining in are mortgaged, credit provided by the banking system. After your meal, and coffee, you pay for it all, as you did with the expensive clothes you’re wearing, with a credit card carrying a balance of thousands of dollars, that the bank charges you double-digit rates on.
What could go wrong with this system of debt servitude to the global central banking cartel?
It didn’t used to be this way. Before Congress legislated the Federal Reserve System into existence in 1913, for people, banks were for depositing their savings into, and people’s savings were all the banks had available for creating loans for business purposes. Consumer debt? Not before 1913! That had to wait until the Roaring 1920s, where the Federal Reserve System made “buy now, pay later” possible, as their “liquidity” began flowing into all facets of economic life in the United States.
What a racket, where we work so hard paying our debts to a banking system, that obtains its money to loan to us at no cost to itself. And should a debtor default on their debts to the bank, the collateral goes back to the bank. What a racket!
How will this all end? I’m inclined to believe what Ludwig von Mises said about monetary systems based on inflation – credit expansion – below.
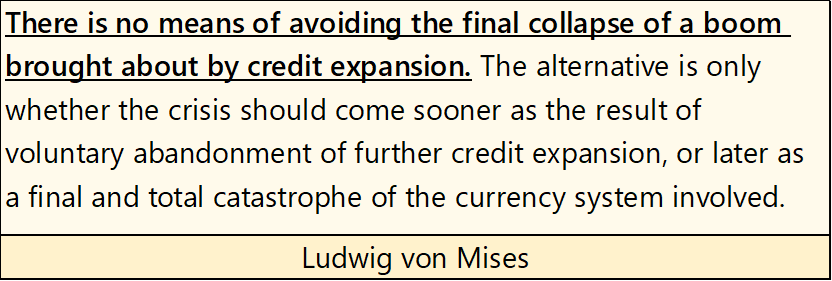
The last opportunity to voluntary abandon the credit expansion, happened during the sub-prime mortgage crisis. Doctor Bernanke’s implementation of his QE-1 signaled the decision had been made; the idiots would continue “injecting” their “liquidity” into the financial system until the entire dollar-based economy finally collapses. And when it does, we’ll not even get an “I’m sorry” or a “we were wrong” from these idiots. They’ll blame it all on the consumers, for not making their monthly payments on the debts they owe to the banks.
With all the above in mind, let’s look at the banking stocks in the BEV chart below. The data plotted below are from three sources. From 1938 to 1988 uses Barron’s Stock Groups, 1989 to 1996 from Dow Jones Total Market Groups, and from 1997 to present the NASDAQ Banking Index. I wish I had one source for this data, but to reach back to 1938, I had to use the now antique data series from Barron’s Stock Groups.
As always with Bear’s Eye View (BEV) Plots, the dollar values are converted into percentage values spanning one hundred possible points;
- 0.0% = New All-Time Highs
- -0.01% to -100% = percentage clawbacks from all-time highs.
In the plot below, something changed after the early 1970s is evident. Before 1970, the banking stocks never broke below their BEV -35% line; a 35% clawback from an all-time high. After 1970, the banks spent too much time below their BEV -35% line. What in the hell happened in the early 1970s?
That’s easy to answer; in August 1971 the United States Government abandoned the Bretton Woods $35 gold peg, unleashing a torrent of monetary inflation within the global economy, and creating instabilities, such as “structured finance” within the US banking system.
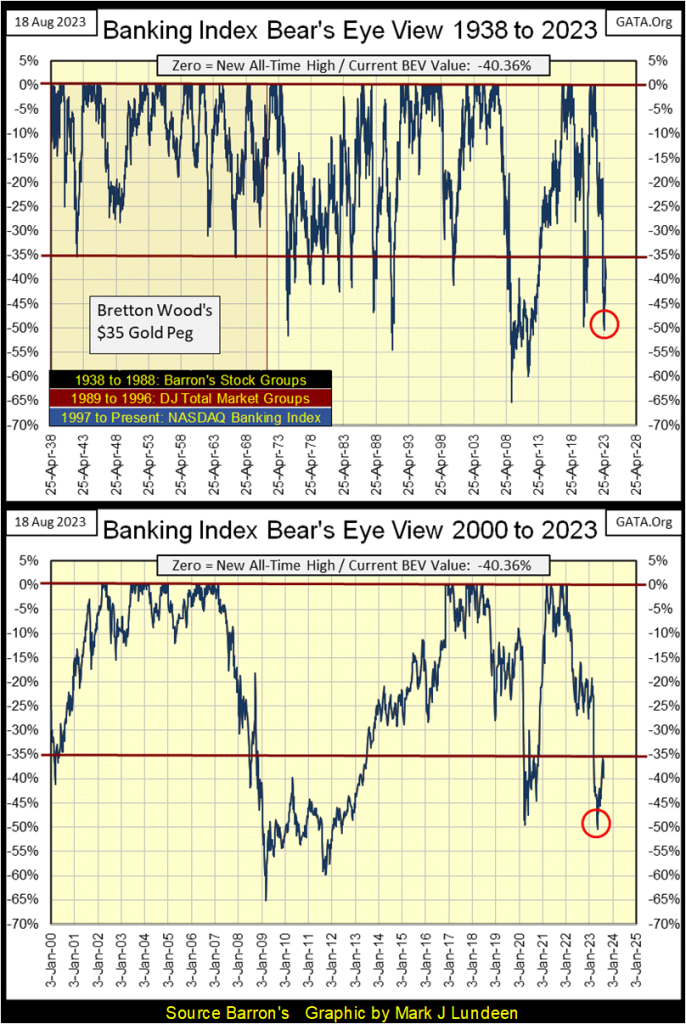
The bottom chart gives a better view of the 21st century situation in the banking sector. The sub-prime mortgage boom for the banks topped in Barron’s 26 February 2007 issue. In this issue the banks saw their Terminal Zero (TZ), last all-time high for the move, more than a year before Bear Stearns first announced one of their mortgage funds was insolvent. Two years later, in March 2009, the banks bottomed with a BEV value of -65%, a 65% clawback from their TZ of February 2007. Had Doctor Bernanke, then Idiot Primate of the FOMC, not implement his QE#1 in early 2009, these banks’ BEV values would surely have declined below their BEV -90% line.
Currently, the banks broke below their BEV -50% line in mid-May (Red Circle), as banks in Silicone Valley had runs on them, recovering to their BEV -35% line since then, but closed the week just a tad over their BEV -40% line.
Let’s look at that May BEV -50% bottom. What’s notable, is ten weeks earlier, late February, these banks were at their BEV -20% line. A 30 BEV point decline in only ten weeks, is a big decline in such a short time, one that certainly gave us a heads-up that something bad was coming to the banking system. This banking index is something to keep our eyes on in the weeks and months to come.
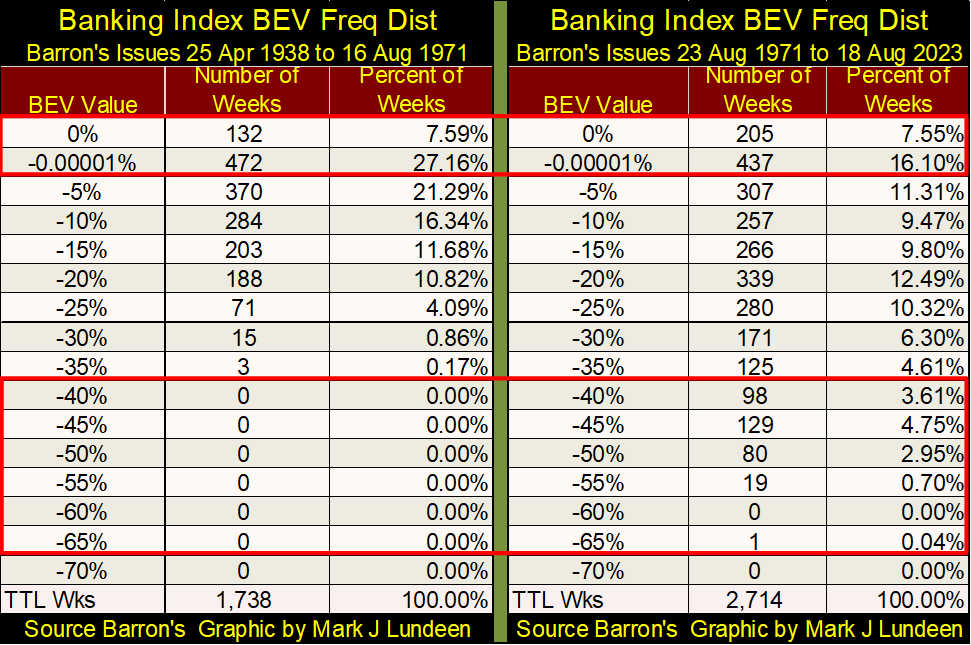
For your information, here are the freq tables for the pre & post-1971 BEV data for the banking index charts above. Following August 1971, look at all the weekly closes below the BEV -35% line. Small wonder the FOMC is always “stabilizing” its banking system.
So far this summer, I’ve made some effort to show what is currently expensive, and cheap in the market. Noting the problems with buying expensive assets, that at market tops, the risk-reward ratio is slanted towards excessive risks, and away from an adequate reward for assuming the risks taken.
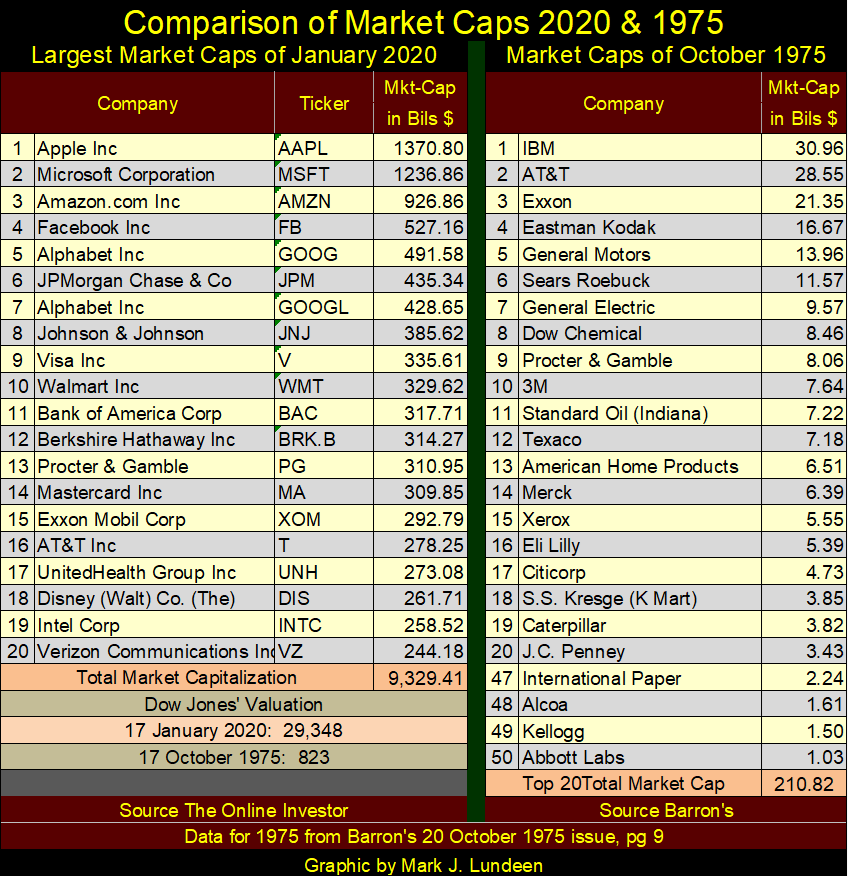
With that in mind, I remember the late 1990s, during the NASDAQ High-Tech boom, Cisco Systems received much coverage in the media, as its market capitalization was approaching $1.0 trillion dollars. No company had ever seen a trillion-dollar market cap before.
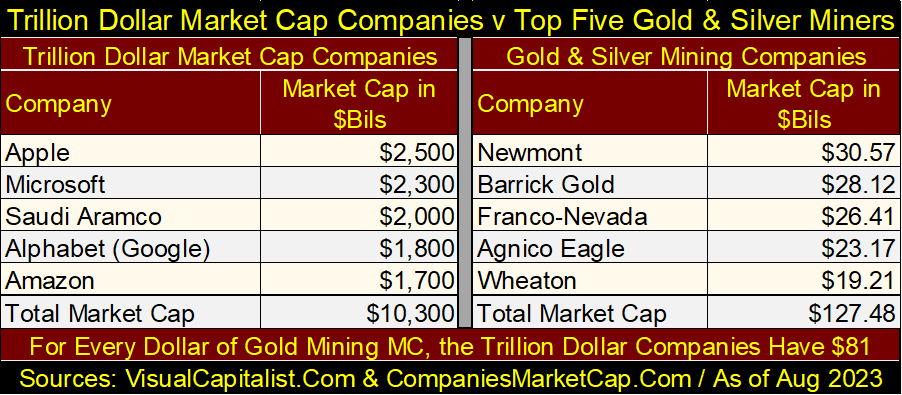
A quarter century later, we now have five companies with trillion-dollar market caps, table below, whose combined market cap is $10.3 trillion dollars. To put that into perspective, the US national debt first went over $10 trillion dollars in October 2008. Compare that to the five largest precious metal mining companies’ market capitalization on the left side of the table below.
Precious metal mining is a tiny sector in the stock market. If just 1% of the market cap of these trillion-dollar companies shifted into the gold and silver miners, the XAU would explode. Add to that other multi-trillion-dollar markets that will be subjected to Mr Bear’s valuation readjustments; Treasury and corporate bond markets, real estate, and the stock market.
In a big market downturn, should just a fraction of 1% of all these markets’ “liquidity” flow into precious metal assets, the market move in the old monetary metals and their miners will be historic.
But will it? I expect when Mr Bear returns to Wall Street, and claws back on the excessive market capitulation seen below on the left side of the table, where these trillion-dollar companies once again become billion-dollar companies, the gold and silver miners will be one of the prime beneficiaries of the resulting capital flight.
Next is a graphic I last updated and used in January 2020. I didn’t update it for this week, as I wanted to show how many trillion-dollar market caps there were three and a half years ago; in January 2020 there were two, though Amazon (#3) came close to being one.
Note the combined market cap for the above five companies, is larger than the combined market cap for the top twenty in the table below, as more and more monetary inflation from the Federal Reserve, flows into fewer and fewer companies trading on Wall Street. That is what happens at market tops.
On the right side of this table, are the market caps for the largest companies trading on Wall Street in October 1975. Topping the list is IBM, or as it was affectionally known in the 1970s; “Big Blue” with a then astounding market cap of $30.96 billion dollars. Abbott Labs made the top 50 with a market cap of only $1.03 billion dollars.
What is seen below is the effects of forty-five years of dollar inflation, by the FOMC, on market capitulation. It’s all hot air, inflating a bubble, and bubbles in the market always pop.
So, how did gold do this week? Let’s look at its BEV chart below to see. Gold is trending down to its BEV -10% line. That isn’t good, but as seen in its step sum table below, the COMEX goons are really putting the screws to gold in the paper gold futures market. It’s remarkable gold is down so little, after so many down days in the market.
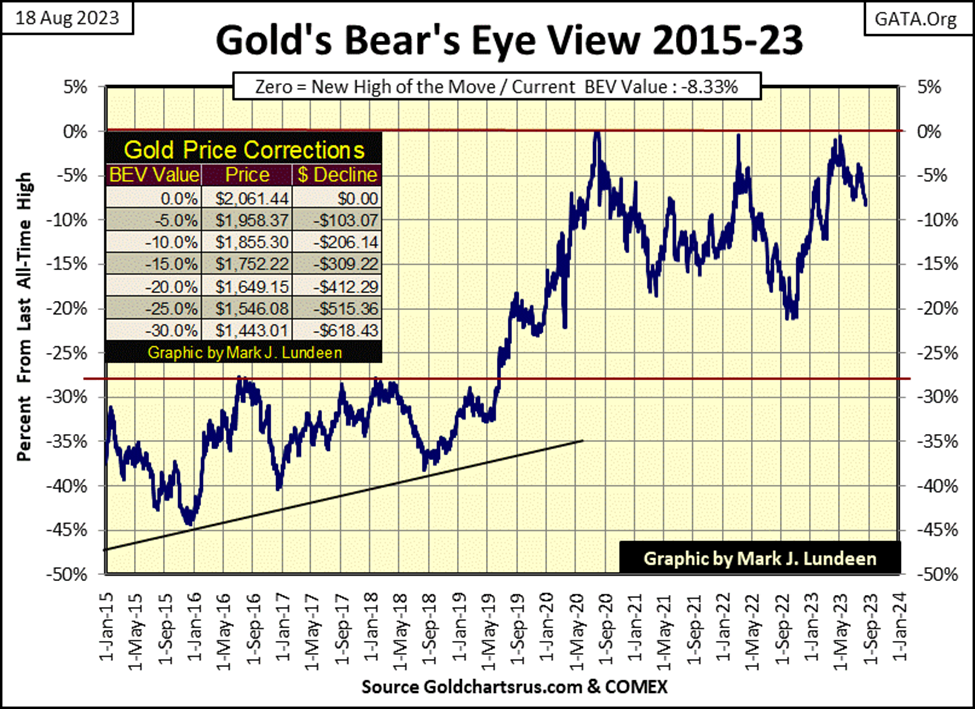
Gold’s 15-count went from a +7 on July 19th, to a -7 this week. It takes a whole lot of selling to make that happen, and after all that selling, like a boxer, a bear begins to get tired after punching that much, for that long. There comes a time when the production of down days seen below ceases, and the bulls will begin piling up daily advances in the gold market.
Gold closed the week with a BEV of -8.33%. Gold is less than 10% away from making a new all-time high. In the pending counter-attack in the gold market, we’ll then see what the bulls can do with the price of gold. A new all-time high, the first since August 2020? Maybe.
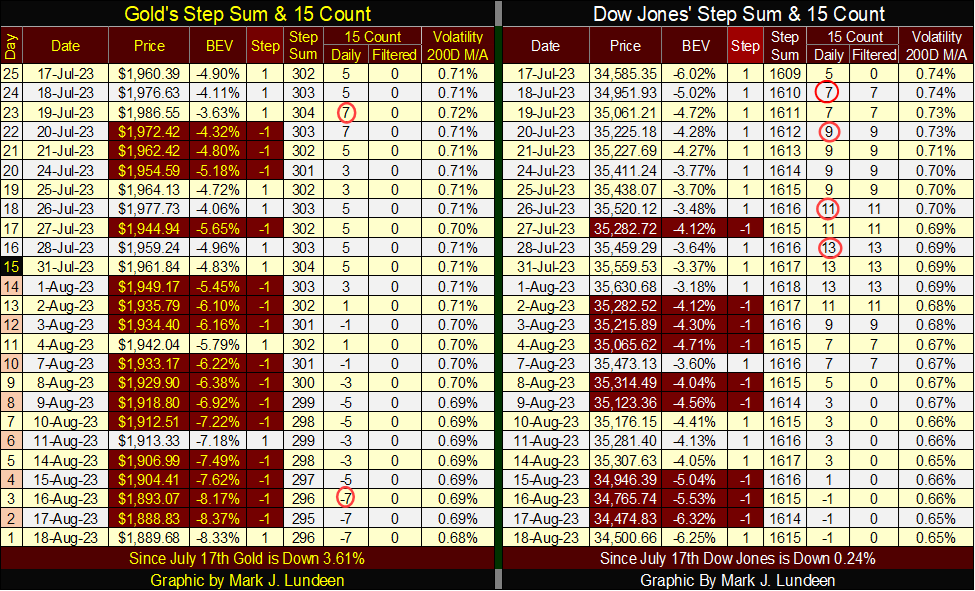
What the gold market needs is a big boost in daily volatility. Seeing gold’s daily volatility’s 200D M/A close the week at 0.68% is frustrating. The debt and real estate markets are in the early stages of a major meltdown, so the gold bulls go about life as if they are trading in an opium den? This will all change as yields and rates continue to rise, eventually triggering capital flight from financial assets, into precious metal assets, sending gold’s daily volatility’s 200D M/A far above its 1.00% line.
The Dow Jones saw a rare 15-count of +13 on July 28th. The stock market has been overbought to such an extreme only a handful of times since January 1970. The Dow Jones is selling off now. How low will the Dow Jones go is something we’ll have to wait to see.
__
(Featured image by AlexanderStein via Pixabay)
DISCLAIMER: This article was written by a third party contributor and does not reflect the opinion of Born2Invest, its management, staff or its associates. Please review our disclaimer for more information.
This article may include forward-looking statements. These forward-looking statements generally are identified by the words “believe,” “project,” “estimate,” “become,” “plan,” “will,” and similar expressions. These forward-looking statements involve known and unknown risks as well as uncertainties, including those discussed in the following cautionary statements and elsewhere in this article and on this site. Although the Company may believe that its expectations are based on reasonable assumptions, the actual results that the Company may achieve may differ materially from any forward-looking statements, which reflect the opinions of the management of the Company only as of the date hereof. Additionally, please make sure to read these important disclosures.


Morocco’s Budget Execution June 2026: Deficit Narrows to 20.2 MMDH
Morocco’s Finance Law execution at end-June 2026 shows a reduced budget deficit of 20.2 billion dirhams, down from 24.9 billion...


Tilray Brands Hits Multi-Year Lows as Cannabis Investors Await Regulatory Clarity
Tilray Brands shares have fallen 57% this year amid cannabis sector weakness and uncertainty over US regulatory reform. While potential...


Ethereum Between ETF Inflows, Price Risks and a Strong July
Ethereum faces mixed signals as ETF inflows and a strong July performance support recovery, while technical resistance and downside risks...


Mercedes-Benz Accelerates EV Decarbonization With Recycled Aluminum
Mercedes-Benz expands its partnership with Hydro to accelerate supply chain decarbonization. Future electric vehicles will use Hydro CIRCAL aluminum containing...

Evotec and BioGaia Boost Biotech, while Vitrolife Disappoints
European stocks moved on earnings and broker actions. Evotec, BioGaia, Plus500, Pharming, Inwido, Amundi and Julius Baer rallied on upgrades,...
 |
|
 |  |
 |
|
-

 Africa5 days ago
BMCE Capital Markets Launches Carbon Market Offering for Moroccan Transport Operators
-
 Business2 weeks ago
The $40 Trillion Trap: Disinflation Is Not Deliverance
-
 Biotech2 days ago
Evotec and BioGaia Boost Biotech, while Vitrolife Disappoints
-

 Africa1 week ago
Bank of Africa Launches BOA MDM Network to Boost Diaspora Investment in Morocco