Featured
Precious Metals Markets Continue to Struggle as the US$ Index Rises
Summer doldrums it seems have hit markets. Some indices were up and others down but never by very much. News was driven in the markets by the benign CPI/PPI reports this past week. China’s CPI report wasn’t so benign as it is showing deflation. And another large Chinese real estate company is in trouble, Country Garden Holdings. Evergrande redux? China’s exports and imports are falling as well.
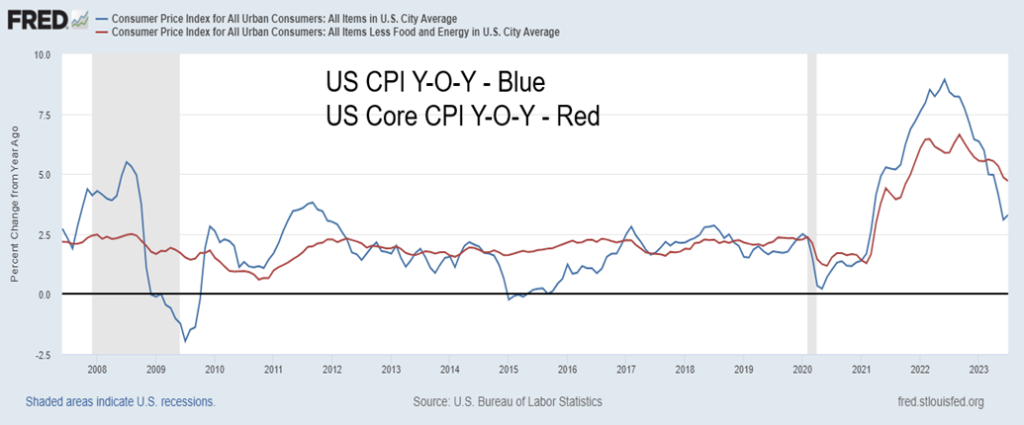
US CPI, Core CPI 2007–2023
It seems to be one of those weeks when not much is happening, but most likely everything is happening. The markets look like they are in the summer doldrums. Elsewhere, the world is falling apart. The war between Russia/Ukraine is grinding on, with word that progress made by Ukrainian forces against Russian lines can at best be considered slow. Headlines describe the offensive as “sobering.” Voices are rising in the U.S., criticizing how much this is costing—to date, an estimated $75 billion from the U.S. alone. The Russian defense budget is roughly $100 billion. The amount is added to the U.S. debt already the largest national debt in the world.
Extreme weather events continue with fires on the island of Maui in Hawaii, destroying a resort town and killing dozens; a massive typhoon in South Korea upended the Scout jamboree; and, wildfires continue to rage in Canada, Siberia, Portugal, and elsewhere. Massive storms battered the Eastern U.S., a huge storm in Norway caused a dam to partially collapse, and floods and storms in China have killed dozens.
July was, reportedly, the hottest month on record. The extreme weather events are costly too, estimated in the billions in terms of damage and displacement of people and lost productivity, jobs, and business. How much exactly? An unknown number, but well north of $100 billion. A prime example is the fire in Hawaii where the destruction of Lahaina, Maui is estimated at $5.5 billion and leaving an estimated 11,000 homeless.
It is negatively impacting insurance companies, where many smaller ones are teetering on the edge of bankruptcy. And it is impacting homeowners and businesses as numerous insurance companies are outright refusing to insure in hard-hit areas or areas vulnerable to weather events such as wildfires, extreme storms, floods, and hurricanes (typhoons). It may not be ironic that one of the top investment performers has been catastrophe bonds. What are catastrophe bonds? Also known as “cat bonds,” this is money borrowed by insurance companies that triggers payouts only if a catastrophe happens. If nothing happens, it retains its value.
And dare we mention that the reality show known as the indictment (three times and counting) of a president continues. Another indictment is expected within a week from Georgia. No word on how ongoing social media threats by the ex-president will be dealt with. Nonetheless, it continues to highlight the deep divisions within the U.S. A civil war without the shooting. What it means going forward for markets is unknown. However, it is not impossible to believe that at one point it could have a negative impact on markets. A potentially contentious election is due in 2024.
This week’s CPI report seems rather benign, considering all of the above. The report was actually better than expected, with the markets mostly yawning. Summer doldrums? The CPI came in up 3.2% year-over-year (y-o-y). That was actually better than the expected 3.3% but higher than June’s 3%. It was the first upward blip in twelve months. The core inflation rate (ex. food and energy) was up 4.7% y-o-y which was also better than the expected 4.8%. June core was also up 4.8%. Is inflation on the rise again?
Maybe. The next day, the PPI came out and it was slightly higher than expected with y-o-y up 0.8% vs. the expected 0.7% and core PPI up 2.4% vs. the expected 2.3%. Doesn’t seem like much, but the market’s reaction was negative. It keeps the pressure on thoughts that the Fed might hike again. But overall, it doesn’t seem like much and gives credence to claims that we are headed for a soft landing and inflation is under control. However, with oil prices rising, how long will that remain?
Overall, markets met the numbers with a yawn. It was not even sufficient to move gold higher as the US$ Index was up. Markets closed the day marginally higher. Of bigger interest was China’s inflation numbers. China appears to be suffering from the opposite of inflation-deflation.
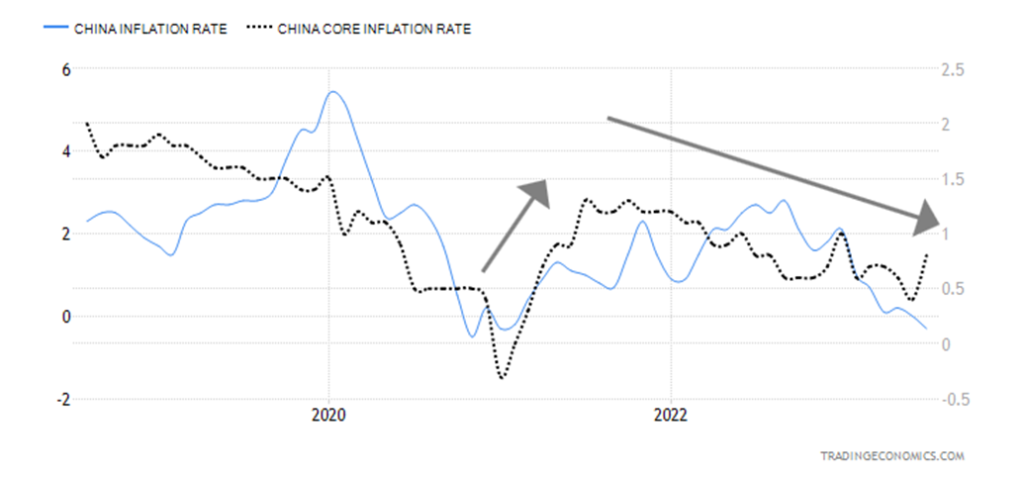
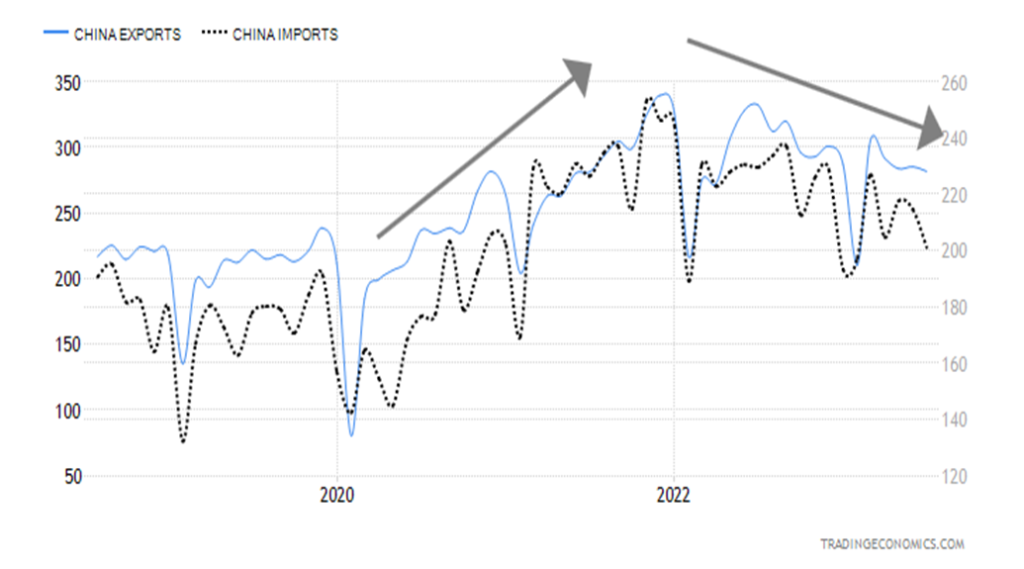
While here in North America we are only seeing rising prices in China, the CPI actually went negative. Yes, China’s CPI fell 0.3% y-o-y in July, the first decline since February 2021 during the pandemic. It was actually mildly better than the expected 0.4% decline. Core CPI, however, rose 0.8% y-o-y vs. 0.4% the previous month. That’s still pretty low. As well, exports and imports are falling. After rising steadily following the pandemic of 2020/2021, both exports and imports have been falling steadily. Exports in July were down 14.5% from a year earlier while imports fell 12.6%.
China CPI, Core CPI 2018–2023
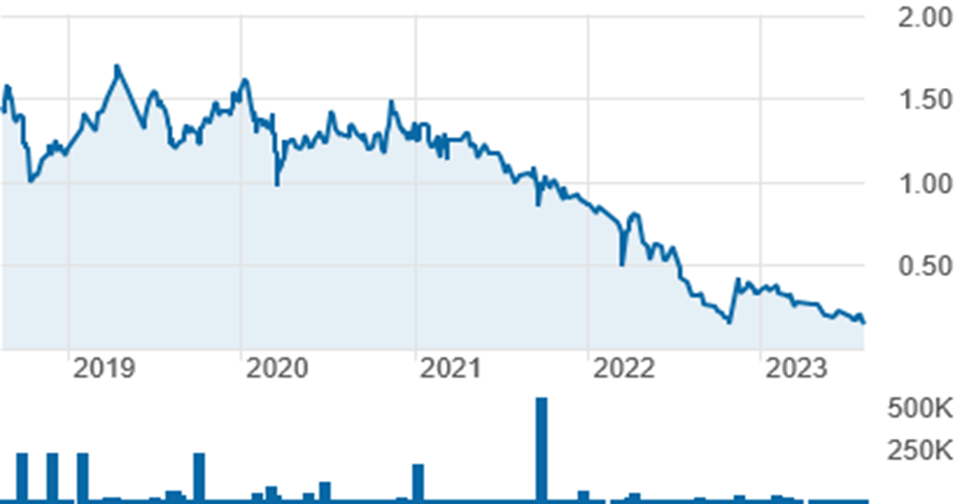
China experiencing deflation? Are exports and imports falling? This is the world’s second-largest economy. If they falter, the world economy falters. Deflation? That is what we call the Japanese disease where prices have remained ludicrously low for over thirty years and they are often negative. Japan is the world’s third-largest economy. All this means is that there is a deepening malaise in the world’s second-largest economy. Youth unemployment has hit record highs. The housing market is in a deep downturn and now word comes of another potential Evergrande scenario, Evergrande being the property giant that collapsed in 2021. Country Garden Holdings Co. Ltd. (CRYNF-OTCBB, 2007. HK-HSI) has replaced Evergrande. But it’s now missing interest payments. Its bonds are down over 80% while the stock is down over 90%.
China’s property market has been described as a Ponzi scheme. People’s Bank of China (PBOC), China’s Fed, is scrambling trying to prevent a complete collapse. Country Garden has over 100,000 employees and its collapse could have wide-ranging negative impacts, including reverberating into North America where the property market, particularly commercial real estate, is already shaky, and not to leave them out, beleaguered homeowners because of the rise in interest rates. It’s noteworthy that U.S. investors also hold the Country’s bonds. Is a property market collapse in China a potential black swan event with global ramifications?
China Exports and Imports 2018–2023
Country Garden Holdings Company Ltd. 2018–2023
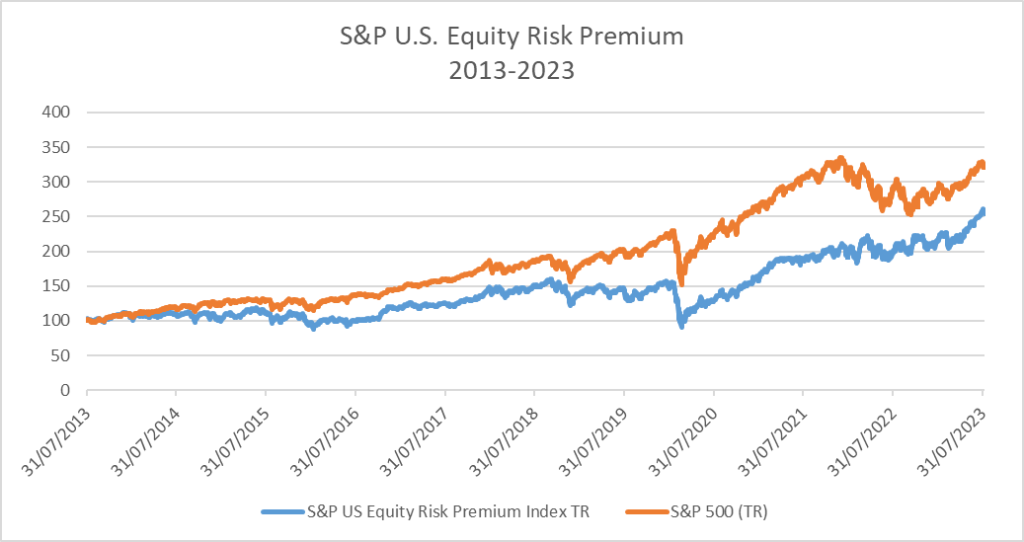
Much has been made lately about equity risk premium. An article by economists David Rosenberg and Bhawana Chhabra of Rosenberg Research, titled “It’s time for investors to revisit their asset mix” (The Globe and Mail, August 9, 2023) pointed out the rise of equity risk premium. We also saw a posting from Keith McLean of Viewpoint Investment Partners that Francois Trahan, a macro specialist, had noted the same thing. The equity risk premium is rising. We have two charts below, dealing with essentially the same thing. The first one shows the S&P 500 earnings yield less the U.S. 10-year treasury note while the other one shows the equity risk premium vs. the S&P 500.
S&P 500 Earnings Yield less U.S. 10-year Treasury Note 1962–2023
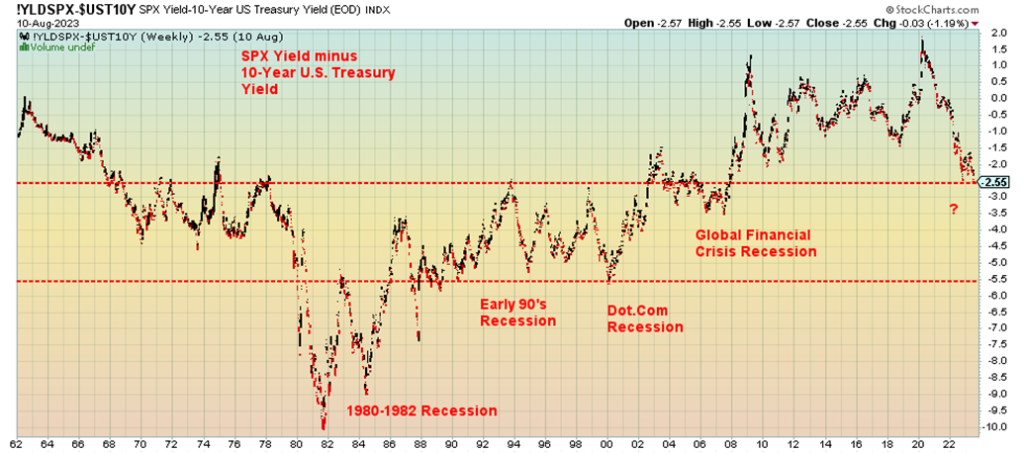
Note how steep the spread reached during the 1980–1982 recession, the early 1990s recession, the dot.com recession of 2001–2002, and the global financial crisis recession of 2007–2009. We are now down at levels seen during the global financial crisis recession. Like the steeply inverted yield curve, it appears that a wide spread between the S&P earnings yield and the 10-year has consistently signaled a recession. It was also low during the 1974–1975 recession, but not as low as it went during subsequent recessions. As with the inverted yield curve, it is not a guarantee that a recession could occur but it is a warning.
The second chart highlights divergences. This was taken from an Excel file, so we couldn’t recreate the chart in a charting program. However, we noticed divergences. Currently, the S&P Equity Risk Premium Index is making new highs but the S&P 500 is not. It was the opposite back in 2019 before the pandemic collapse and recession as the S&P 500 made new highs but the equity risk premium did not. No data was provided before 2013. The sample size is small, but we do note divergences as they often mean something. The risk premium is high. And that in turn could translate into a downside correction.
The BRICS summit takes place on August 22–24 in South Africa. Leaders from 67 nations from Latin America, Africa, Asia, and the Caribbean were invited to attend. Many countries are clamoring to become a part of BRICS (Brazil, Russia, India, China, South Africa). Twenty-three have formally applied, including Iran, Saudi Arabia, UAE, Argentina, Indonesia, and Egypt. A major concern driving the desire for membership is U.S. sanctions placed on Russia, including blocking them from SWIFT, the international payments system. Sanctions on China are also a concern. Other countries assume if the U.S. can do that to Russia and China, they could do it to them too. Russia’s President Putin will not attend because of the global warrant for his arrest by the International Criminal Court (ICC), of which South Africa is a member but notably not Russia, China, and the U.S.
Besides expansion, not a given, another main topic of discussion will be international trade. Currently, the U.S. dollar dominates international trade. The U.S. dollar still makes up some 90% of foreign exchange transactions. Why? Because even if two countries decide to trade in, say, Chinese yuan it involves two transactions: converting their home currency to buy first U.S. dollars and then converting the U.S. dollars to yuan. Then one completes the trade transaction. What is being talked about is a BRICS currency backed by gold. No, it won’t happen overnight, but already some countries are conducting business away from the U.S. dollar. For example, Saudi Arabia and China are conducting oil trade in yuan. However, as noted, it still might require a foreign exchange transaction in U.S. dollars in the middle. What this could be, though, is another threat to U.S. dollar hegemony as the world’s reserve currency. A reserve currency, as we have noted before, does not last forever.
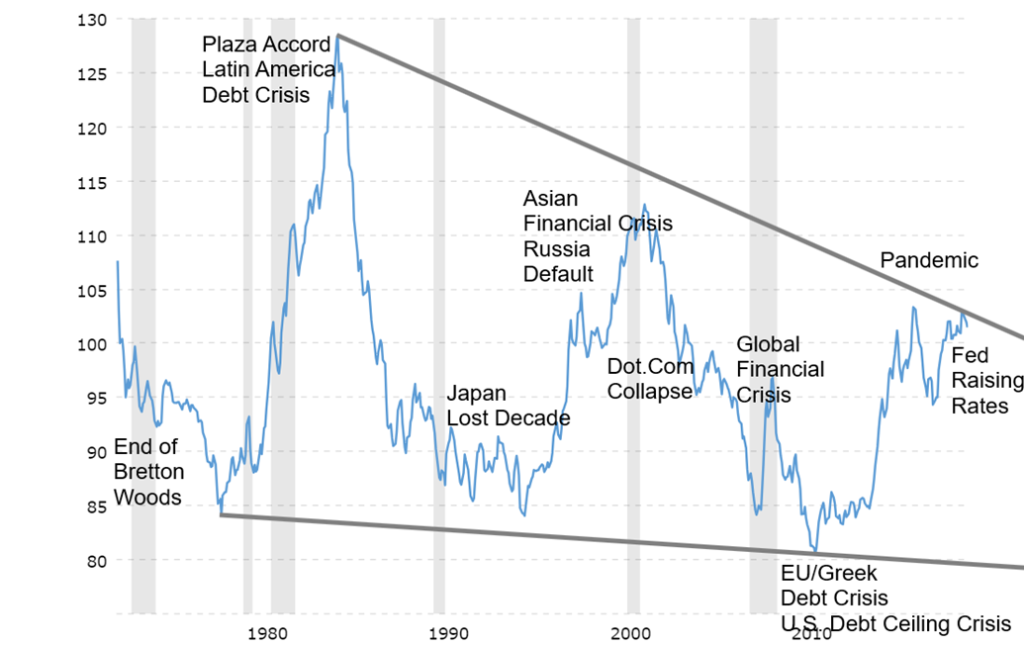
Ever since the end of the Gold Standard in 1971 and the end of Bretton Woods in 1973, the US$ Index has been on a downward trajectory. Each big rally was followed by a big collapse. Since 2011, the year of the EU/Greek crisis and the debt ceiling crisis, the US$ Index has been rising. But each rally falls short of the previous one. Have we topped? We can’t tell that yet. Recent action has not been positive, but there is no confirmation of a top.
U.S. Dollar Index 1973–2023
Wars and extreme weather events are highly visible and even predictable. But risk in the markets is not always visible. It’s like the iceberg that sank the Titanic. It’s there, but you don’t see it until it is too late.
Chart of the Week
Silver has been a huge source of frustration for the gold bugs, and no wonder. While gold soared to new all-time highs in August 2020, silver wasn’t even close. Silver actually made its high at $30.35 in February 2021, but that was nowhere near its all-time high of $49 seen in January 1980 and a high price of $49.82 in April 2011. When silver hit $49 in 1980, gold hit a high of $873. But when silver made its high of $49.82 in April 2011, gold didn’t make its high of $1,923.70 until September 2011. Gold exceeded that in August 2020, but silver was nowhere near its former high—a significant divergence.
We’ve often wondered whether that divergence was a bad omen. After all, the Dow Jones Industrials (DJI) and the Dow Jones Transportations (DJT) are joined at the hip and when they diverge it usually translates into something. At lows, it usually translates into a big rally coming, but at highs, it’s the opposite. Nonetheless, it is not surprising that gold and silver rarely top or bottom together. They both topped in January 1980 and that has been about it. They both made an important bottom in March 2020 as well, but the pandemic played a role in that. Dow Theory with the indices applies as well to the precious metals of gold and silver. The two, gold and silver, are joined at the hip.
They each have their own cycles and those don’t necessarily match. This is why you get one bottoming or topping at one time, then the other doing it. When they do coincide as they last did in March 2020 at the height of the pandemic, it is usually for comparable reasons.
We won’t go into all the reasons for silver. Silver is often referred to as gold’s poor cousin. There is a lot more silver in the ground than gold, roughly 15:1 in nature. Silver has many industrial uses, including in the EV market and with the growing clean energy market. There is a silver shortage, but you’d never know it with the depressed price. Silver analyst Ted Butler has well outlined some of the problems in his article about code red. His latest update is here on SilverSeek at https://silverseek.com/article/more-silver-code-red.
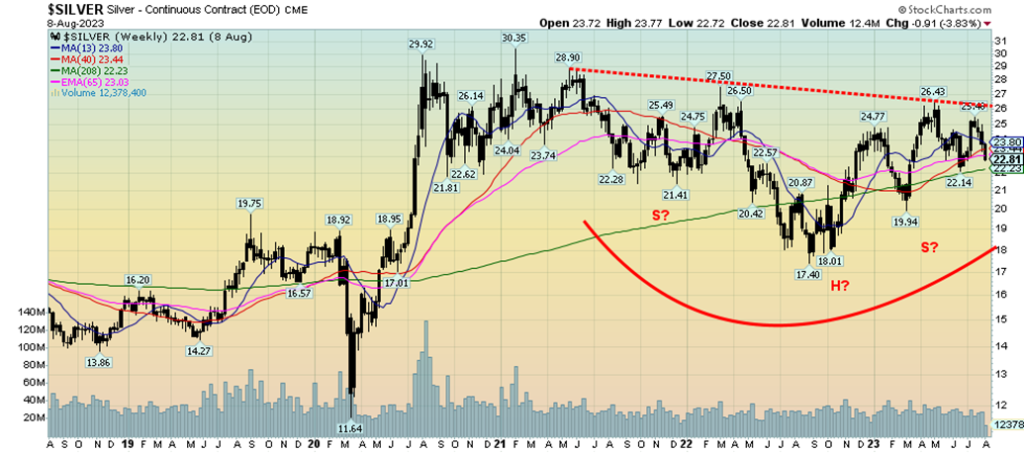
Our weekly chart of silver certainly looks interesting enough. Is that a head and shoulders pattern we see? It could be, but it is an awkward one. The right shoulder’s low is not supposed to go below the left shoulder, but it did. So, does that invalidate it? Only if we take out the right shoulder low at $19.94. Then the entire pattern is invalidated. If we firmly break up and over $26, we could be on our way with targets up to $37/$38. But if $19.94 falls, we could see new lows below $17.40. Not what silver bugs want to hear.
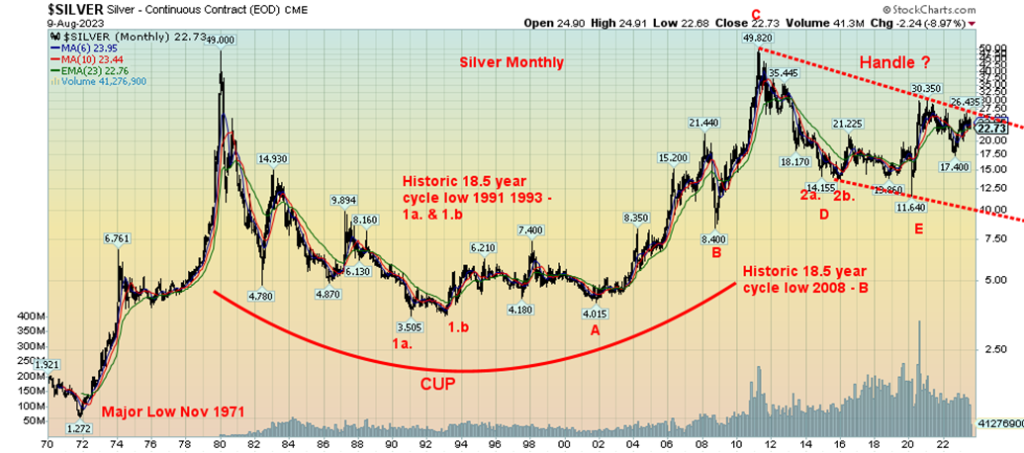
Our long-term monthly chart is equally intriguing. Is that a long-term cup and handle pattern? Many have been touting it. Even if, somehow, we failed under $17.40, we’d probably find long-term support at the bottom of that channel currently near $10. Again, not what the silver bugs want to hear, but it wouldn’t invalidate the potential cup and handle pattern. The cup and handle pattern has potential targets up to $70/$75. But, once again, we need to first break over $26 and then make new highs above $49.82.
Silver’s long-term cycles, according to Ray Merriman of MMA Cycles (www.mmacycles.com), span 18.5 years. That double bottom low in 1991 and 1993, measured from a low in late 1971, is the first 18.5-year cycle low. The second one is 2008 (B) and the financial crisis. It is within the orb of 15–22 years cited by Merriman. The next one is potentially due in 2023–2030. The only way we can say our low is in is to first take out $26 and then preferably new highs above $49.82. Until then, the risk is to the downside.
The 18.5-year cycle breaks down into either two cycles of 9.25 years or three cycles of 6.2 years. It is possible that the March 2020 low of $11.64 qualifies, even if it was 12 years from 2008. Certainly, the double bottom of 2014/2015 qualifies as the 6.2-year cycle low measured from 2008. The March 2020 low was roughly six years from the 2014 low within Orb. The next one is not due until the 2026 range (2025–2027). That makes the current cycle bearish. Again, not what the silver bulls want to hear. Hence, once again we need to successfully break above $26 and then again above the February 2021 high of $30.35 to suggest we’ve made our low.
Despite making those important lows for silver in 1991 and again in 1993, the silver bear continued throughout the 1990s until the final low in November 2001 (A). That low would fit with the 9.25-year cycle measured from 1991 and 1993. The 2008 low (B) was 17 years from 1991 and 15 years from 1993 both within the orb of the 18.5-year cycle.
The high in April 2011 (C) now appears to be the bull peak of the current 18.5-year cycle. Our big question is, when do we see the cycle low? Has it happened already or is there another leg down that takes us back to that low March 2020 (E) or lower? Our sense is we haven’t seen it yet. None of that is going to please the silver bulls. We have entered the time frame for our low. The most bullish scenario is a significant low that does not take out the March 2020 low. But the reality is, it has now become imperative for the bulls to take out $26 first, and then February 2021 high of $30.35, to tell us the low is in and we are embarking on a new upcycle for silver.
Unlike gold, where gold expressed in other major currencies has seen some new highs, that is not the case when it comes to silver. In euros, pounds, Swiss, yen and Cdn$, silver’s high in those currencies was in 2011 or 1980. It would be encouraging if we saw new highs for silver expressed in major currencies. But, like silver in U.S. dollars, that just hasn’t been the case. The continuing divergence with gold is, for silver bulls, a major source of frustration.
Markets & Trends
| % Gains (Losses) Trends | ||||||||
| Close Dec 31/22 | Close Aug 11, 2023 | Week | YTD | Daily (Short Term) | Weekly (Intermediate) | Monthly (Long Term) | ||
| Stock Market Indices | ||||||||
| S&P 500 | 3,839.50 | 4,464.05 | (0.3)% | 16.3% | neutral | up | up | |
| Dow Jones Industrials | 33,147.25 | 35,281.40 | 0.6% | 6.4% | up | up | up | |
| Dow Jones Transport | 13,391.91 | 16,209.85 | (0.7)% | 21.0% | up | up | up | |
| NASDAQ | 10,466.48 | 13,644.85 | (1.9)% | 30.4% | down | up | up | |
| S&P/TSX Composite | 19,384.92 | 20,407.64 | 0.9% | 5.3% | up | up | up | |
| S&P/TSX Venture (CDNX) | 570.27 | 607.14 | (1.4)% | 6.5% | down | neutral | down | |
| S&P 600 (small) | 1,157.53 | 1,243.65 | (1.3)% | 7.4% | neutral | up | up (weak) | |
| MSCI World | 1,977.74 | 2,169.77 | 1.3% | 9.7% | neutral | up | up (weak) | |
| Bitcoin | 16,531.31 | 29,378.95 | 1.3% | 77.7% | down | up | neutral | |
| Gold Mining Stock Indices | ||||||||
| Gold Bugs Index (HUI) | 229.75 | 228.65 | (0.2)% | (0.5)% | down | down | down | |
| TSX Gold Index (TGD) | 277.68 | 276.88 | 0.7% | (0.3)% | down | down | down | |
| % | ||||||||
| U.S. 10-Year Treasury Bond yield | 3.88% | 4.16% | 3.0% | 7.2% | ||||
| Cdn. 10-Year Bond CGB yield | 3.29% | 3.65% | 2.8% | 10.9% | ||||
| Recession Watch Spreads | ||||||||
| U.S. 2-year 10-year Treasury spread | (0.55)% | (0.74)% | (1.4)% | (34.6)% | ||||
| Cdn 2-year 10-year CGB spread | (0.76)% | (1.03)% | flat | (35.5)% | ||||
| Currencies | ||||||||
| US$ Index | 103.27 | 102.69 | 0.8% | (0.6)% | up | down (weak) | up (weak) | |
| Canadian $ | 73.92 | 74.40 | (0.5)% | 0.7% | down | neutral | down (weak) | |
| Euro | 107.04 | 109.46 | (0.6)% | 2.3% | down (weak) | up | neutral | |
| Swiss Franc | 108.15 | 114.06 | (0.5)% | 5.5% | neutral | up | up | |
| British Pound | 120.96 | 126.99 | (0.4)% | 5.0% | down | up | neutral | |
| Japanese Yen | 76.27 | 68.99 | (2.2)% | (9.6)% | down | down | down | |
| Precious Metals | ||||||||
| Gold | 1,826.20 | 1,946.60 | (1.5)% | 6.6% | neutral | up | up | |
| Silver | 24.04 | 22.74 | (4.1)% | (5.4)% | down | neutral | neutral | |
| Platinum | 1,082.90 | 914.60 | (1.5)% | (15.5)% | down | down | down | |
| Base Metals | ||||||||
| Palladium | 1,798.00 | 1,309.10 | 3.5% | (27.2)% | up (weak) | down | down | |
| Copper | 3.81 | 3.72 | (3.9)% | (2.4)% | up (weak) | neutral | neutral | |
| Energy | ||||||||
| WTI Oil | 80.26 | 83.19 | 0.5% | 3.7% | up | up | up (weak) | |
| Nat Gas | 4.48 | 2.77 | 7.4% | (38.2)% | up | down (weak) | down | |
New highs/lows refer to new 52-week highs/lows and, in some cases, all-time highs.
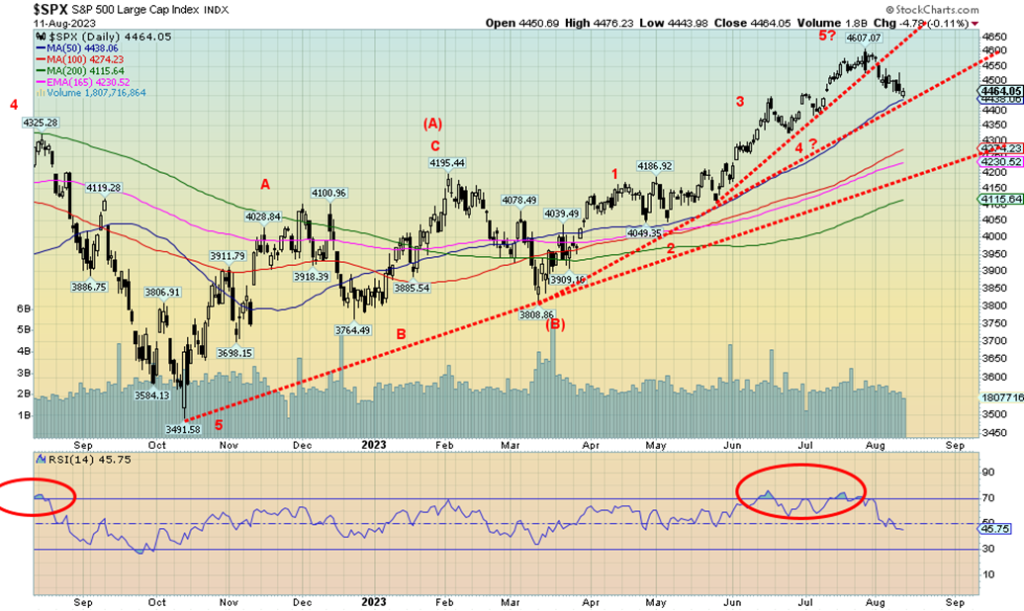
Is the mini-bull out of the October 2022 low over? There are some signs but no confirmed top—yet. For the S&P 500, we broke that steep uptrend line from the May low and are now approaching the next support near 4,440. If correct, this is our C wave up and could complete the larger B wave. Next up the C wave to the downside. Will it be swift? Or just a grind lower?
This past week the S&P 500 fell 0.3%, but the Dow Jones Industrials (DJI) became a safe zone, rising 0.6%. Not so the Dow Jones Transportations (DJT), diverging with the DJI and losing 0.7%. The NASDAQ lost 1.9% and its major component, the NY FANG Index, fell 3.6%. The S&P 400 (Mid) was down 0.8% and the S&P 600 (Small) dropped 1.3%. The S&P 500 Equal Weight Index wasn’t spared, but its drop was only about 0.1%. In Canada, the TSX Composite was a winner, up 0.9%, but not the TSX Venture Exchange (CDNX) as it fell 1.4%.
Over in the EU, the London FTSE lost 0.5%, the EuroNext was down 0.4%, the German DAX dropped 0.8%, but the Paris CAC 40 held in, gaining 0.3%. Nonetheless, the EU exchanges appeared toppy and poised for further losses. Over in Asia, China’s Shanghai Index (SSEC) was a big loser as the Chinese economy wobbles, falling 3.0%. The Tokyo Nikkei Dow (TKN) was a winner, up 0.9%, but Hong Kong’s Hang Seng Index (HSI) fell 2.4% in sympathy with the SSEC. Overall, we are seeing weakness all around and all have looked toppy.
It’s the summer doldrums market. Volumes have fallen off and last week was below normal. There is no major catalyst. The FAANGs’ bloom is finally coming off. The VIX had reached low levels and put/call ratios were favoring calls. The fear/greed index was tilted towards greed. All signs are suggesting that a top might be in. The daily MACD indicator for the S&P 500 turned down in early August. The RSI has fallen below 50. Other indicators are also turning negative. The weekly indicators are rolling over but have not as yet given a sell signal.
We have failed thus far to reach our target of 4,800 for the S&P 500. The high so far—4,607. Right now, only new highs could end this starting downdraft and keep the 4,800 target alive. We have noted for some time that tops into July/August/September are not usual. Dates still etched in our minds are August 1987 and September 1929. And, also, July 1990 and July 1998. Okay, the 2000 dot.com crash topped in March 2000 and the financial crisis top was October 2007.
A confirmed top doesn’t come in until we break under 4,400, based on the daily charts. On the weekly charts, we are a way off as we have to break down under 4,100. For monthly charts, the breakdown is under 3,500. That’s the October 2022 low that saw the S&P 500 signal a bear market as it fell 27.5% altogether. The NASDAQ fell almost 38%. But, as we have so often noted, corrections come in waves of three – ABC. So far, we have the A wave down that bottomed in October 2022 and now possibly the B wave up. The C wave is to come and it is usually the most dangerous one. But will it be a swift decline as we saw in 2008 or a more grinding decline as we witnessed in 1973–1974? This one could be more of a grinder, but it remains to be seen. A black swan event as we had with the pandemic or the collapse of the sub-prime market in 2008 is needed it to turn it into a swift decline. Yes, we are concerned about commercial real estate, sub-prime car loans, rising mortgage rates, an ongoing war, and extreme weather events that just keep on coming. The EU is faltering but things remain somewhat buoyant in the U.S. spurring talks of the soft landing, the Goldilocks economy. So far, no big rise in unemployment. And the last GDP report seemed good, even if under the surface there are growing problems. Even consumer confidence faltered this past week as the Michigan Consumer Sentiment Index came in at 67.3 vs. an expected 68. This week we get retail sales. Is the consumer still spending?
The stock market tends to lead. We await confirmation that a top is in.
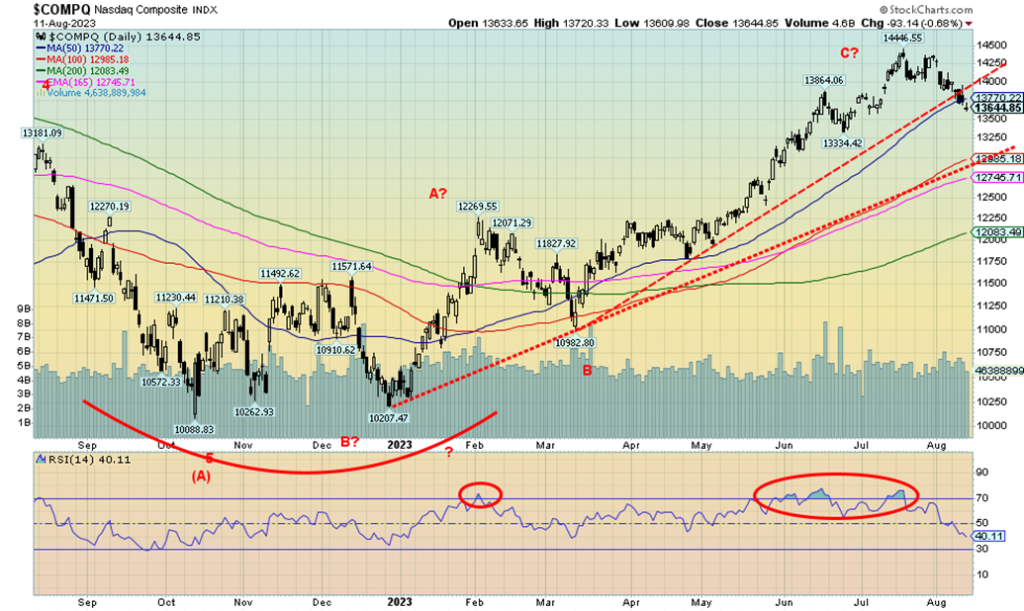
The NASDAQ and FAANGs that took this market up are all faltering. This past week, the NASDAQ fell 1.9% and took out that trend line from a low in March 2023. Could it next be a freefall to the uptrend line, just below 13,000? If that falls and we go under 12,750, the next stop is the 200-day MA near 12,100. The NY FANG Index fell 3.6% this past week and was the main reason the market fell. What took markets up is now potentially taking markets down. Unless you were in Google last week, everything else fell. Google gained 1.3%. Big losers were Tesla, down 4.4%, Baidu, off 7.0%, Advanced Micro, off 7.1%, Snowflake, down 8.0%, and the former big leader Nvidia down 8.6%. The party, it seems, is over. It was fun while it lasted but, like the dot.com bubble of the late 1990s, this was inevitable. What goes up can come down even faster. So, will this help take the rest of the market down with it? That remains to be seen, but if the big leaders are falling the rest are sure to follow.
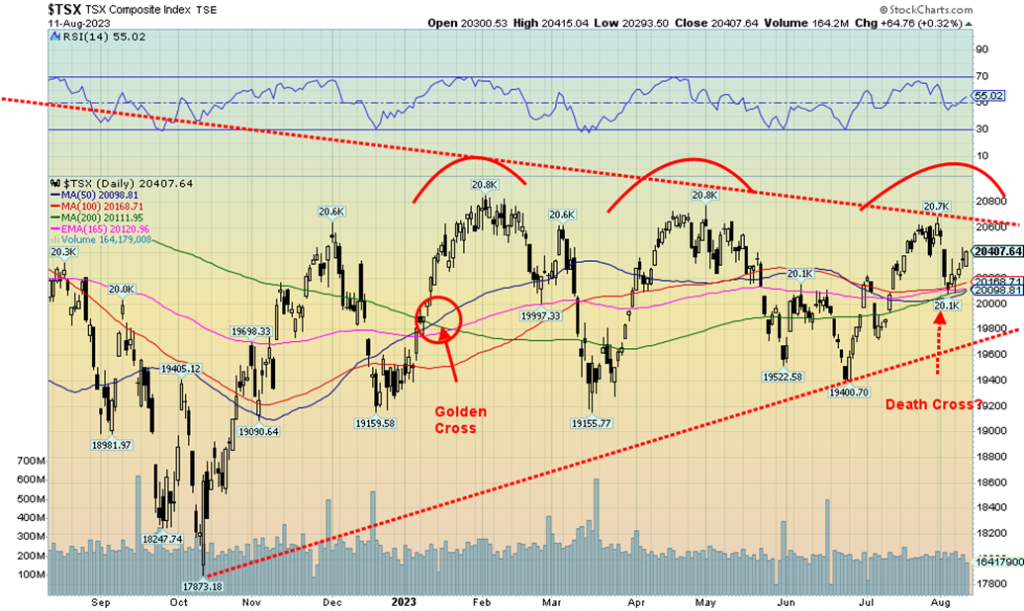
The TSX Composite successfully eked out a 0.9% gain this past week. The TSX found support at the convergence of all of the 50-, 100-, and 200-day MAs and at the 165-day EMA. An unusual convergence. The TSX is giving off sell signals as the 50-day MA crossed the 200-day MA. That is known as the death cross. The TSX Composite appears to be setting up a potential descending triangle. A descending triangle is characterized by a series of lower highs and a relatively flat series of lows. Highs are seen in January and May near 20,800 and again recently slightly lower closer to 20,700. Lows were seen in December at 19,159, March at 19,155, and, recently, slightly above in June at 19,400. A breakdown under 19,900 and definitely under 19,800 could signal the start of at least a mini-bear. Under 19,400, it is assured. Potential targets, assuming the pattern is valid, are down to 18,200/18,300 or 11% from current levels. This past week 12 of the 14 sub-indices recorded gains led by Telecommunications (TTS), up 3.3%. Other significant gainers were Consumer Staples (TCS), up 2.8%, and, Energy (TEN), up 2.7%. The two losers? Consumer Discretionary (TCD), off 3.1%, and Metals & Mining (TGM), down 0.9%. The junior TSX Venture Exchange (CDNX) was not spared as it lost 1.4% on the week. The juniors are unloved and unnoticed. The drop could get underway in earnest once under 20,100 and definitely under 20,000. Only firm new highs above 20,800 could change this growing negative scenario.
U.S. 10-year Treasury Bond/Canadian 10-year Government Bond (CGB)
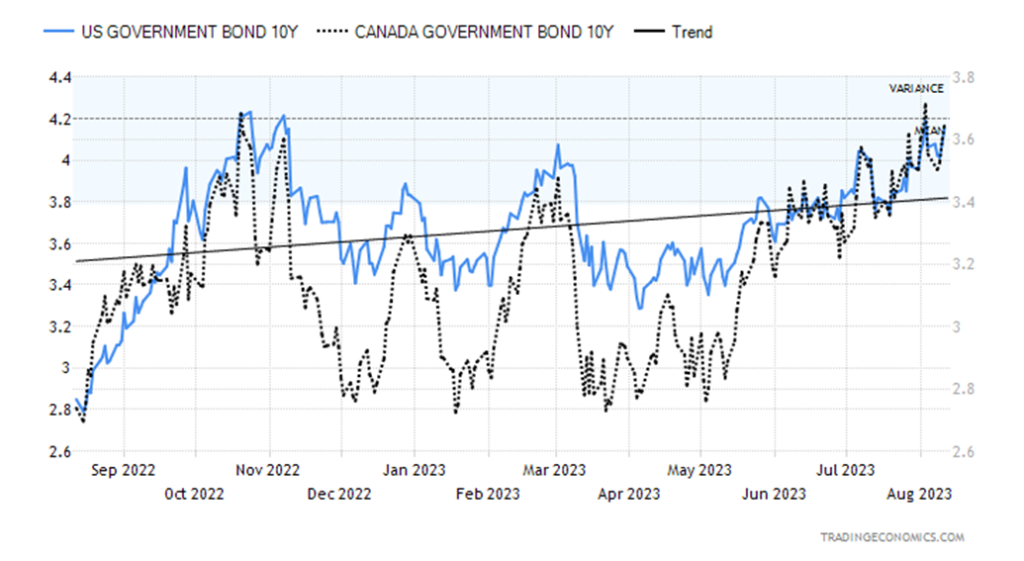
Bond yields are now climbing relentlessly. The U.S. needs money and the only way to attract it is higher interest rates. With a budget deficit estimated at between $1.7 and $1.8 trillion, the U.S. has to raise considerable funds in 2023. Interest on the debt at 3% is now approaching $1 trillion annually. No wonder Fitch has downgraded the U.S. from AAA to AA+, joining S&P. Oddly, neither of Moody’s or DBRS have followed—yet. Nonetheless, the downgrade hasn’t helped. Since August 1, when Fitch downgraded the debt, the U.S. 10-year treasury note jumped a further 16 bp, hitting a high of 4.18% vs. the 4.16% close this past week. That was up about 3.0% on the week. Canada jumped as well to 3.65% from 3.55% up 2.8%. The inverted yield curve and was largely unchanged this past week. The U.S. 2–10 spread was negative 74 bp vs. negative 73 bp the previous week while the Canadian 2–10 spread was unchanged at 103 bp. While the inverted yield has 100% of the time predicted a recession, the recession does not get under way until at least 6–12 months later following a bottom. So far, we do not have a confirmed bottom.
The U.S. economy continues to hum along despite everything and inflation is still falling, despite the bump last month. With rising oil prices, however, inflation may rear its head again. But the U.S. has to raise a lot of funds and someone has to buy at all that debt. What we are seeing, however, is a rise in intragovernmental purchases and, as well, increased central bank buying. But not China as they continue to divest themselves. The latest numbers we saw has China’s holdings down to $846 billion in May from $869 billion in April. But it is intergovernmental buying that is saving the U.S., as even central bank buying falters. There has been some increase from the private sector of mutual funds, insurance companies, banks, etc. The yields are attractive but they could go higher.
With the inflation numbers out of the way, the focus this coming week is retail sales and industrial production, along with both the NY Empire Index and the Philly Fed (manufacturing indices). The week after brings home sales. Canada reports inflation numbers this coming week. But the real focus is the rising funding needs of the U.S. Treasury along with inflation to rise again, given rising energy prices. Food prices remain high and drought is not going away, cutting into growing capability. Our expectation is that the 10-year could soon take out the high of October 2022 at 4.23%. That could target next up to 4.50%.
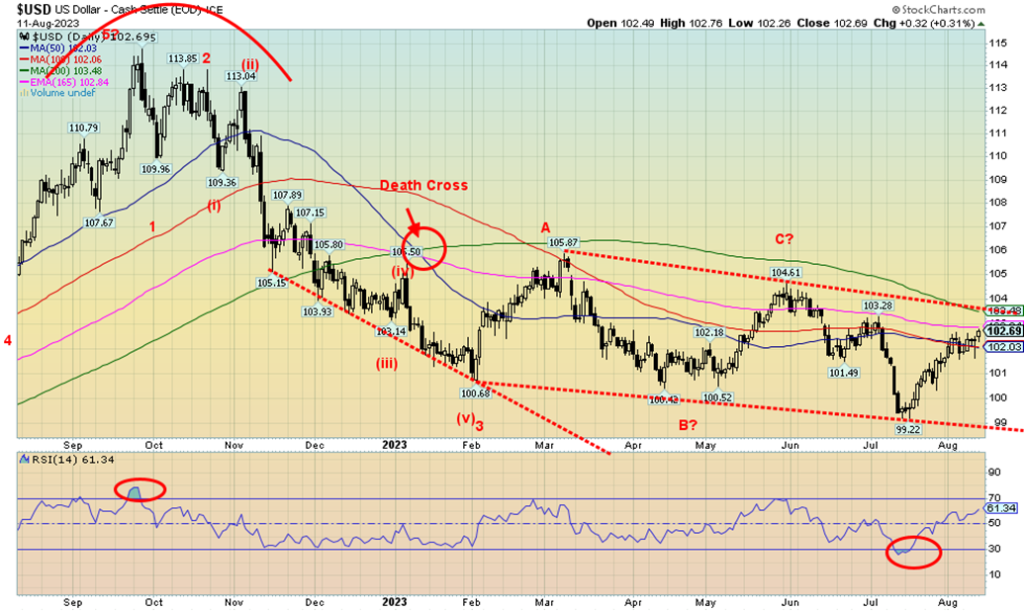
Is the US$ Index breaking out? It certainly seems that way. We broke that downtrend line from the highway back in September 2022. And we are breaking above the 50/100-day MAs. The next resistance is at the 200-day MA, near 103.50. With an RSI of 61, we have room to move higher. A rising US$ Index is negative for gold and other commodities priced in US$ but could be positive for them in other currencies. Last week the US$ Index rose 0.8%. The currencies all fell with the euro down 0.6%, the Swiss franc off 0.5%, the pound sterling down 0.4%, and the Japanese yen, the weakest of the bunch, down 2.2%. The Canadian dollar wasn’t spared as it fell 0.5%. The Canadian dollar is falling more because of the strong US$ than that it is because of a weak Cdn$. The EU is a different story as Germany falls into recession, while others such as Italy and France are teetering, as is the U.K. The EU is also weighed down more from the war between Russia/Ukraine. And with Poland and Belarus making noise at each other, it raises the potential for NATO involvement. With the U.S. economy stronger as well as rising interest rates, it is more attractive to take money out of the EU and buy U.S. treasuries. It reminds us of the 1930s when funds flowed out of Europe because of economic trouble and the rise of Nazism and into the U.S., strengthening the US$. Some of that led to the devaluation of the US$ in 1934 when the price of gold was revised upward to $35/ounce, instantly devaluing the US$. The US$ Index is not at that stage right now. But could it happen? A firm break above 104 could send the US$ Index higher, next towards 106 and the highs of March 2023. A firm break under 102 might signal a downside move, but the US$ Index needs to break 99 to suggest any major down move for the US$. We appear to be on our way to testing 103.50 and above there 104.
A rising US$ Index, rising bond yields, some inflationary concerns with rising oil prices, and concerns that maybe, just maybe, the Fed isn’t finished hiking rates just yet all conspired to push gold lower this past week. This past week saw gold lose 1.5%, silver fall 4.1% — and is now negative on the year, down 5.4%—and platinum lost 1.5%. As to the near precious metals, palladium gained 3.5% but remains down 27.2% in 2023. Copper had a miserable week, down 3.9%, which also turned copper negative for 2023. For gold, it was the worst week since June. Copper had its worst week since May.
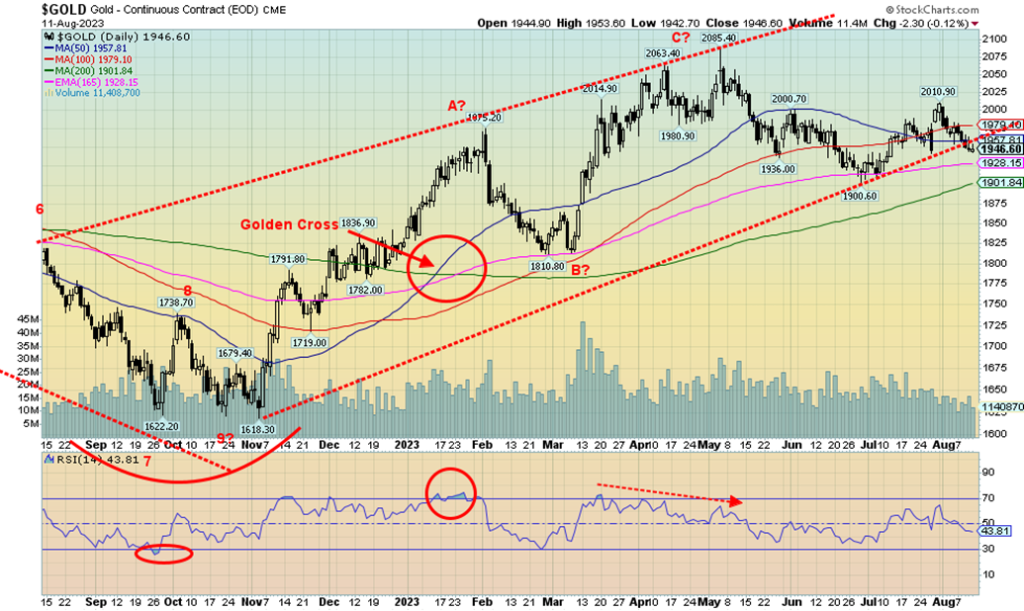
None of this is going to make the gold bugs happy. Talks of $2,500 are just that—talks. Hard to push that narrative when the market is falling. Gold broke under an uptrend line from the November low and as well the short-term trend (daily) turned neutral. Another down week and the trend turns down. The only bright spot was the gold stocks that saw the Gold Bugs Index (HUI) lose only 0.2% while the TSX Gold Index (TGD) actually rose 0.7%. The commercial COT, next, was more neutral than it was bullish. The RSI is pointed down and at 43.8 has more room to fall. Gold needs a catalyst and it is not getting it.
What could the catalyst be? While gold is touted as both an inflation and deflation hedge, gold tends to rise during times of high uncertainty, especially surrounding the government. The debt ceiling fight has been put to bed, even though it is temporary until 2025, and the election is still a year or so away. The indictment of a president continues but has so far not turned into a major blow-up, even though it could get out of hand, especially if Trump’s followers try another January 6 maneuver. What concerns us near term is that we broke the trend line and closed under $1,950 support, suggesting that we could be targeting the 200-day MA and $1,900 next.
August lows are not unusual. There was a rebound low in July/August 2015. It petered out a month or so later and we fell into our last 7.83-cycle low in December 2015 at $1,045. In August 2018, we saw an important low that signaled the start of the rally into August 2020 that culminated in the current all-time high of $2,089. We continue to question whether our important 7.83-year and 23.5-year cycle is actually in. As we have often noted, the $1,618 low last November 2022 was early in the cycle. More ideal is December 2023. But first, we should get a rebound; however, that rebound may come from lower levels later in August.
The next good support is at $1,928/$1,930, but if that breaks, then we are most likely headed for $1,900 and the 200-day MA. $1,980/$2,000 proved to be tough resistance and remains so.
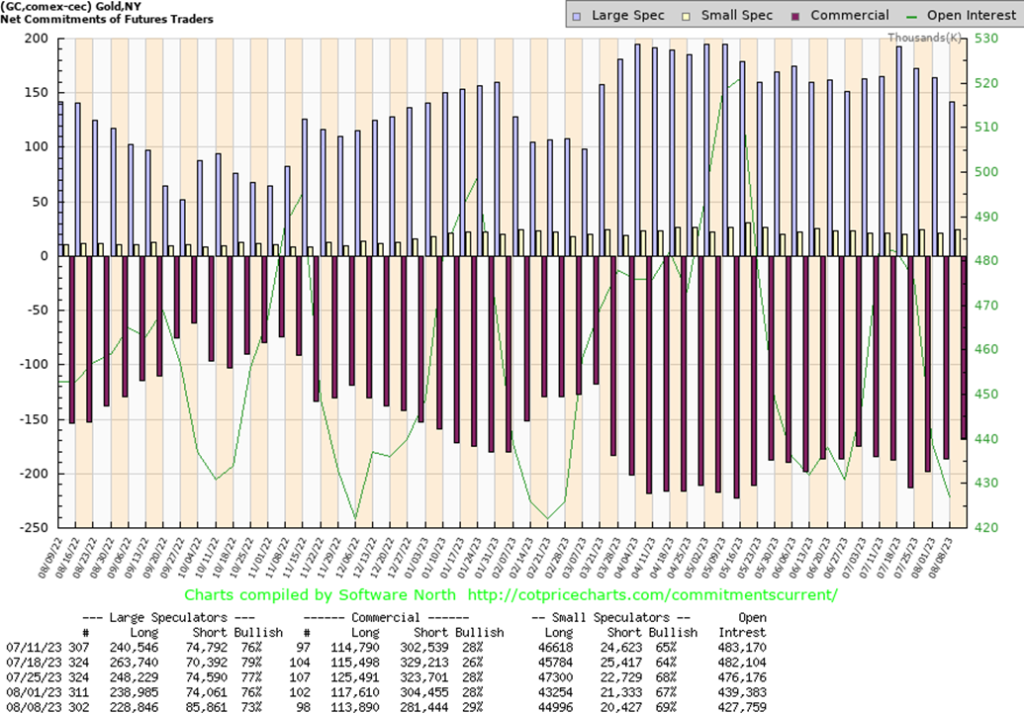
The commercial COT for gold (bullion companies and banks) rose to 29% from 28% this past week. This came despite a decrease in both long and short positions. Longs fell about 4,000 contracts while shorts fell about 23,000 contracts. The large speculators’ COT (hedge funds, managed futures, etc.) fell to 73% from 76% as longs shed about 10,000 contracts and shorts rose about 11,000 contracts. We note that total open interest dropped roughly 12,000 contracts on a down week, suggesting it was mostly long covering that occurred during the week. The report is neutral at best.
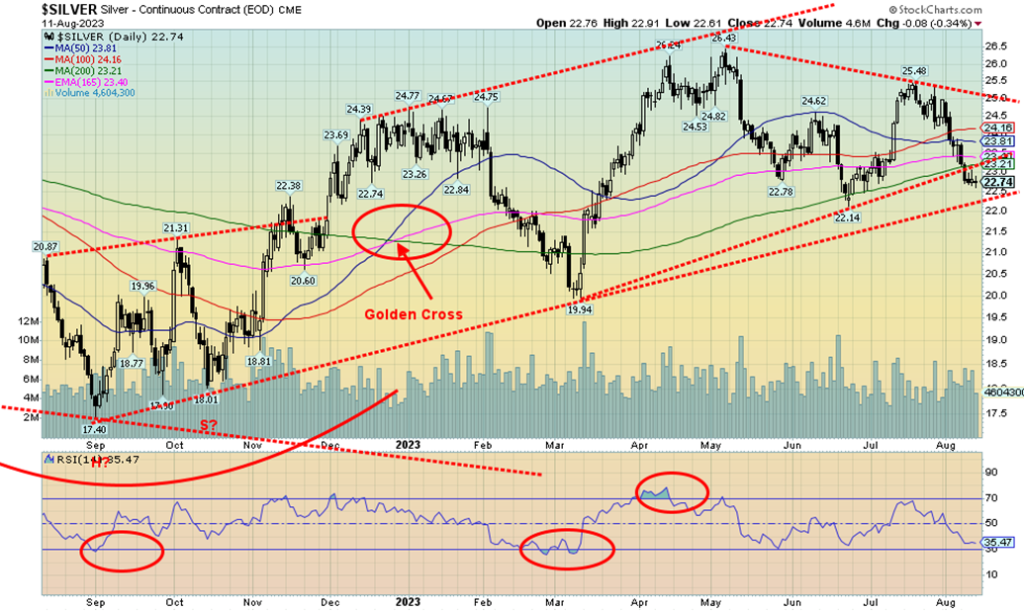
Silver continues to frustrate. As we noted in our chart of the week, the bigger picture for silver has some bullish implications and as well bearish implications. The question is, who wins? Maybe both. However, the near-term picture for silver turned somewhat bearish this past week with a decline of 4.1%, far outpacing gold’s decline of 1.5%. In both up and down markets, silver tends to lead. This time it’s down. Silver broke under the 200-day MA and as well a trendline up from lows last March 2023. The next and final support is currently around $22.25. If that breaks, and especially under $22, our next drop takes us to the March low of $19.94. And if that goes, our focus becomes the lows last near at $17.40. Not what the silver bulls want to hear. And as we noted with our chart of the week, while silver could be forming a head and shoulders bottom, a break under $19.94 could end the pattern. It’s moot to talk about supply shortages when the price is falling. Fundamentals say bullish but the technicals are bearish. The short-term trend is now down, while both the intermediate (weekly) and long-term (monthly) trends are neutral; however, another down week or so could turn them both down. That last low was at $22.14 and if that falls, we are definitely looking at the March low of $19.94. Silver, like gold, is being negatively driven by a higher US$ Index, inflation concerns with rising oil prices, and rising bond yields. Only a return back above $24 could end this current malaise. With an RSI at 35, there is room to go lower under 30. The only positive was that big jump in the commercial COT this past week (see next). But that doesn’t mean we can’t go lower first.
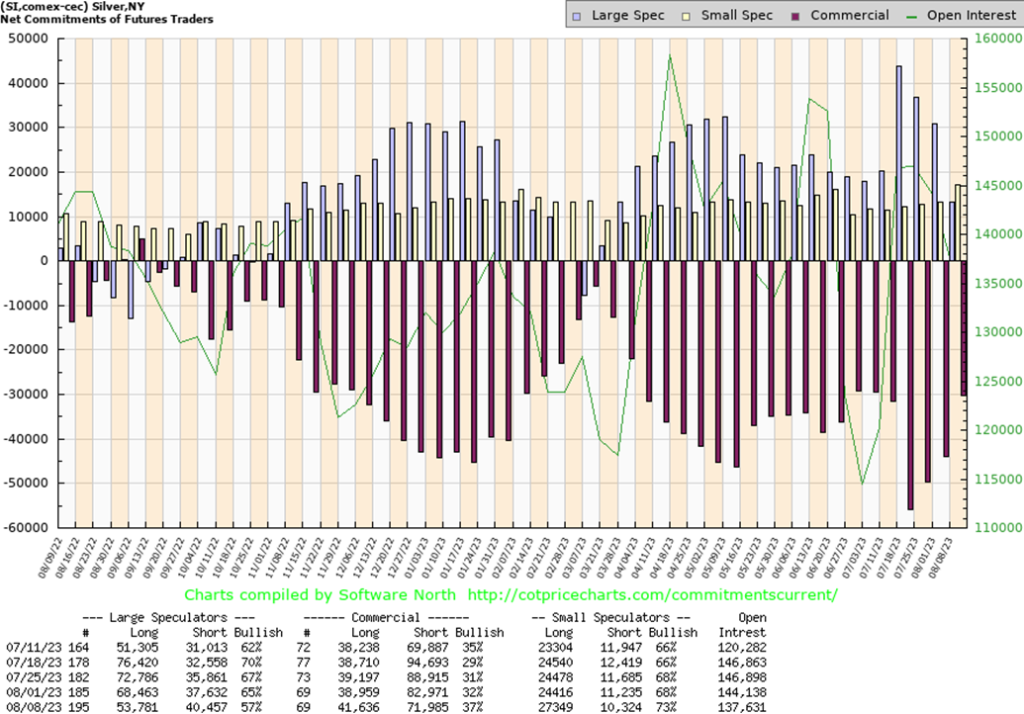
Is silver preparing for a move? The commercial COT for silver jumped to 37% from 32% this past week as longs added about 3,000 contracts while shorts fell about 11,000 contracts. By contrast, the large speculators COT dropped to 57% from 65% as they shed about 15,000 longs and added roughly 3,000 shorts. Overall, open interest dropped about 6,000 contracts on a down week, suggesting it was largely a week of short covering as silver fell. We have to view this report as mildly bullish, particularly as silver approaches key support.
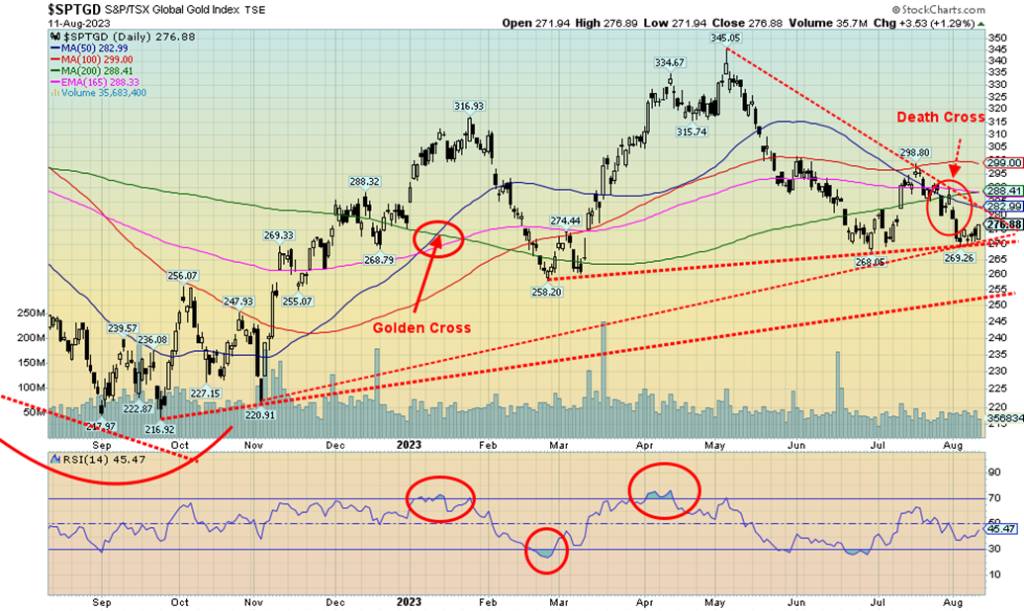
Wither gold stocks? Last week, while not a disaster for the sector, did see the 50-day MA under the 200-day MA—the death cross and a significant sell signal. Friday’s action to the upside was good, but we need to follow- through this coming week to suggest that a low might be in place. This past week the TSX Gold Index (TGD) rose 0.7% but the Gold Bugs Index (HUI) fell 0.2%. A mixed week. The TGD did find support from an uptrend line from a low in November 2022 and along a trend line connecting the lows of February/March 2023 with a low in June 2023. The reality is the TGD needs to break back above 300 to confirm any low. The Gold Miners Bullish Percent Index (BPGDM) has been falling and is now at 28.6%. That’s low, but not ultimately bearish. Last October it had fallen to 3.5%. In 2015 at the major low, it had fallen to 0—in other words you couldn’t find a bull anywhere. Nonetheless, bulls are a disappearing breed as some are throwing in the towel. In the junior gold mining sector, we suspect if they had a BPGDM it’d be close to zero as the sector is quite depressed with no movement and no interest. That is no interest despite miners still being able to raise funds for the next drilling program. Somebody believes in them. Investors must have considerable patience. Many raises are below where the deal was struck. We were encouraged by the action on Friday that saw the TGD rise 1.3%, but we need to take out 289 to suggest higher. And, as noted, get over 300 to confirm a low. A break now of 270 and especially under 267 signals lower prices and a drop to next support near 255. Volumes have been tepid, which is normal in a market like this that is getting little traction.
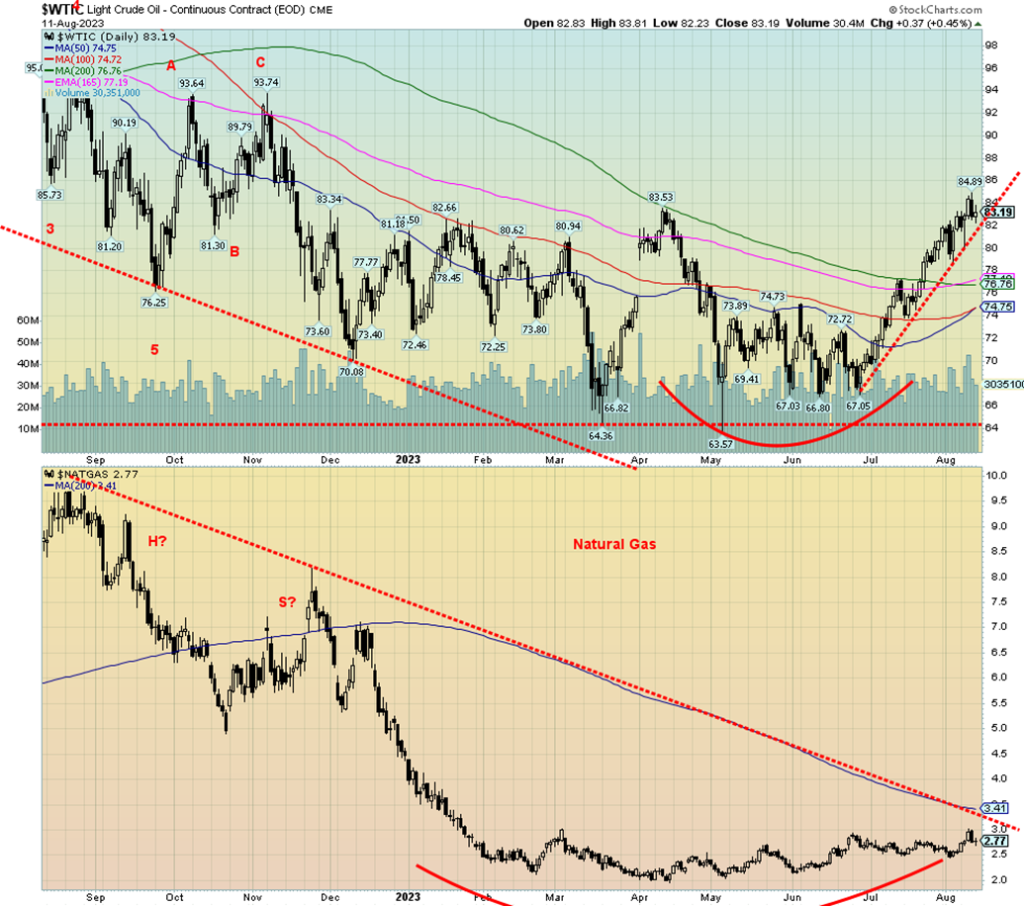
It is possible that oil prices have made at least a temporary top? Thursday saw a new high for the upward move followed by a downside reversal and a lower close. That we held together on Friday is moot. A slowing China and a large U.S. build have topped prices, at least for the moment. A break now of $82 could signal a pullback to stronger support near $76/$78. The 50-day MA is rising and appears poised to cross over the 100-day, but remains below the 200-day. A pullback would be healthy overall if this bull is to continue.
On the week, WTI oil rose 0.5% while Brent crude jumped 1.3%. Natural gas (NG) was even better as the Henry Hub rose 7.4% while the Dutch Hub in the EU was up 22.4%. Seems that falling LNG flows outweighed the fact
that storage is at record levels—87% full. In the strange world of LNG, apparently shipping to Asia is more profitable than shipping to the EU. As for oil stocks, there was a big jump in U.S. oil stocks this past week as they gained 5.851 million barrels, well above the expected 0.567 million barrels. Gasoline stocks, however, fell so that could impact gas prices at the pump.
NG continues what appears to be a rounding bottom. However, it still needs to firmly break over $3 to suggest higher prices; otherwise, the current small up/down action could continue and the rounding bottom could enlarge. Eventually it should break out. However, WTI oil needs some consolidation here if we are to continue higher. The preference is we hold above $79/$80, but if we do fall, then it becomes more important that we hold in the $75/$78 zone. Under $74, we are liable to go down again to test the lows. This is the first time we are successfully over the 200-day MA for WTI since June 2022 when WTI jumped to between $125/$130 following the outbreak of hostilities between Russia/Ukraine.
We remain positive on the outlook for both oil and gas, but a consolidation now for oil would work off some of the speculative excess. NG just continues to make its potential rounding bottom, but it could still be a month or two away from breaking out to the upside.
__
(Featured image by Zlaťáky.cz via Unsplash)
DISCLAIMER: This article was written by a third party contributor and does not reflect the opinion of Born2Invest, its management, staff or its associates. Please review our disclaimer for more information. This article may include forward-looking statements. These forward-looking statements generally are identified by the words “believe,” “project,” “estimate,” “become,” “plan,” “will,” and similar expressions. These forward-looking statements involve known and unknown risks as well as uncertainties, including those discussed in the following cautionary statements and elsewhere in this article and on this site. Although the Company may believe that its expectations are based on reasonable assumptions, the actual results that the Company may achieve may differ materially from any forward-looking statements, which reflect the opinions of the management of the Company only as of the date hereof. Additionally, please make sure to read these important disclosures.
Copyright David Chapman 2023
David Chapman is not a registered advisory service and is not an exempt market dealer (EMD) nor a licensed financial advisor. He does not and cannot give individualised market advice. David Chapman has worked in the financial industry for over 40 years including large financial corporations, banks, and investment dealers. The information in this newsletter is intended only for informational and educational purposes. It should not be construed as an offer, a solicitation of an offer or sale of any security. Every effort is made to provide accurate and complete information. However, we cannot guarantee that there will be no errors. We make no claims, promises or guarantees about the accuracy, completeness, or adequacy of the contents of this commentary and expressly disclaim liability for errors and omissions in the contents of this commentary. David Chapman will always use his best efforts to ensure the accuracy and timeliness of all information. The reader assumes all risk when trading in securities and David Chapman advises consulting a licensed professional financial advisor or portfolio manager such as Enriched Investing Incorporated before proceeding with any trade or idea presented in this newsletter. David Chapman may own shares in companies mentioned in this newsletter. Before making an investment, prospective investors should review each security’s offering documents which summarize the objectives, fees, expenses and associated risks. David Chapman shares his ideas and opinions for informational and educational purposes only and expects the reader to perform due diligence before considering a position in any security. That includes consulting with your own licensed professional financial advisor such as Enriched Investing Incorporated. Performance is not guaranteed, values change frequently, and past performance may not be repeated.


Ecobnb Turns Sustainable Tourism Into Measurable Impact
Ecobnb’s sustainable tourism platform generated significant environmental and social impact in 2025, avoiding 58,207 kg of CO₂ and adding 583...


Sugar Markets Balance Biofuel Demand and Global Supply
Sugar markets in New York and London were mostly unchanged as the Iran conflict renewed interest in biofuels. Drought concerns...


The $40 Trillion Trap: Disinflation Is Not Deliverance
U.S. debt has reached $40 trillion, with $24 billion weekly interest, while deficits accelerate. Despite disinflation in CPI, from cooling...


FinTech Matures as AI and Infrastructure Drive the Next Growth Phase
Fintech markets are entering a mature phase, shifting from rapid growth to consolidation, specialization, and sustainable business models. Zurich and...


Bitcoin, and Ethereum Rise, While Cardano Enters Transition
Bitcoin and Ethereum posted modest weekend gains, supported by ETF inflows. A new proposal may protect Bitcoin from quantum threats....
 |
|
 |  |
 |
|
-
 Crypto2 weeks ago
Crypto Markets Shaken by Geopolitics and Industry Tensions
-
 Crypto1 day ago
Bitcoin, and Ethereum Rise, While Cardano Enters Transition
-

 Markets1 week ago
Dow Jones Pauses Near Record Highs as Precious Metals Lead
-

 Fintech5 days ago
Advanced Blockchain Under Pressure Amid Crypto Market Shifts