Markets
What Is Happening with Barron’s Gold Mining Index
Like the stock market, the future for the gold and silver markets will be set by the rising yields in the bond market. It may sound callous, but history shows there is nothing so bullish for gold, silver, and gold mining shares, as a massive bear market on Wall Street. And due to the market machination by the FOMC, for many decades, Wall Street is due for a whopper of a bear market.
Slowly, but surely, the Dow Jones is headed down. That isn’t saying it couldn’t turn around, and begin going up again. But if it does turn around, and you can depend that at some point it will, you have to ask yourself a question; are we in a bull or bear market? If we’re in a bull market, then a rebounding Dow Jones should continue going up until it sees the first of many additional BEV Zeros to follow in the BEV chart below.
Asking myself that question, I come up with; we’re in a bear market. So, a rebounding Dow Jones would only be a temporary upward correction, within a larger, primary movement downward.
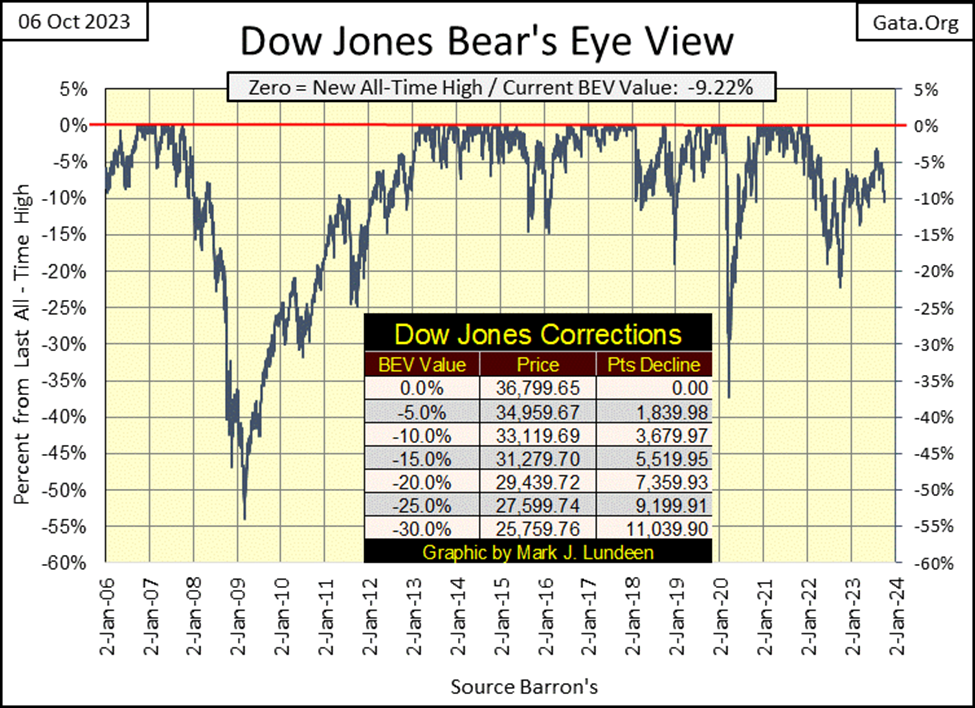
Twice last week, the Dow Jones closed with a double-digit BEV value, so it has already broken below its BEV -10% line. What’s next; the Dow Jones crossing its BEV -5% or BEV -15% line? I’m a bear, so I’m looking at the BEV -15% line. However, should the Dow Jones rise, to next cross its BEV -5% line, nothing changes in my mind – I remain a bear on this market.
Why would that be? The economy is carrying too much debt, and bond yields and interest rates have been rising for the last three years. An economy bearing massive debt loads, in a market seeing rising yields and rates, will never provide the necessary framework for a bull market in financial assets.
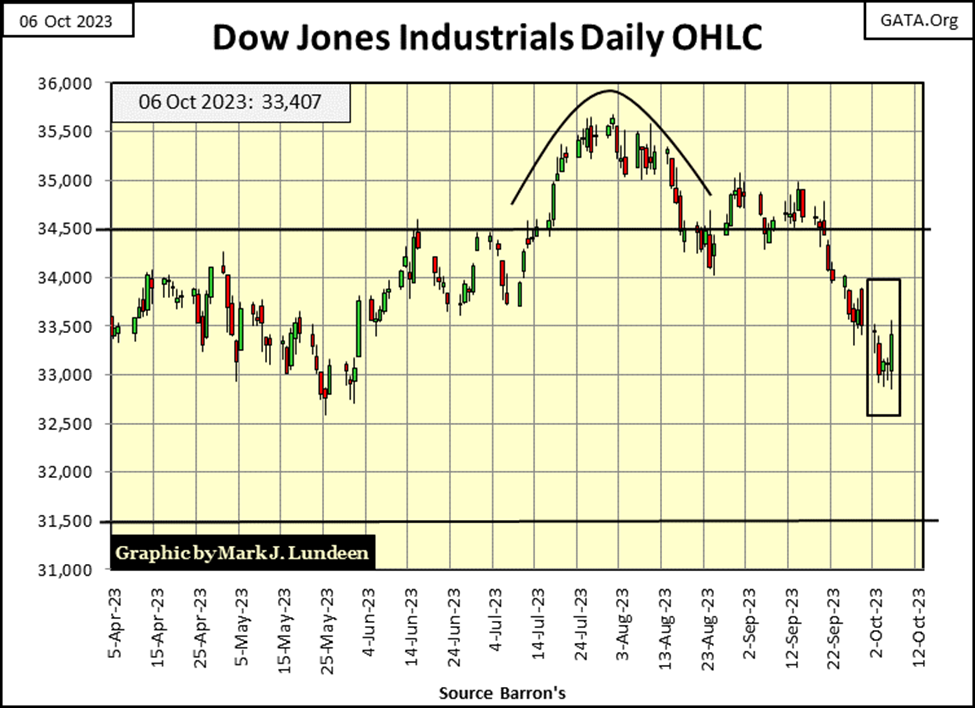
Next is the Dow Jones in daily bars. Last week I said 33,500 was history, that I’m going to begin looking at 33,000. So far, I’ve been correct on that, with no daily closings this week above the 33,500 line, and four daily lows below 33,000. We’ve now seen three down weeks in a row, maybe we’re due for a week that takes the Dow Jones up. Should that happen, I’m still a bear on this market.
Moving on to my table of BEV values for the major market indexes I follow (two graphics below), this week, none of the major market indexes below saw any daily closes in scoring position; BEV values between -0.01% to -4.99%. In a bull market, these indexes produce many daily closes in scoring positions. That they aren’t doing so now, and haven’t for a few years, doesn’t inspire my inner bull to buy.
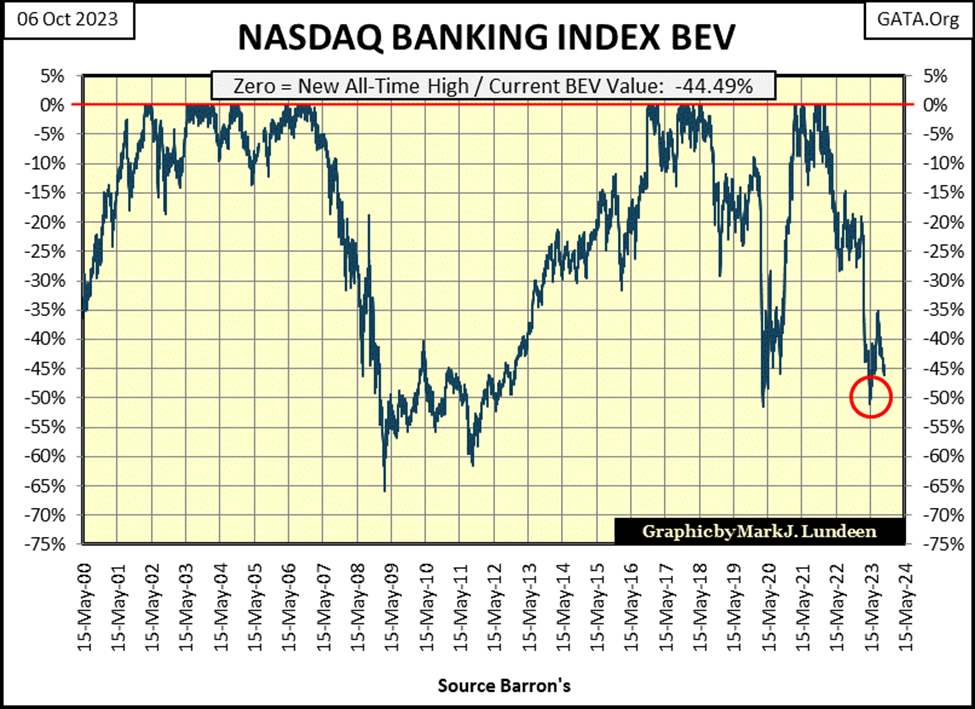
Currently, most of these indexes’ BEV values are in their teens. It’s only a matter of time before most are in their 20s, before continuing down to their 30s. My justification for continuing to be bearish is the NASDAQ Banking index, #20 in the table.
Late last May, the NASDAQ Banking index closed below its BEV -50% line (Red Circle), in its BEV Chart below, it then rebounded to its BEV -35% by late July. But since late July, the banks are once again trending towards their BEV -50% line. Should this banking index take out its lows of last May, we may see a selling panic in the stock market.
I already covered these indexes’ BEV values in my commentary above, so we move to the performance tables below.
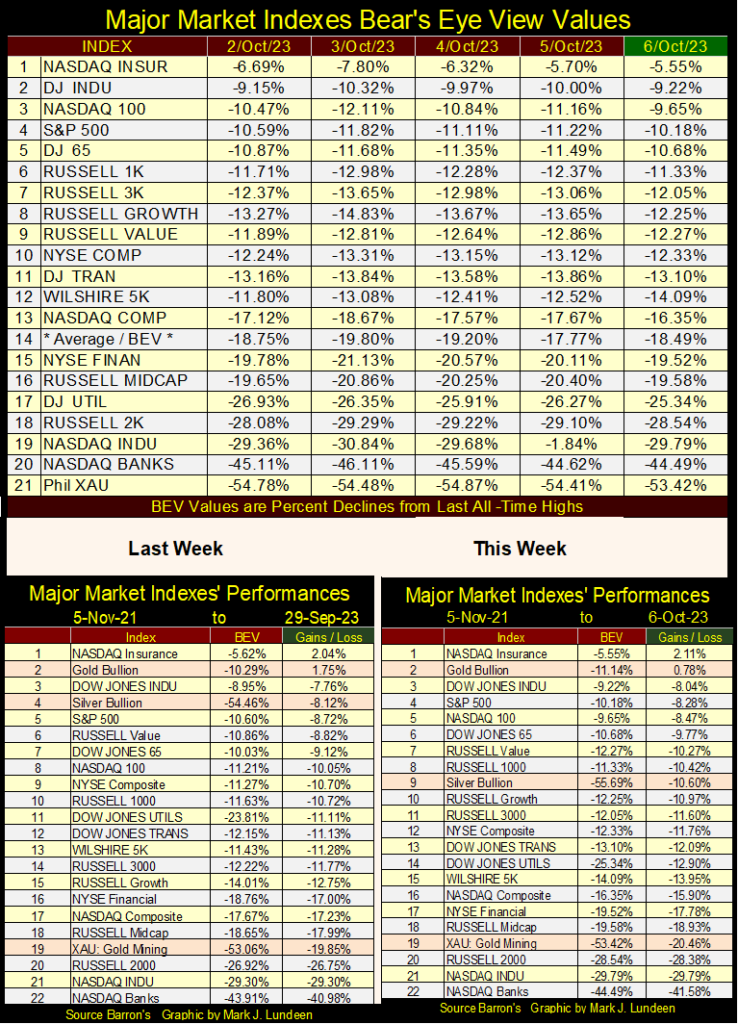
Like the XAU, silver has begun trending down in the performance table above, closing the week at #9, down from #4 the week before. What is next? Will gold follow silver and the XAU downward? With markets “regulated” as America’s are, anything can happen.
However, it may only be a matter of time before Silver and the XAU once again take their position at the top of the performance table above, as a growing dark shadow is beginning to fall on Wall Street. “Mark, what in the hell are you talking about?”
I’m talking about the growing number of 52Wk Lows at the NYSE. Since September 20th, NYSE 52Wk H-L Nets have become increasingly bearish, as seen in the red square in the table below.
When we were young; our parents told us about the birds and the bees. But the tragedy in the lives of so many investors is; that no one has ever sat them down to tell them about the bulls and the bears, so I guess this burden is left to me.
If we were in a bull market, seeing the NYSE produce * NEGATIVE * 52Wk H-L Nets, as seen in the red box below, would be a good indication that a correction in a bull market advance was at its bottom, making this a good time to buy.
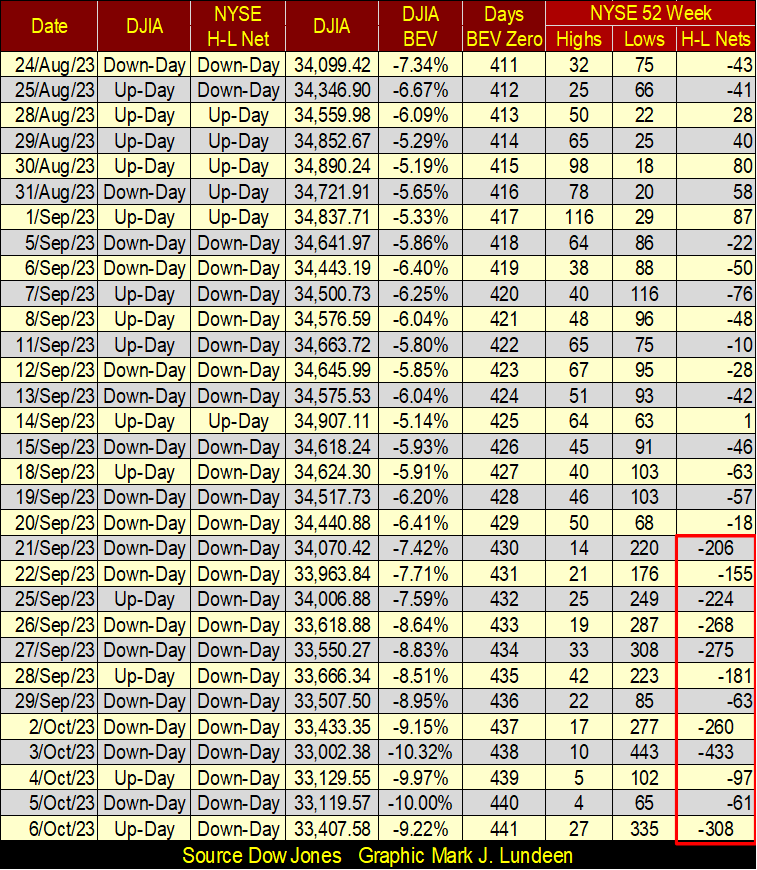
But in a bear market, especially a BIG BEAR MARKET, seeing these triple-digit negative 52Wk H-L Nets, might just be sign of much worse to come; with many more, and much deeper 52Wk Lows pending at the NYSE.
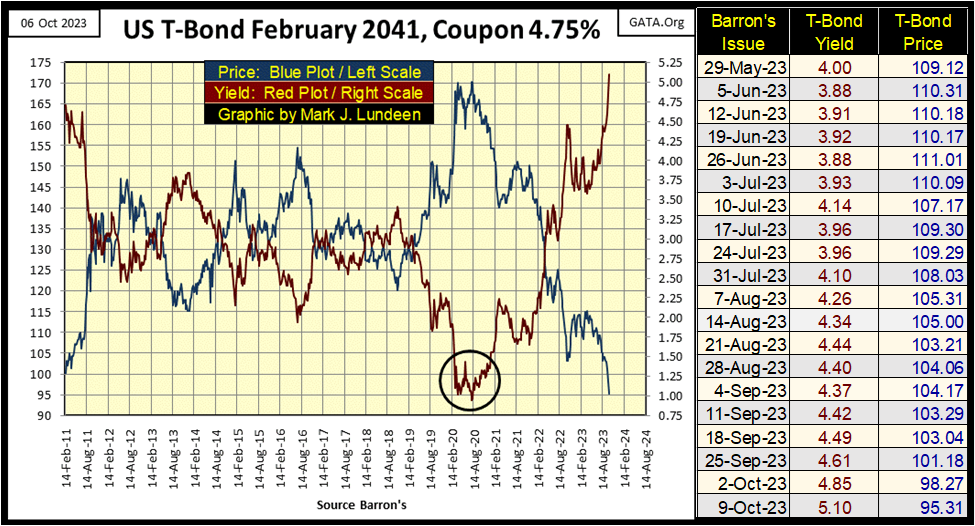
In October 2023, what justification would I have for being so bearish? Valuations in the bond markets are in a meltdown. Below is a 30-year T-bond issued in February 2011. As twelve years have passed, this T-bond is currently behaving as a 20-year bond. As with all Treasury long-bonds, their yields bottomed below 1.0% in August 2020 (Red Plot below), and have seen their yields increase by multiples since then. This week, this T-bond’s yield closed at 5.10%, well above its original coupon of 4.75%.
The impact of rising bond yields on this, and all longer-term T-bonds has been devastating to their owners. In August 2020, this bond’s valuation was at 170. This week it closed at 95.31, a 43.93% loss of valuation in the past three years.
This isn’t supposed to happen in the Treasury bond market! But, when the financial markets are managed by a bunch of idiots at the FOMC, who manhandled long-bond yields down from 4.75% in February 2011, to less than 1.00% in August 2020, the possibility of a selling panic in the bond market was made inevitable, with the worse yet to come.
That the NASDAQ Banking index’s BEV closed the week down a whopping 44.39%, may be the consequence of the massive deflation in valuations in the bond markets seen below. Should these bonds’ yields continue rising, there comes a point where the banking system will once again become ground zero, in a financial crisis on Wall Street.
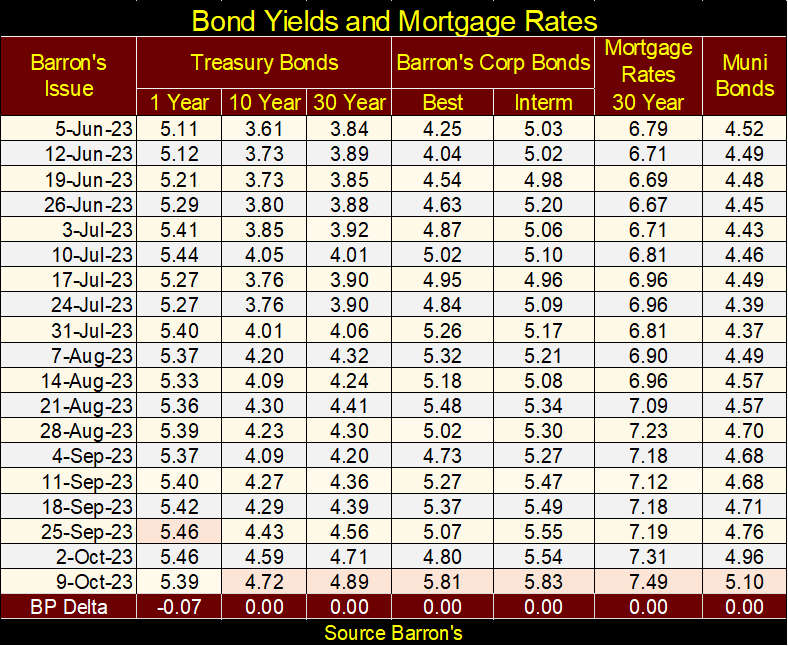
Here is a table listing some bond yields I follow, going back to Barron’s 05 June 2023 issue. The increases in these yields have become relentless. Should these trends in bond yields continue, the possibility of a selling panic on Wall Street in the not-too-distant future cannot be ruled out.
So, after learning about the bulls and the bears, what is an investor to do? I still like gold and silver bullion, and the precious metal miners.
The “policymakers” are making life difficult for the gold and silver miners, as they have for a very long time. Below is a Bear’s Eye View (BEV) of Barron’s Gold Mining Index (BGMI), going back to 1920; 103 years of data. Barron’s began publishing their gold-mining average in early 1938, when they began their Barron’s Stock Averages data series (BSA), published until October 1988 when they discontinued this weekly series. The only data series from the BSA Barron’s chose to continue publishing was their gold-mining average, rebranded as the BGMI. That is interesting to know.
The data was pushed back to 1920 thanks to Geoff, who sent me weekly data of Homestake Mining, one of the two gold miners used in 1938 for this data series, the other gold miner being Juneau Alaska Gold.
What’s a BEV chart? The Bear’s Eye View is a charting technique that eliminates the effects of monetary inflation on a series’ valuation over the decades. The first valuation in the BGMI series was 9.32 on 05 January 1920. At its last all-time high, the BGMI’s valuation was 1632.01 in Barron’s 04 April 2011 issue. Plotting the actual price data for these 103 years of gold mining history, minimizes decades of early price data, while grossly over-emphasizing the most recent data.
The Bear’s Eye View compresses the 103 years of price data for the BGMI, into a range of only 100 possible percentage points;
- 0% = New All-Time High (aka BEV Zero)
- -100% = Total Wipeout in Valuation
In the BEV chart below, BEV Zeros from the 1930s are given equal weight to new all-time highs in the 21st century; each equal to, but never more than 0% in a BEV plot. All data points not a new all-time high, are negative-percentage clawbacks from their previous all-time high. I like thinking a BEV plot displays a market as Mr Bear, being a big bear on the market, looks at market data; each new all-time high is equal to a Big-Fat Zero, all other data points as negative-percentage clawbacks by Mr Bear from these Big-Fat Zeros.
The current BEV value for Barron’s Gold Mining Index is -51.66%, a 51.66% claw-back from its last all-time high (BEV Zero) from April 2011, twelve years ago. The BGMI’s BEV Zero from April 2011, is also considered to be a Terminal Zero (TZ), the last BEV Zero of a significant advance, from which a significant claw-back in market values, a bear market follows.
Looking at the BEV plot for Barron’s Gold Mining Index, as with the banking index’s BEV chart shown last week, August 1971 proved to be a significant date in the series. The BGMI has always been a volatile market series, with large percentage claw-backs from BEV Zeros. But following August 1971, volatility exploded, as new BEV Zeros became rare market events; with 111 weekly closings at new all-time highs before August 1971, and only 46 after.

Considering the explosion of money and credit flowing from the FOMC following August 1971, this is very odd. One would believe precious metal assets would have benefited from this monetary inflation. But in fact, gold and silver bullion, and their miners typically don’t benefit from monetary inflation flowing from the Federal Reserve. If they did, we can be sure the Federal Reserve wouldn’t inflate the money supply.
What benefits from “liquidity flowing” from the FOMC, are stocks, bonds, and real estate, creating big-bull markets on Wall Street. That is until these markets’ valuations become bloated, at risk of having their inflated valuations come crashing down in a deflationary bust.
Not always, but typically what drives valuations for gold, silver and their miners upwards, is deflation in the stock, bond and real estate markets. Two excellent examples of precisely this happening occurred during the Great Depression Crash, and the 2000 – 02 NASDAQ High-Tech crash, where during huge bear markets on Wall Street, Barron’s Gold Mining Index outperformed just about everything else.
A look at the Barron’s Gold Mining Index from its October 1980 Terminal Zero
Let’s focus on the BGMI from its October 1980 Terminal Zero (TZ), the last all-time high of the 1969 to 1980 BGMI bull market, to this week’s close (chart below). This TZ was the start of a twenty-year bear market in gold and silver mining, bottoming in November 2000 with an 82.53% claw-back in valuation. Such a massive claw-back in the BGMI was predictable; considering the investing public’s obsession with the high-tech issues trading at the NASDAQ during the 1990s.
At the time, investments in gold, silver, and their miners were considered something antique, something forward-thinking investors did not waste their time on. But in November 2000, the NASDAQ High-Tech shares remained near a massive bull-market top, where risks were maximum, and the potential for rewards for assuming those risks were minimal. The risk profile for the BGMI, being down over 80% from its TZ was exactly the opposite; a low-risk market, with excellent potential for gains.
Big gains in the BGMI were to follow. From its November 2000’s 82.53% claw-back, the BGMI saw a new BEV Zero in September 2007 and would see eight additional BEV Zeros in the next six months, which wasn’t much. In March 2008, disturbing rumors about the subprime mortgage market began circulating, terminating this advance in the BGMI. By November 2008, just seven months later, the BGMI had collapsed by 70% (Star in Chart Below), in what I believe to be an obvious market takedown by the big banks on Wall Street.
When Doctor Bernanke’s began his first QE in early 2009, the BGMI quickly rebounded, and once again began making BEV Zeros two years later in November 2010. Such a rapid recovery from a 70% bear market bottom is something very odd!
Then in April 2011, for no apparent reason, the BGMI once again was sent down to the market’s infernal regions, where in January 2016, it bottomed at its deepest market decline in history: an 85% claw back from its TZ of April 2011 – what was that all about?
Seen below (star & red circle), are two massive takedowns in the gold and silver miners in less than a decade, and one has to wonder, why? Especially so when one realizes the 2008 top in the BGMI saw only nine new all-time highs before it collapsed by 70%, and the 2011 top saw only five new all-time highs before it collapsed by 85%.
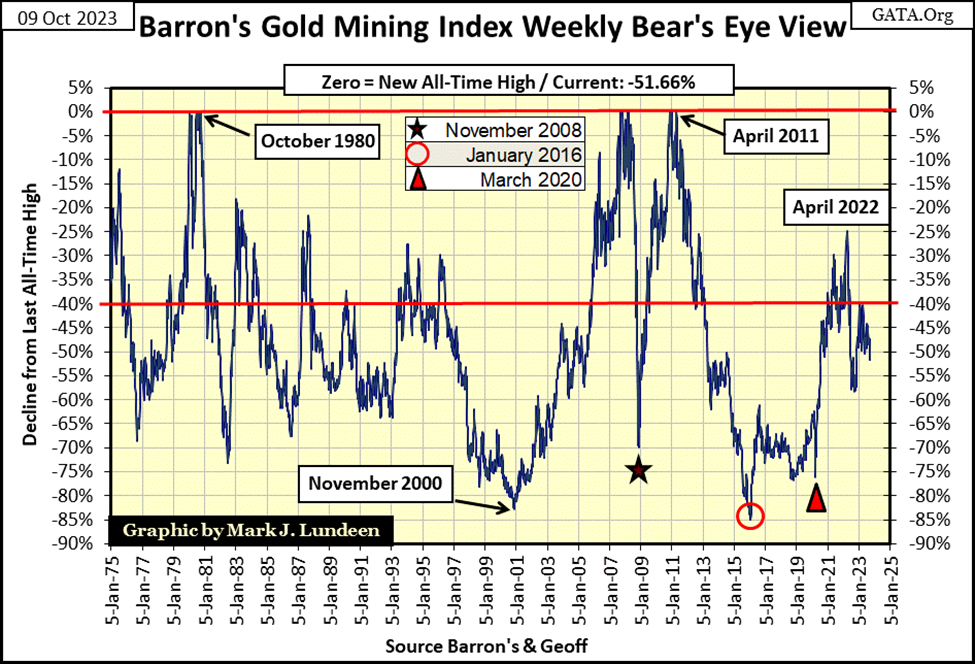
Following this massive 85% bear market bottom, the BGMI did little until the March 2020 Flash Crash (Red Triangle), where FOMC Idiot Primate Powell began his massive Not QE#4. With the idiots “injecting” trillions of dollars of “liquidity” into the financial system, in April 2022 the BGMI managed to come within only 25% of its last all-time high of April 2011. The BGMI closed this week below its BEV -50% line.
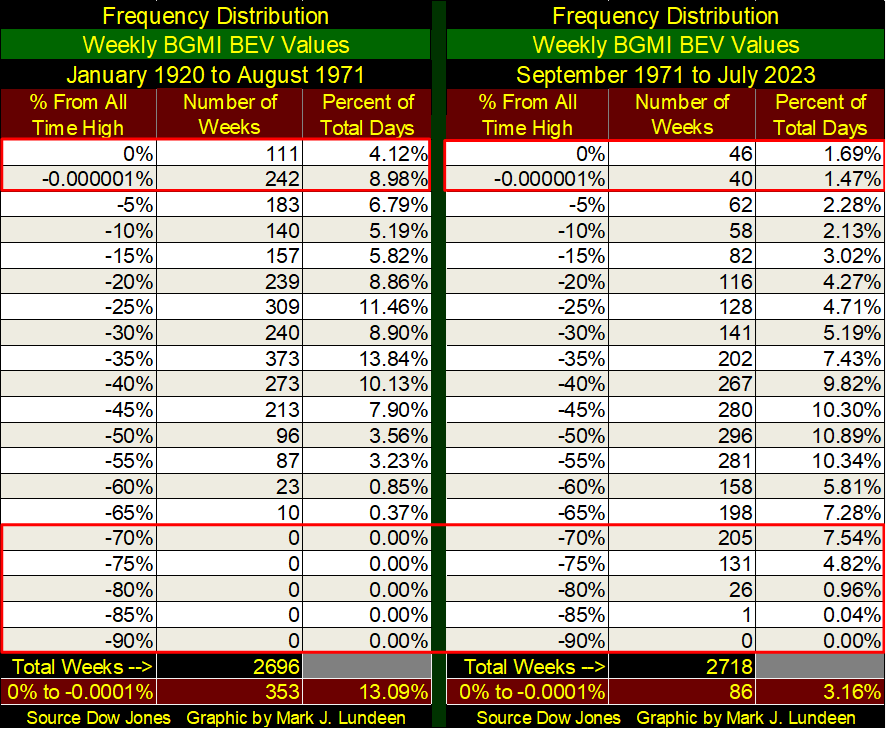
Below are two Freq Tables for the BGMI, one for the data before August 1971, the other after. I placed a red box around the 0% & -0.000001% rows, with new all-time highs recorded in the 0% row, and weekly closes in scoring position (-0.01% to -4.99%) in the -0.000001% row. In bull markets, rising market valuations increases the counts in these rows.
Both these freq tables contain slightly over fifty years of data. Prior to August 1971, the BGMI had closed at new all-time highs, or in scoring position for 13.09% of its weekly closes. After August 1971, the BGMI closed at new all-time highs, or in scoring position for only 3.16% of its weekly closes.
These tables are interesting to study, comparing the BGMI before and after August 1971. Look at the bottom red box. Before August 1971, the BGMI never closed below its BEV -70% line. After August 1971, it closed below its BEV -70% line for 13.36% of its 2,718 weekly closes. Something just isn’t right here.
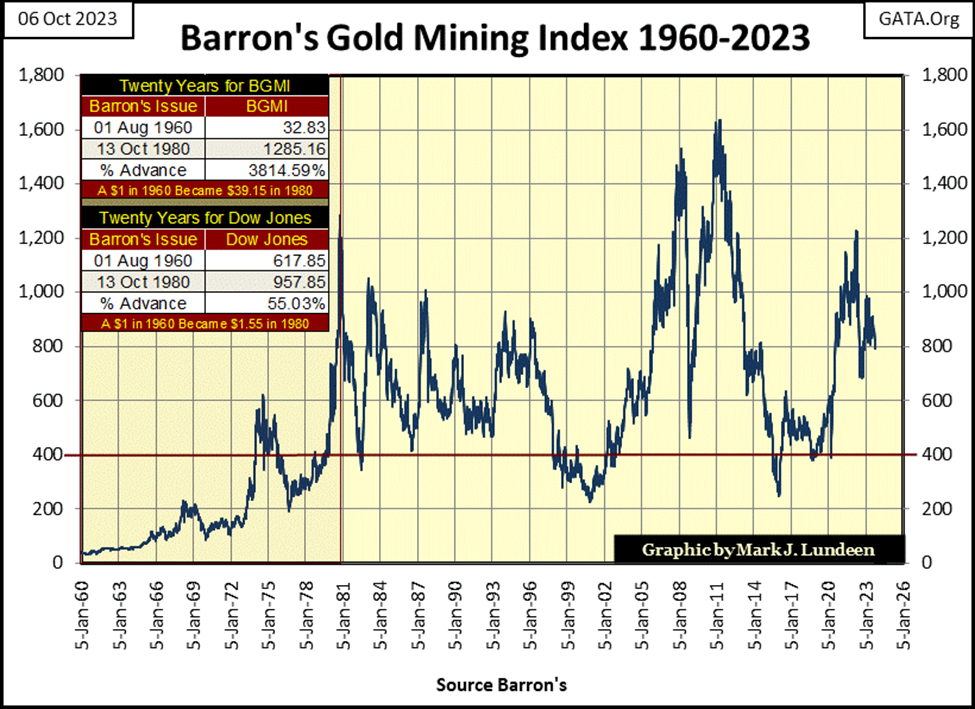
For my readers who prefer a chart of the BGMI plotted in the dollars Barron’s publishes it in, I’m posting it below, and it is a very useful chart. Currently, the BGMI is trading below where it was in 1980, which tells us the gold and silver miners are far from being widely held and overvalued.
For investors who know something about the bulls and bears, know markets that are not widely held by professional money managers and individual investors, and are significantly undervalued, are markets they want exposure to.
To protect one’s investment capital, seeing a stock group that has performed so poorly since 1980, while every other market index is many multiples above where they traded in 1980, is a real God-send from the perspective of risks and rewards.
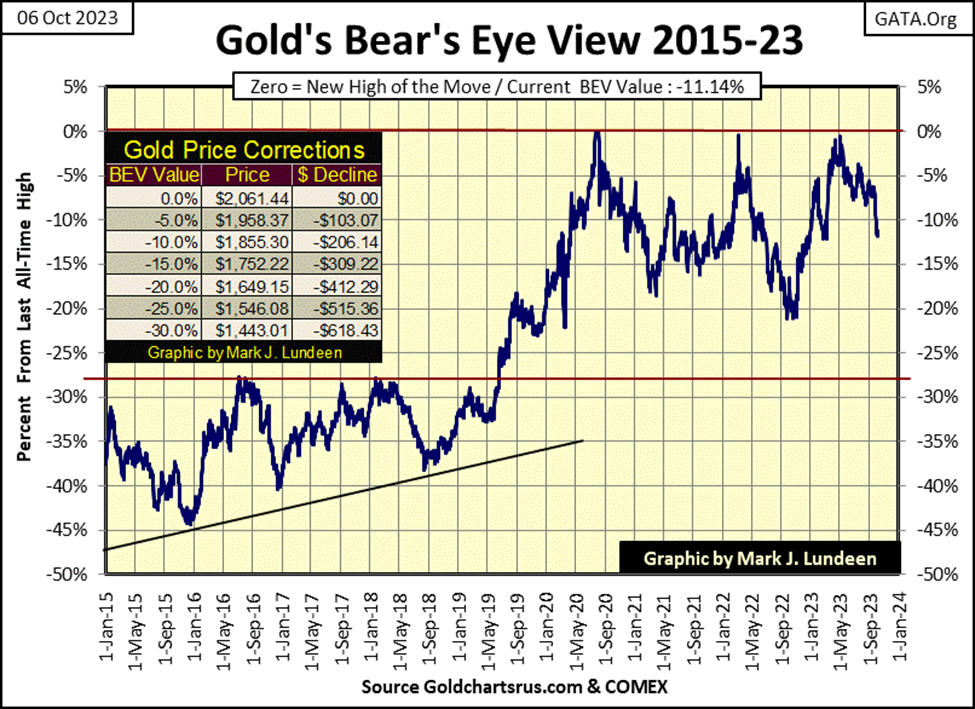
Next is gold’s BEV chart. This week gold gapped down below its BEV -10% line. This move looks like a capitulation by the bulls, which isn’t necessarily a bad thing, as that is something the bulls typically do just before a bottom. Let’s see how far the COMEX goons can drive gold down, gold’s BEV -15% line ($1752) is important here. If the goons can’t drive gold below $1752, it may have nowhere else to go but up to new all-time highs.
Like the stock market, the future for the gold and silver markets will be set by the rising yields in the bond market. It may sound callous, but history shows there is nothing so bullish for gold, silver, and gold mining shares, as a massive bear market on Wall Street. And due to the market machination by the FOMC, for many decades, Wall Street is due for a whopper of a bear market.
Everybody must have their investment money someplace. Maybe deposit it in a bank for safekeeping? In 2023, that would not be a prudent thing to do. I think a much better idea would be to wait out the coming storm with precious metal assets.
Scanning the gold’s side of the step sum table below, it appears the relentless selling in the gold market is abating. We’ll know more next week, but we may be near a bottom in gold’s current decline. I have my fingers crossed.
But then, gold’s daily volatility’s 200D M/A continues declining, closing the week at 0.62%. Typically, the BIG Bull Markets for gold and silver are manic markets, driven by desperate people fleeing deflation in the financial markets, willing to pay any price for an ounce of precious metal. Seeing gold’s daily volatility contracting down to 0.62% tells us the big show hasn’t yet begun.
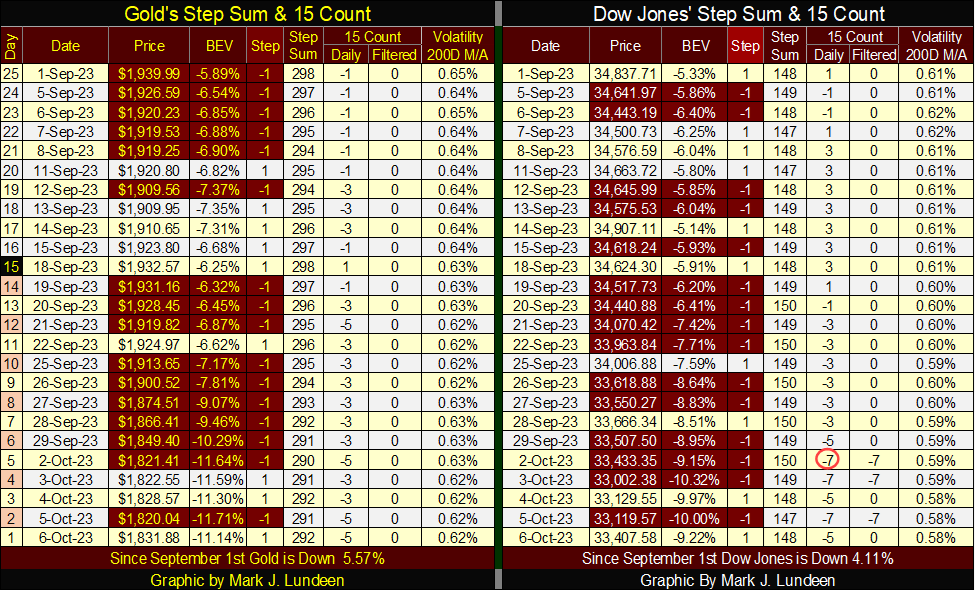
And what big show is that? The show opens with Mr Bear staring as Freddy Krueger, slashing at everything trading on Wall Street, as he gleefully watches the red ink flow on balance sheets everywhere. I personally don’t care for the act, but Mr Bear loves it so. With the Dow Jones daily volatility’s 200D M/A closing the week at 0.58%, its safe assuming Mr Bear hasn’t yet even gone to the makeup department to get into character.
My expectations for the gold market are; that it waiting for daily volatility in the Dow Jones to break above 1.00% before things get exciting for gold and silver. Until then, our lot is to just make the best of things as they are. Which in 2023, is increasingly more difficult.
__
(Featured image by Shane McLendon via Unsplash)
DISCLAIMER: This article was written by a third party contributor and does not reflect the opinion of Born2Invest, its management, staff or its associates. Please review our disclaimer for more information.
This article may include forward-looking statements. These forward-looking statements generally are identified by the words “believe,” “project,” “estimate,” “become,” “plan,” “will,” and similar expressions. These forward-looking statements involve known and unknown risks as well as uncertainties, including those discussed in the following cautionary statements and elsewhere in this article and on this site. Although the Company may believe that its expectations are based on reasonable assumptions, the actual results that the Company may achieve may differ materially from any forward-looking statements, which reflect the opinions of the management of the Company only as of the date hereof. Additionally, please make sure to read these important disclosures.


Biodiversity Becomes a Key Driver of Value and Resilience in Real Estate
Biodiversity is becoming central to the real estate sector, driven by regulations like the Biodiversity Net Gain and the demand...

Market Faces Potential Shift as Secular Bull Ages and Gold, Oil Gain Attention
Markets alternate long secular bulls and bears; 1982–2000 bull then 2000–2009 bear. Current bull is 17 years old, raising concerns...

Rising Bond Yields Signal Potential Trouble Beneath a Calm Stock Market
This week’s market was calm, but underlying conditions may be weakening. The Dow Jones has stalled without new highs, while...


Blockchain Evolves Toward AI, Finance and Quantum Security
Blockchain is evolving beyond crypto into finance, AI applications, and digital markets, while security and regulation remain challenges. Quantum threats...


The Italian Crowdinvesting Market Faces Sharp Decline in 2026
Italian crowdinvesting market continued to decline in 2026, with fundraising falling 36.8% year-on-year to €164.19 million. Platforms and active campaigns...
 |
|
 |  |
 |
|
-

 Crowdfunding5 days ago
Medelon Shooting Club Restores Hall After Successful Crowdfunding Campaign
-

 Biotech2 weeks ago
Alzheimer’s Study Reveals Immune Pathway Behind Women’s Higher Vulnerability and Potential New Treatment Approach
-
 Markets1 hour ago
Market Faces Potential Shift as Secular Bull Ages and Gold, Oil Gain Attention
-

 Crowdfunding1 week ago
Avant Devices Moves Toward Electric Wheelchair Kit Production with New Funding Drive