Markets
Update of Market Trends and an Outlook on the S&P 500, Gold, and Bonds
It is difficult finding the positives as the world appears to be fraying. Stock markets, precious metals all week. But Energy remains strong even as it may have made a temporary top once again. The US$ remains strong as the U.S. economy is the strongest of G7 and its interest rates the highest. But elsewhere we find deep divisions, possibly irreconcilable, both geopolitically and domestically.

The world is fraying. Global GDP may still be growing and GDP per capita may still be growing, but it’s applied unevenly. The world is more fragile. It’s not something that appeared overnight. Determining where and when it all started is arguable, but we cite 9/11, the bombing of the World Trade Center in NYC, as the possible beginning. That was followed by the invasion of Afghanistan, Iraq, and later, Libya and Syria. All have become failed states.
The fragility was extended with the financial crisis of 2008 and the pandemic of 2020/2021. Extreme weather events and rising global temperatures—we just came off the hottest decade in recorded history—have unleashed fierce debate, sometimes violent, between those who believe climate change is real and those who deny its existence. It has also triggered mass migrations, mostly from the globe’s south, where the worst impact of climate change along with war is being experienced, to the north where the developed countries are unable or won’t absorb them all.
The conflict between Russia and Ukraine is a sign that the potential for global war cannot be ignored. Peace is fragile. Sides are being taken, not unlike what the world saw in the buildup to World War I and World War II. The middleman, the United Nations, that rose out of the ashes of World War II, is fracturing, possibly beyond repair, and is impotent. The world needs collaboration, not confrontation, but what’s taking place is mostly the latter. Barriers to trade are rising and globalization is in retreat.
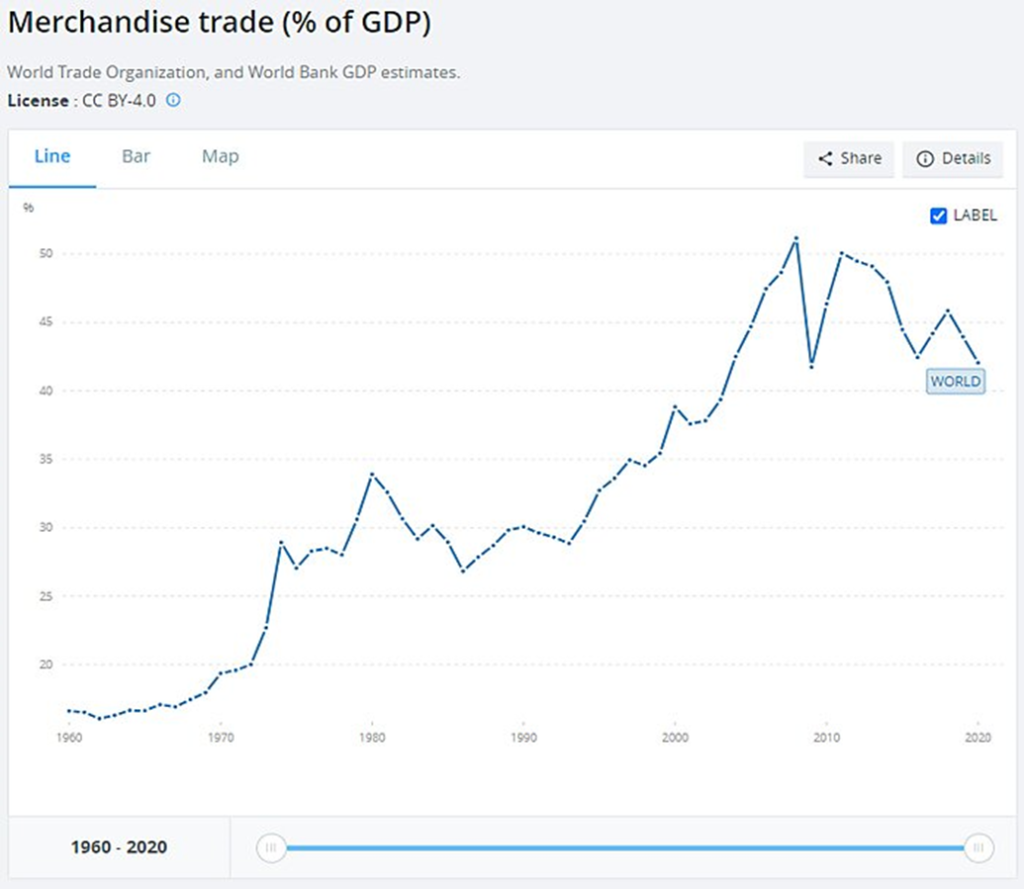
The world is breaking into rival economic blocs. Sanctions, a form of trade wars, are fragmenting the global economy. The U.S. has imposed sanctions on more than 20 countries including China and Russia, two of the world’s largest economies. Economic integration is becoming economic disintegration. Global trade slows. The best one can say about it is that it is not necessarily disintegration; it’s just changing. The chart below to 2020 shows how merchandise trade as a percentage of GDP has fallen since the financial crisis of 2008. A similar chart, focusing only on overall trade and trade in services, shows the same decline. Globalization dipped during the 1980s but exploded in the 1990s. Now, globalization is in retreat. Instead of outsourcing, the term is now insourcing, back sourcing, or onshore sourcing.
Rising fragmentation is negatively impacting the sharing of technology and the ability to solve global problems like climate change, and is sparking the disruption of supply chains, resulting in growing inflation. Economic inequality is also growing, although that was a process underway as a result of technological changes. The rise of new technologies such as AI could fragment the world even further. Economic dislocations have led to an increase in social tensions and the rise of populists with simplistic solutions who lay the blame on others.
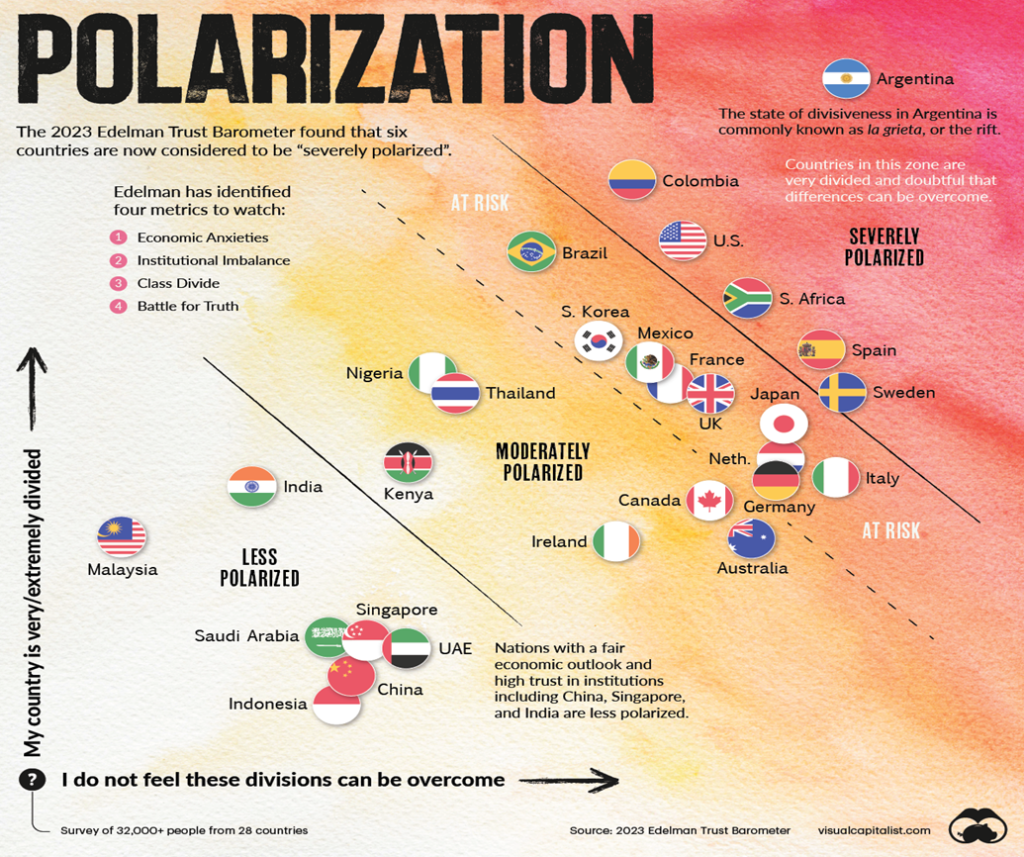
Polarization, sometimes extreme, has become the norm in many countries including the U.S. and many European countries. Even Canada, widely viewed as one of the best countries to live in and known for its stability, is fraying at the edges.
All this fragmentation comes at a cost. Trade is falling, barriers are rising, and global growth is slowing. The International Monetary Fund (IMF) is predicting that by 2028 global growth could slow to 3%, the lowest in decades. The EU, led by Germany, is falling or has already fallen into recession. North America, including both Canada and the U.S., are not far behind. Will it be the hoped-for soft landing or a hard landing? Asia is fragmented as well, with economic blocks in Japan and South Korea, both aligned with the West, that are countered by China.
Is there any going back? Another pandemic could tip the world into an even bigger economic crisis. The war in Ukraine/Russia, already delineated by the West supporting Ukraine while China and other BRICS countries back Russia, could deepen if the war were to spread. The result could be negative impacts on food security, energy security, and commodity security, with an even deeper disruption of supply chains that could send globalization into a deeper downward spiral. The ability to deal with these problems is severely hampered by severe polarization in the EU and the U.S. The private sector, caught in the middle, is almost unable to help or even unwilling to act.
Two world wars in the 20th century have highlighted the need for global cooperation, but that is falling apart as sides are taken, globalization slows, and geopolitical tensions rise, along with polarizing political tensions in the West. Surprisingly, or maybe not so much, given they are a one-party rule, polarization is less evident in Russia and China. Where all this leads is unknown. A global depression? Global war? Both, previously seen as remote scenarios, are suddenly not so unrealistic any longer.
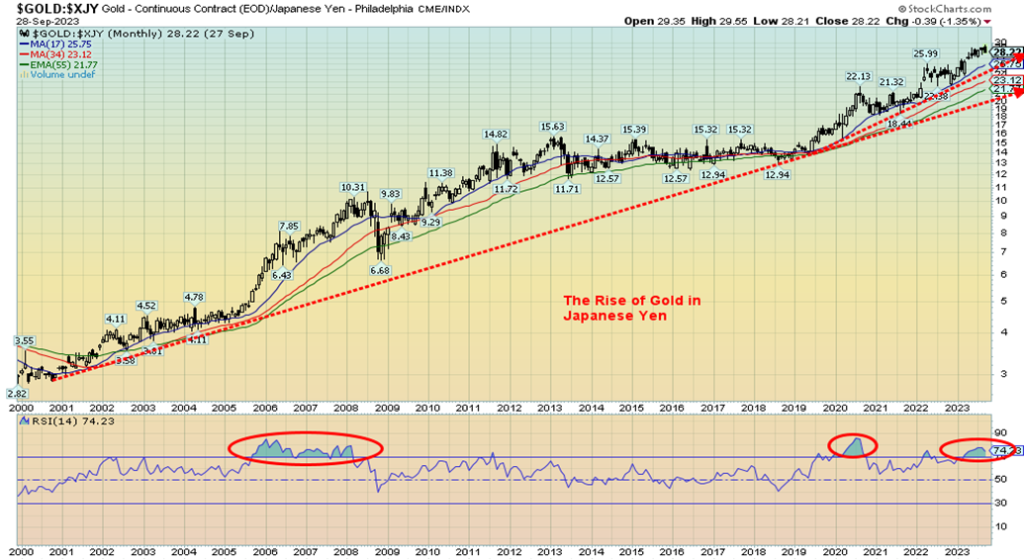
As to investments, we are already seeing negative results with rising interest rates to combat inflation, a wobbly, overvalued stock market, a wobbly, overvalued housing market, and deteriorating currencies. One of the currencies that is falling the most is the Japanese yen. Japan has been troubled by years of slow economic growth, oodles of quantitative easing (QE) trying to stimulate the economy, and interest rates held at extremely low levels, including negative interest rates. What’s happening is the yen falling so fast it is threatening to result in hyperinflation in Japan. Bonds, which have seen low yields for years including negative yields are rising threatening a possible bond crisis for the BOJ. Our chart of gold in Japanese yen terms highlights this dilemma.
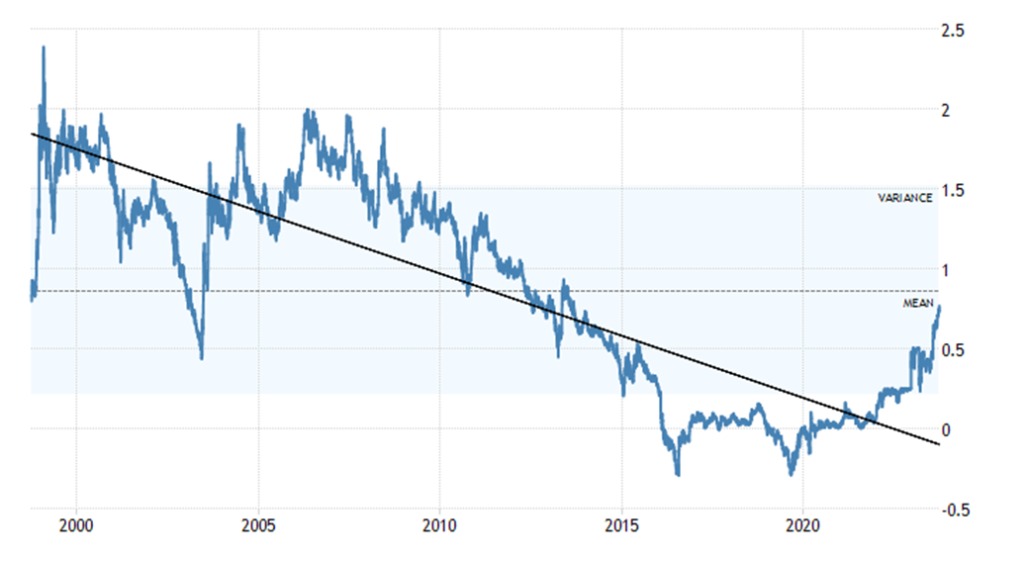
A chart of the Japanese 10-year bond (JGB) is shown below. Gold in the Japanese yen has consistently been making new all-time highs. Gold is rising as well in other currencies such as the pound sterling, the euro, the Swiss franc, the Canadian dollar, and others. All are trading just below their all-time highs. In less developed countries currencies gold is soaring to all-time highs. Gold in Turkish lira as an example is up 54% in 2023. In Argentinian pesos gold is up 86% thus far in 2023.
Japan 10-year bond (JGB) 1998-2023
What we are seeing is not so much the strength of the U.S. dollar, but rather the weakness of the other currencies. High interest rates in the U.S., along with the potential for war (Russia/Ukraine), climate change, and more are encouraging capital flows out of these countries into the U.S., even as both the U.S. bond market and the stock market fall. Mostly, however, funds are flowing into U.S. treasury bills. We witnessed a similar outflow in the 1920s and into the 1930s that eventually resulted in a massive devaluation of the U.S. dollar in 1934 when they raised the price of gold to US$35 from US$20.67. The U.S. dollar has been strengthening. Interest rates tell it all. Three-month treasury bills in the U.S. are 5.48%, eurozone 3.78%, Japan negative 0.22%, and the U.K. 5.39%.
The yen rising in gold’s terms is not good as it reflects a growing discontent and loss of confidence in the Japanese government. The fall in the value of other currencies relative to the U.S. dollar also reflects this growing discontent. Eventually, it will hit the U.S. dollar as well. A rising U.S. dollar is negative for the trillions of dollars of U.S. dollar-denominated debt in foreign countries where their revenues are in the home currency but they have to repay in U.S. dollars. Numerous countries are on the verge of bankruptcy and default as the crisis deepens.
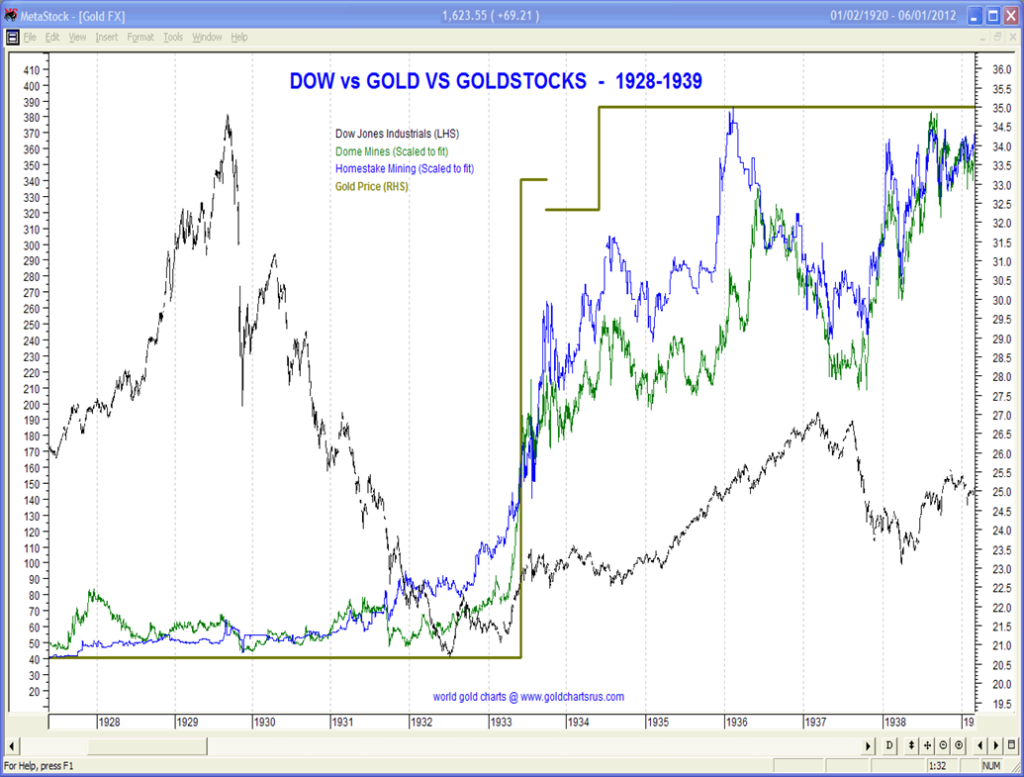
As well, there is currently a certain malaise in the gold market. As interest rates rise, the desire to hold gold is lessened, particularly since it pays nothing. But gold rising in other currencies is a reflection of the growing uncertainty. The gold bugs, of course, are super-frustrated, gold stocks are trading far below valuations, and junior miners are in a depression. Few pay attention to the market. Bitcoin, a virtual speculative asset goes up but gold, a hard asset with a long history as money goes down. However, in the 1930s, when the Dow Jones Industrials (DJI) was falling 89%, gold was rising 400%.
Our chart of the DJI vs. gold stocks, personified by Homestake Mining (now Barrick Gold), shows how, as the DJI was collapsing, the gold stocks were rising. By the time the DJI started rising out of the depths of 1932, the gold stocks really took off. The U.S. revaluation in 1934 allowed gold to rise 75%. All the while, the purchasing power of the U.S. dollar in terms of gold has been falling. Before the devaluation in 1934, US$1,000 purchased roughly 48.4 ounces of gold. Today at $1,900 it purchases 0.526 ounces of gold. That is a massive loss of purchasing power – 99%.
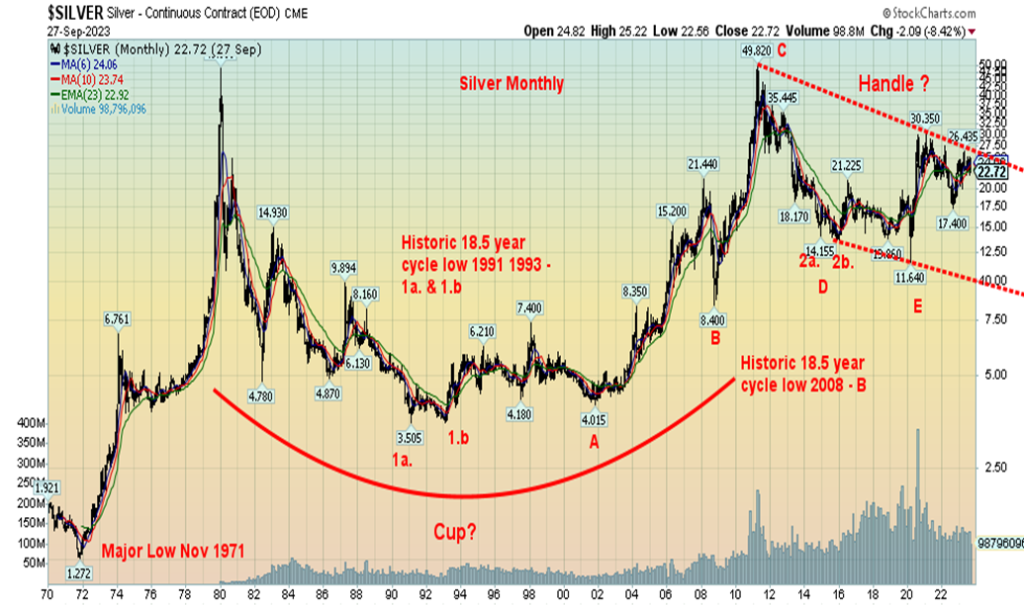
Our long-term chart of silver shows how the precious metals could burst out to the upside. Silver has been forming what appears to be a long-term cup and handle pattern. The breakout point comes at about $27, an area we have noted in the past. But the real breakout may not come until we are above $31/$32. In the interim, the risk remains of a re-test of the 2022 low of $17.40 and a collapse to the bottom of the channel currently near $10. We can’t dismiss it, unless we take out $27 and $31/$32 first.
It’s an increasingly fragmented world, both geopolitically and domestically, exacerbated by the threat of global war, climate change, the potential for further pandemics, rising interest rates and inequality, mass migrations, new, potentially disturbing technologies that could be good or bad, and more. Owning some precious metals has been long recognized as a safe haven in times of growing political dislocation.
Markets & Trends
| % Gains (Losses) Trends | ||||||||
| Close Dec 31/22 | Close Sep 29, 2023 | Week | YTD | Daily (Short Term) | Weekly (Intermediate) | Monthly (Long Term) | ||
| Stock Market Indices | ||||||||
| S&P 500 | 3,839.50 | 4,288.05 | (0.7)% | 11.7% | down | up (weak) | up | |
| Dow Jones Industrials | 33,147.25 | 33,507.50 | (1.3)% | 1.1% | down | neutral | up | |
| Dow Jones Transport | 13,391.91 | 14,968.77 | (0.1)% | 11.8% | down | neutral | up | |
| NASDAQ | 10,466.48 | 13,219.32 | 0.1% | 26.3% | down | up (weak) | up | |
| S&P/TSX Composite | 19,384.92 | 19,541.27 | (1.2)% | 0.8% | down | down | up | |
| S&P/TSX Venture (CDNX) | 570.27 | 558.88 | (2.0)% | (2.0)% | down | down | down | |
| S&P 600 (small) | 1,157.53 | 1,151.26 | 0.4% | (0.5)% | down | down | neutral | |
| MSCI World | 1,977.74 | 2,043.77 | (2.1)% | 3.3% | down | down | neutral | |
| Bitcoin | 16,531.31 | 26,933.27 | 1.5% | 62.9% | up | neutral | neutral | |
| Gold Mining Stock Indices | ||||||||
| Gold Bugs Index (HUI) | 229.75 | 206.79 | (7.3)% | (10.0)% | down | down | down | |
| TSX Gold Index (TGD) | 277.68 | 252.74 | (6.7)% | (9.0)% | down | down | down | |
| % | ||||||||
| U.S. 10-Year Treasury Bond yield | 3.88% | 4.58% | 3.2% | 18.0% | ||||
| Cdn. 10-Year Bond CGB yield | 3.29% | 4.03% | 3.1% | 22.5% | ||||
| Recession Watch Spreads | ||||||||
| U.S. 2-year 10-year Treasury spread | (0.55)% | (0.58)% | 13.4% | (5.5)% | ||||
| Cdn 2-year 10-year CGB spread | (0.76)% | (0.85)% | 15.0% | (11.8)% | ||||
| Currencies | ||||||||
| US$ Index | 103.27 | 106.20 | 0.6% | 2.8% | up | up | up | |
| Canadian $ | 73.92 | 73.83 | (0.6)% | (0.1)% | neutral | down (weak) | down | |
| Euro | 107.04 | 105.69 | (0.7)% | (1.3)% | down | down | down (weak) | |
| Swiss Franc | 108.15 | 109.24 | (0.9)% | 1.0% | down | down | up | |
| British Pound | 120.96 | 122.00 | (0.3)% | 0.9% | down | down | neutral | |
| Japanese Yen | 76.27 | 66.92 | (0.7)% | (12.3)% | down | down | down | |
| Precious Metals | ||||||||
| Gold | 1,826.20 | 1,866.10 | (4.1)% | 2.2% | down | down | up | |
| Silver | 24.04 | 22.45 | (5.8)% | (6.6)% | down | down | neutral | |
| Platinum | 1,082.90 | 915.90 | (2.0)% | (15.4)% | down | down | down | |
| Base Metals | ||||||||
| Palladium | 1,798.00 | 1,256.00 | flat | (30.1)% | up | down | down | |
| Copper | 3.81 | 3.74 | 1.1% | (1.8)% | neutral | down | neutral | |
| Energy | ||||||||
| WTI Oil | 80.26 | 90.79 | 0.8% | 13.1% | up | up | up | |
| Nat Gas | 4.48 | 2.93 | 1.7% | (34.6)% | up | up | down | |
New highs/lows refer to new 52-week highs/lows and, in some cases, all-time highs.
For the fourth consecutive week stocks fell, pushing the short-term trends negative and now threatening to turn the weekly intermediate trend negative. On the week, the S&P 500 (SPX) fell 0.7%. On the month, the SPX was down 4.9% and, on the quarter, (Q3) the SPX was down 3.6%. The other indices followed. The Dow Jones Industrials (DJI) fell 1.3%, while the Dow Jones Transportations (DJT) was a bit of a star, down only 0.1%. The NASDAQ actually gained just under 0.1% while the S&P 400 (Mid) was up 0.3% and the S&P 600 (Small) was up 0.4%. That was a divergence between the large (SPX) Mid (400) and Small (600). Could a short-term rally be coming?
In Canada, the TSX Composite fell 1.2% with 11 of the sub-indices down on the week, led by Golds (TGD) falling 6.7%. Leading the three gainers was Energy (TEN), up 4.1%. The junior TSX Venture Exchange (CDNX) continued its recent misery, falling about 2.0%. In the EU, the London FTSE fell 1.0%, the EuroNext was off 0.6%, the Paris CAC 40 was off 0.7%, and the German DAX fell 1.2%. In Asia, China’s Shanghai Index (SSEC) was off 0.7%, the Tokyo Nikkei Dow (TKN) was down 1.7%, and Hong Kong’s Hang Seng (HSI) was down 1.4%. The World MSCI Index was down 2.1%. No joy anywhere. However, Bitcoin jumped 1.5%. We confess it is odd that a purely speculative instrument that has little world use was up, but stocks were down. Hard assets such as gold fell.
The stock market is not going to be helped by the current U.S. government fight over funding of government spending. The crisis has been put off for only 45-days. The uncertainty continues. Ukraine is a sticking point as one side believes that the U.S. should stop funding Ukraine and get the combatants to the table to work out a peace agreement. A starting point may be the earlier Minsk Accords which Ukraine agreed to and then rejected.
Rising oil prices are not helping the stock market either. That is raising the fear of further inflation and then further rate hikes from the Fed. The 10-year U.S. treasury note rose to 4.58% from 4.44% the previous week or 3.2%. However, the inverted yield curve of the 2-year–10-year fell to 58 bp from 67 bp. Is a recession getting closer? The stock market is not going to respond positively to a recession, particularly if interest rates continue to remain elevated. Both the housing market and the commercial real estate market are suffering and a crash there could still happen. Concern is also rising over the U.S. debt that is now over $33 trillion. There still has been no agreement on the debt ceiling except to push it off into the future, thus avoiding a potential U.S. default. That said, any government shutdown could result in another credit rating downgrade, this time from Moody’s. If they cut the U.S. credit rating, they would be joining S&P and Fitch.
Oil prices are rising because of production cuts from Saudi Arabia and Russia. As well, there is growing concern about the sharply falling U.S. crude oil stock reserves. Gasoline stocks bounced back but remain low, while crude oil stocks are trending towards lows seen in 2022. WTI oil was up 0.8% on the week but faded late in the week on thoughts that Saudi Arabia might ease its cuts. Brent rose 0.9%. Natural gas (NG) crept closer to $3 up 1.7% while the EU Dutch Hub NG rose 5.2%. The energy stocks, represented by the Arca Oil & Gas Index (XOI), were up 1.3% but the TSX Energy Index (TEN) rose 4.1%. Both indices faded late in the week. Oil is facing some resistance up to $95.
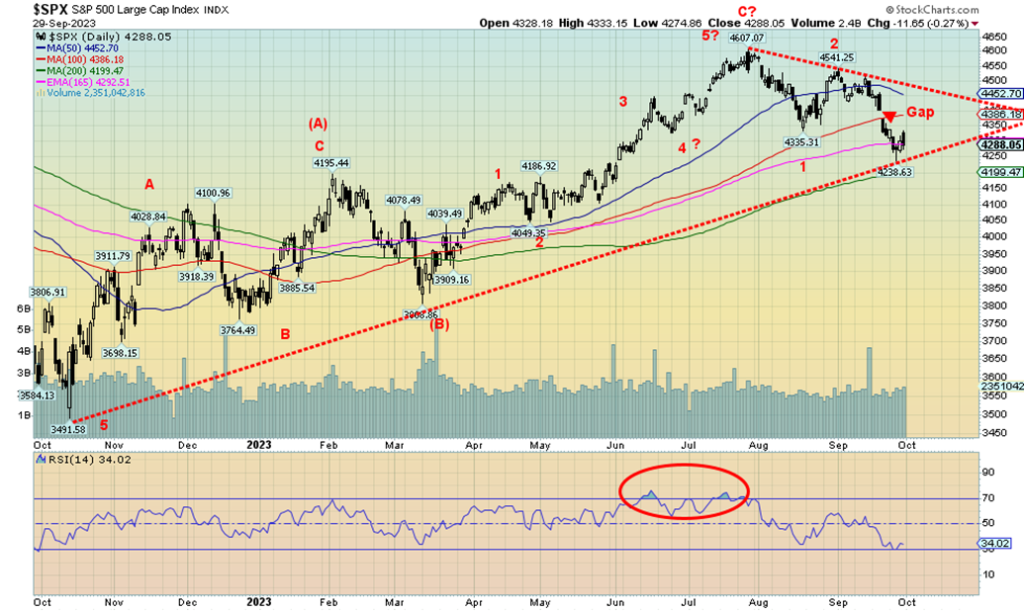
SPX bounced off the uptrend line from the October 2022 low. Will it hold? Markets tried to bounce this week, then fell sharply on Friday. Rallies are faded. A breakdown under 4,250 would be negative and under 4,200 we could be entering a bear market. SPX is down 7% from the July 2023 high. Conditions are currently approaching oversold; however, there is room to move lower. The fear and greed index are currently at fear. At least that’s better than extreme fear. A move back above 4,400 would be positive and suggest we could be moving higher. As we noted, the Mid and Small cap stocks rose this past week, a divergence from the large-cap SPX.
Bearish signs are everywhere, but on the other hand, if everyone is bearish it could suggest who else is going to sell. The trend is down, while the longer-term trends are weakening and could officially turn down as well. Deep divisions in the political situation in the U.S. are not helping.
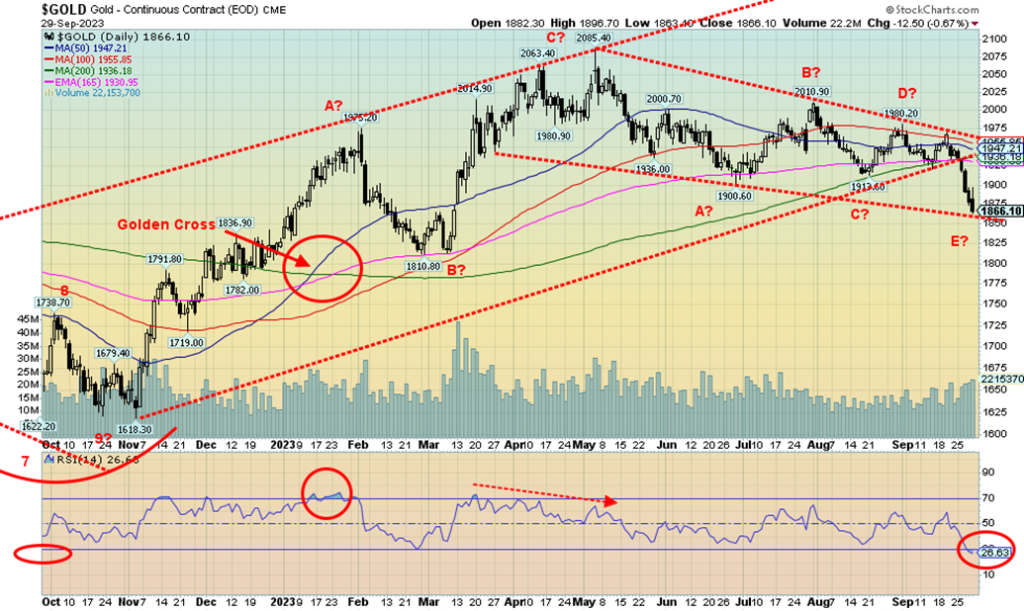
Has gold reached its nadir? Okay, at minimum, a temporary nadir. We appear to have hit the bottom of a channel that formed. The RSI is under 30. Fear is stalking the street. The Gold Miners Bullish Percent Index has fallen to 10%. It’s not an absolute bottom—it hit zero at the major bottom in 2015. Other sentiment indicators are also quite bearish. Technical indicators are in bear territory, with many, including the RSI as noted, in deep oversold levels. Why? Well, fears continue that the Fed will continue to hike interest rates and keep them higher for longer. Bond yields continue to rise. The US index keeps rising. Gold that pays nothing drops. Gold has fallen on the week, and on the month, and is down over the last quarter. Junior gold miners are in a depression. Bitcoin goes up but gold, a real hard asset, goes down.
However, there are some positive signs on the horizon, despite the negatives. The looming U.S. government shutdown may be a catalyst even if the current crisis has been pushed out for 45 days. One of the positives for gold is loss of confidence in the government. We also noted that the inverted yield curve became considerably less inverted this past week, suggesting that the inverted yield has most likely bottomed. A recession is looming on the horizon. The question as always is, how steep will it be? The Fed and some economists say shallow. Others are calling for a hard landing.
The Japanese yen has been making all-time highs in gold terms. With the rising US$ Index, that means other currencies are falling but those currencies priced in gold have been rising. No, most outside of the yen have not recently made all-time highs. But they are not falling much either, relative to gold priced in U.S. dollars. Finally, we continue to have divergences between gold and silver as gold recently fell to new lows for the current move, but silver has not, although we note it’s close to making new lows.
On the week, gold fell 4.1%. In the month, gold was down 4.6% and on Q3 gold fell 3.6%. Silver fell even more. This past week, silver was down 5.8%, while platinum dropped about 2.0%. The near PMs saw palladium flat and copper actually gaining 1.1%. Rising copper is also positive for gold. But with the US$ Index rising and bond yields, as measured by the U.S. 10-year treasury note, rising to the highest levels since 2007, fear of higher interest has gripped the gold market. The gold 10-year ratio has fallen 89% since 2020 when bond yields were at their lowest level ever. If there is any consolation, the ratio was even lower in 1999–2001 when gold was making its major low. From 1999 to 2011 the ratio rose 2,400% in favour of gold.
The gold stocks were hammered lower again. The Gold Bugs Index (HUI) fell 7.3% while the TSX Gold Index (TGD) was down 6.7%. The Gold/HUI ratio remains at elevated levels, suggesting gold stocks are very cheap relative to the price of gold. Despite the depressed conditions, there are positive signs. Our closely-watched major cycles of 7.83 years and 23.5 years appear to be continuing to play themselves out. Barring a complete collapse, gold could be making a higher low to the November 2022 low $1,618. Our focus is on the December 12–13 FOMC. Expectations are that the Fed could hike again, but it most likely could be the last one. A similar event played out in December 2015 at the FOMC. The Fed hiked rates and gold soared into 2016. Is a repeat coming?
U.S. 10-year Treasury Bond/Canadian 10-year Government Bond (CGB)
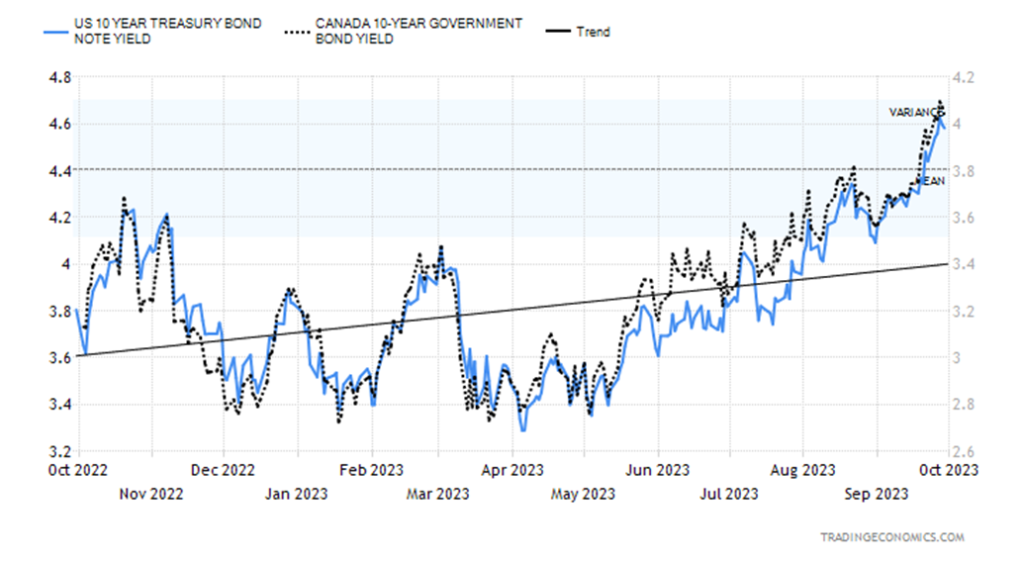
All we can say is interest rates are moving higher and our expectations are that they could move higher again. A government shutdown is not going to be friendly to interest rates. During the last shutdown, interest rates had been in the process of shutting down but rose during the shutdown. As we have noted, Moody’s, we believe, is poised to downgrade the U.S. debt which has now surpassed $33 trillion. And a reminder that there is still no real agreement on the debt limit. An extension is just a temporary fix. The U.S. is the only country we know that has these debt limit and government spending fights. All due to laws passed years ago during wartime. What it causes is huge confrontations every time limits come up due to the deep polarization in the U.S.
__
(Featured image by Jingmin Pan via Unsplash)
DISCLAIMER: This article was written by a third party contributor and does not reflect the opinion of Born2Invest, its management, staff or its associates. Please review our disclaimer for more information.
This article may include forward-looking statements. These forward-looking statements generally are identified by the words “believe,” “project,” “estimate,” “become,” “plan,” “will,” and similar expressions. These forward-looking statements involve known and unknown risks as well as uncertainties, including those discussed in the following cautionary statements and elsewhere in this article and on this site. Although the Company may believe that its expectations are based on reasonable assumptions, the actual results that the Company may achieve may differ materially from any forward-looking statements, which reflect the opinions of the management of the Company only as of the date hereof. Additionally, please make sure to read these important disclosures.
Copyright David Chapman 2023
David Chapman is not a registered advisory service and is not an exempt market dealer (EMD) nor a licensed financial advisor. He does not and cannot give individualised market advice. David Chapman has worked in the financial industry for over 40 years including large financial corporations, banks, and investment dealers. The information in this newsletter is intended only for informational and educational purposes. It should not be construed as an offer, a solicitation of an offer or sale of any security. Every effort is made to provide accurate and complete information. However, we cannot guarantee that there will be no errors. We make no claims, promises or guarantees about the accuracy, completeness, or adequacy of the contents of this commentary and expressly disclaim liability for errors and omissions in the contents of this commentary. David Chapman will always use his best efforts to ensure the accuracy and timeliness of all information. The reader assumes all risk when trading in securities and David Chapman advises consulting a licensed professional financial advisor or portfolio manager such as Enriched Investing Incorporated before proceeding with any trade or idea presented in this newsletter. David Chapman may own shares in companies mentioned in this newsletter. Before making an investment, prospective investors should review each security’s offering documents which summarize the objectives, fees, expenses and associated risks. David Chapman shares his ideas and opinions for informational and educational purposes only and expects the reader to perform due diligence before considering a position in any security. That includes consulting with your own licensed professional financial advisor such as Enriched Investing Incorporated. Performance is not guaranteed, values change frequently, and past performance may not be repeated.


Blockchain Evolves Toward AI, Finance and Quantum Security
Blockchain is evolving beyond crypto into finance, AI applications, and digital markets, while security and regulation remain challenges. Quantum threats...


The Italian Crowdinvesting Market Faces Sharp Decline in 2026
Italian crowdinvesting market continued to decline in 2026, with fundraising falling 36.8% year-on-year to €164.19 million. Platforms and active campaigns...


Sartorius Stedim Biotech Maintains Growth Momentum in H1 2026
Sartorius Stedim Biotech reported solid H1 2026 results, with revenue reaching €1.527 billion and EBITDA rising to €479 million. Growth...


Bank of Africa Launches BOA MDM Network to Boost Diaspora Investment in Morocco
Bank of Africa launched the BOA MDM Network to channel diaspora remittances into productive investment, aiming to raise their share...


Switzerland’s Medical Cannabis Reform Advances Access, But Barriers Remain
Switzerland’s 2022 medical cannabis reform improved patient access by removing federal approval requirements, but challenges remain. MEDCAN highlights barriers including...
 |
|
 |  |
 |
|
-

 Biotech1 week ago
Legend Biotech: Growth Driven by CAR-T Innovation and Carvykti Expansion
-

 Crowdfunding4 days ago
Medelon Shooting Club Restores Hall After Successful Crowdfunding Campaign
-

 Biotech2 weeks ago
Alzheimer’s Study Reveals Immune Pathway Behind Women’s Higher Vulnerability and Potential New Treatment Approach
-

 Crowdfunding1 week ago
Avant Devices Moves Toward Electric Wheelchair Kit Production with New Funding Drive