Featured
Bear Market Week #7
The “policymakers” aren’t going to allow Mr Bear to go about his duties of cleaning up the mess currently residing in most balance sheets around the globe, and deflate inflated market valuations back to historical market standards without a fight. The bottom of this bear market was on March 23rd, with the Dow Jones closing at a BEV of -37.09%. However, that might not be the ultimate bottom.
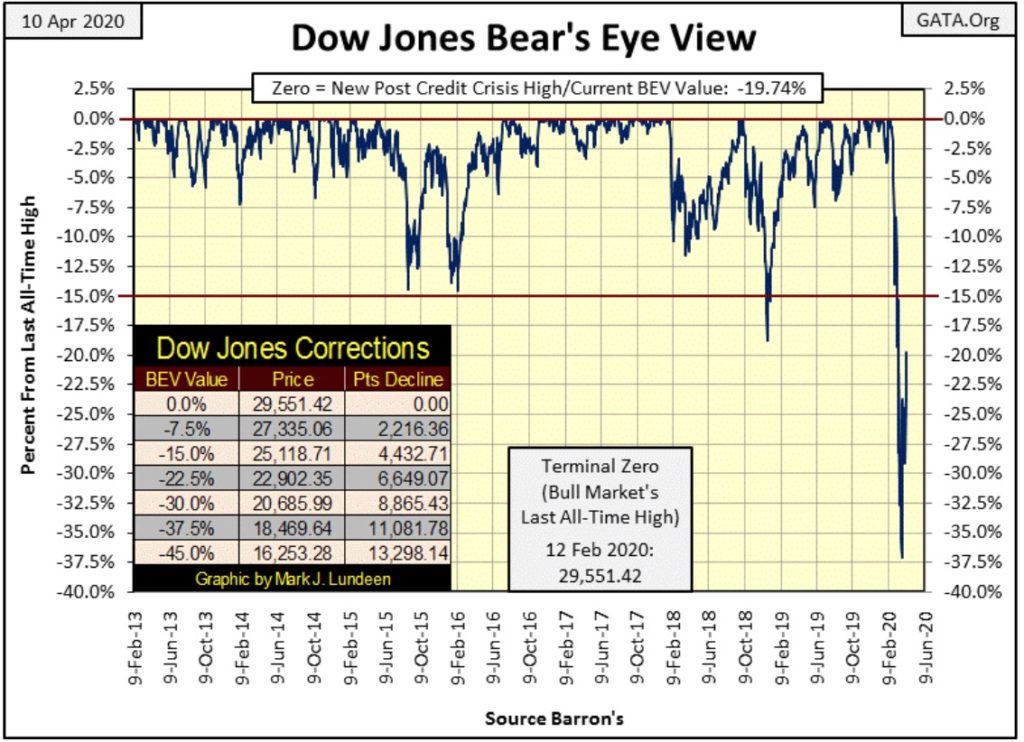
Week #7 for the 2020 – 202_ bear market was the abbreviated Passover / Easter trading week, and found the stock market closing -19.74% from its last BEV Zero in the Dow Jones’ BEV chart below.
So far, the bottom of this bear market was on March 23rd, with the Dow Jones closing at a BEV of -37.09%. That’s almost a 40% claw back from its last all-time high (BEV Zero) of February 12th. Historically speaking, a 37.09% decline in the Dow Jones is a big decline, one that could very well be the bottom to a bear market.
For the Dow Jones’ Jan 2000 – Oct 2002 high-tech bear market, it bottomed at a BEV -38.85%. However, that bear market bottom took a twenty-two-month decline to get there. In our bear market, seeing it completed; from start to finish in only * Twenty-Eight NYSE Trading Sessions * would be a first in the history of the Dow Jones going back to 1885. For that reason, I have a hard time believing the March 23rd 37% market decline as the ultimate bottom of this bear market.
There are other reasons too; such as there is still too much optimism for a resumption of the market advance. Bear-market bottoms aren’t places where optimism flourishes. So, I don’t believe we’ve seen this bear market’s ultimate bottom yet; far from it.
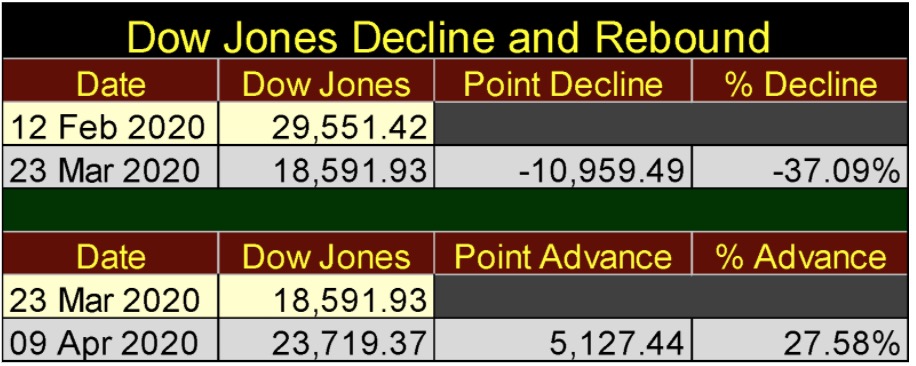
As bull markets see corrections; sharp declines that periodically occur as the stock market continues advancing upwards, bear markets also see their corrections; sharp upward reversals in the market that periodically occur as Mr Bear deflates market valuations in a continuing bear market decline.
In my opinion that is what we are seeing above since the Dow Jones’ March 23rd -37.09% market decline; a +27.58% bear market correction (see table below).
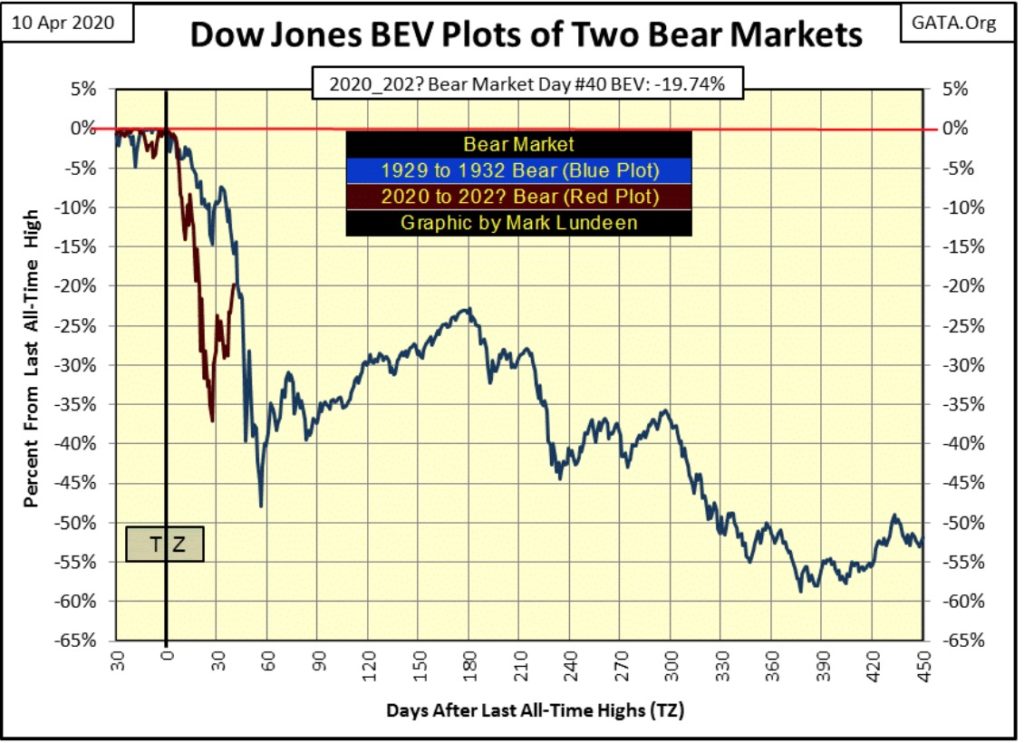
Next is my Bear’s Eye View (BEV) comparison of the Great Depression Bear Market along with ours. Day Zero is these bull markets’ last all-time high or Terminal Zero (TZ) in BEV lingo, and we are now at day 40 of our market decline. With our bear market, the Dow Jones is now correcting UP ABOVE its BEV -20% line. Day 40 of the 1929-32 market crash found the Dow Jones on the verge of breaking BELOW its BEV -20% line.
The 1929-32 bear market was unusual as bear markets go, as it deflated so quickly after its TZ. Is it a source of encouragement that since 1885 the only other bear market that broke below its BEV -30% line faster than the Great Depression’s bear market is ours? If you are a bull it just might be, but I’m a bear so it isn’t!
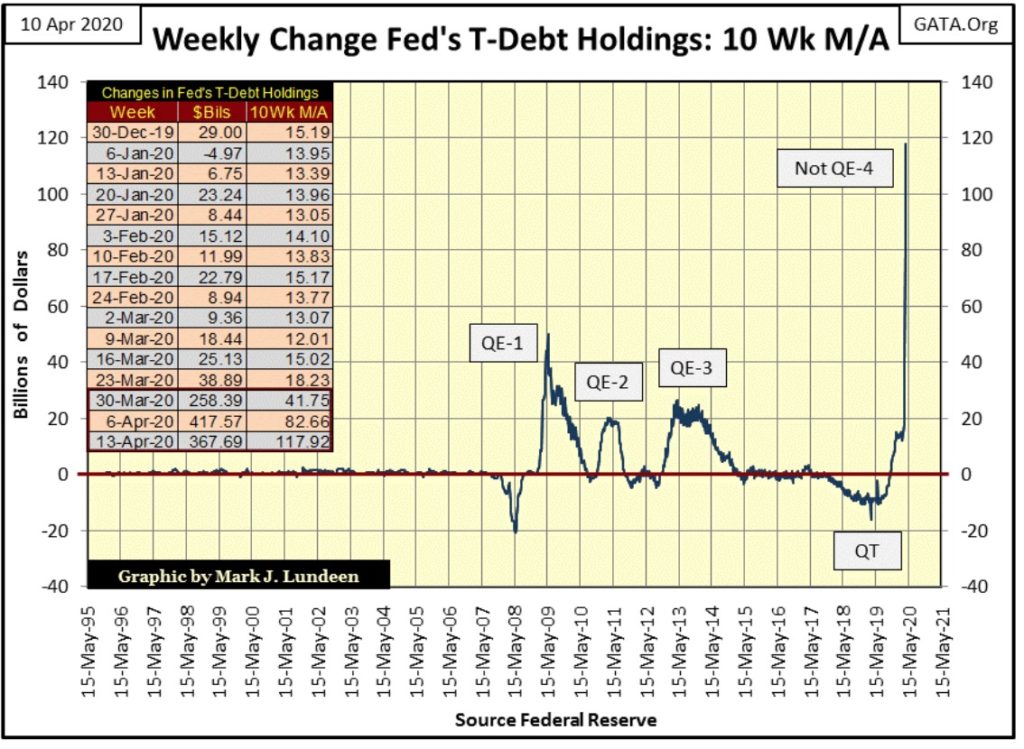
How much farther could the Dow Jones correct upward in this bear market? Looking at the ocean of “liquidity” the FOMC is “injecting” into the financial system in its “Not QE-4” below, which as Fed Chairman Powell stated last October is nothing like the QE-1 to 3, I can’t count out seeing the Dow Jones once again making new all-time highs before July.
It’s as Warren Buffet said in the aftermath of the High Tech bear market in 2003:
“Give me a few trillion dollars and I will show you a good time too!”
-Warren Buffet (comments upon the economic recovery efforts of the Federal Reserve of 2003)
The “policymakers” aren’t going to allow Mr Bear to go about his duties of cleaning up the mess currently residing in most balance sheets around the globe, and deflate inflated market valuations back to historical market standards without a fight.
And what historical standards of market valuations are the “policymakers” and Mr Bear fighting over? For the Dow Jones, I’d say that bear markets’ don’t terminate until their dividend yield increases to something over 6%.
As seen below, from 1925 to 1990 Dow Jones’ bull and bear markets could be observed by following the Dow Jones dividend yield. Bull markets began with the Dow Jones yielding something over 6%, and progressed until the yield on the Dow Jones declined to at or about 3%. Bear Markets began with the Dow Jones yielding around 3%, and progressed until the Dow Jones was yielding something over 6%.
With Alan Greenspan’s “monetary policy”, all that changed in the early 1990s as he “injected” massive doses of “liquidity” into the stock market via the financial system.
If you want to know exactly when stock-market valuations began to be inflated to unnatural levels by the “policymakers”, one only has to look at the chart below; 1990 when Alan Greenspan aborted a bear market in progress. Nine years later the stock market became a public spectacle, and the Dow Jones was yielding an absurd 1.30% at the January 2000 top of the High-Tech, Dot.Com mania.
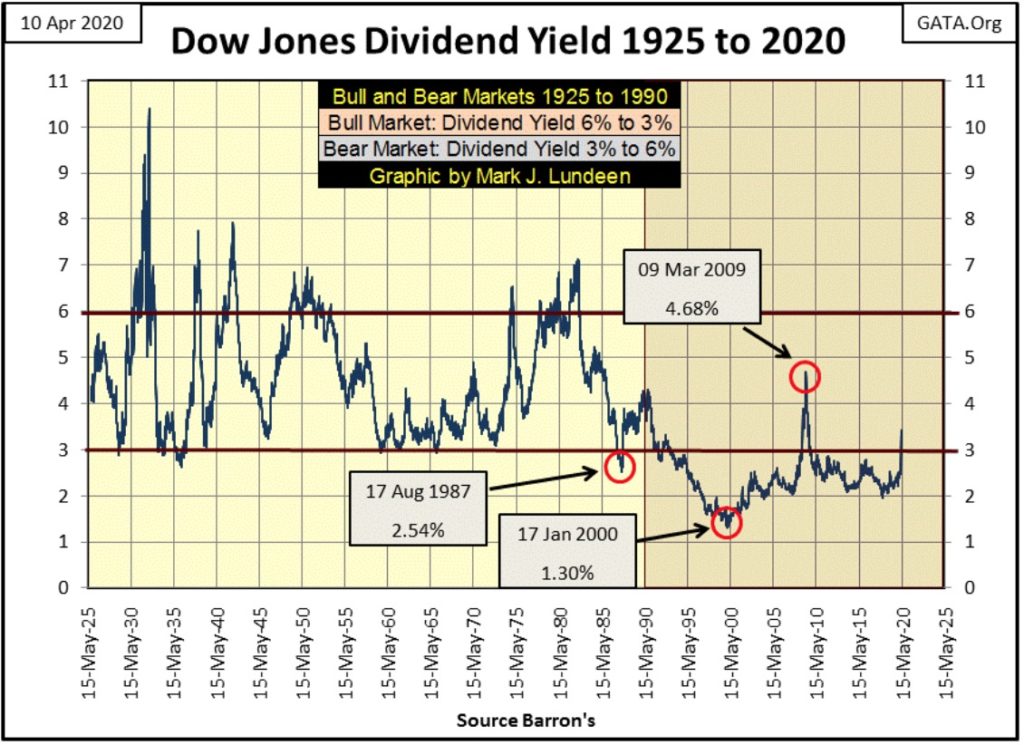
As I see it (looking at the chart above), the stock market has yet to work out the excesses of the Greenspan Fed’s inflationary monetary policies. In March 2009, at the bottom of the sub-prime mortgage crisis bear market, the 54% market decline in the Dow Jones that was the second-deepest bear market bottom since 1885, the Dow Jones yielded only 4.68%. Do you remember how painful that was? It would have been worse, much worse if Mr Bear had his way.
The March 2009 bottom was far from the traditional 6% plus dividend yield that prior to Greenspan, marked the bottom of bear markets since 1925. Had Mr Bear won this battle in 2009, and forced the Dow Jones’ dividend yield to just 6%, the Dow Jones would have deflated down to 5,174, or a 63.74% bear market decline.
And who’s to say the Dow Jones dividend yield wouldn’t have gone up to a yield of 7%, or above in 2009 had Mr Bear been allowed to do his job of correcting Alan Greenspan’s (and Ben Bernanke) ill-considered inflationary ways? A 7.00% yield would have seen the Dow Jones bottom at 4,435, a 68.69% bear market decline.
If you want to know why I’m so bearish, I’m looking at the Dow Jones dividend yield chart above, and what the “policymakers” have done to a time tested standard of market valuation; dividend yields for the Dow Jones since 1990. As I see it, natural-market forces will once again impose themselves on market valuations, and the Dow Jones’ dividend standards of the pre-Greenspan Fed will once again apply to the stock market.
With the current Dow Jones’ dividend payout of $656, a 6% yield would deflate the Dow Jones down to 10,947, or a 63% market decline from its last all-time high of February 12th. This assumes the Dow Jones can maintain its current payout of $656. When considering the current massive debt loading on corporate America finances, and state governors and cities’ mayors now shutting down businesses for the coronavirus pandemic, a collapse in earnings (and dividend payouts) for the Dow Jones is inevitable.
During the Great Depression bear market, the dividend payout for the Dow Jones was reduced by 77%.
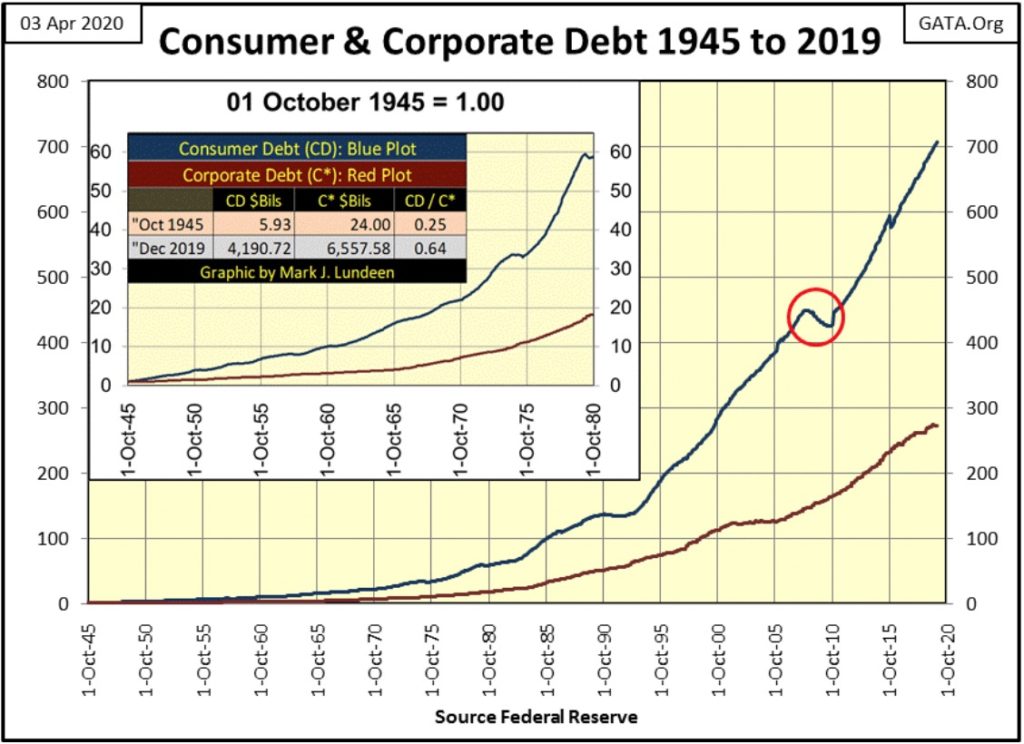
Below are the indexed values for consumer (Blue Plot) and corporate debt (Red Plot) going back to 1945 (latest data as of December 2019). Debt burden on corporate America and their consumer customers are at historic highs as we began this bear market in February 2020.
President Trump is exactly right when he stated that the cure for the coronavirus pandemic should not be worse than the disease; meaning the enforced unemployment now being applied by mostly Democratic politicians, which I believe are primarily for political purposes, risks igniting a bonfire of debt defaults in the economic system. The last time the financial system experienced massive-debt defaults was during the depressing 1930s.
In April 2020 the table is set for a historic bear market. Making a hypothetical worst-case scenario for the Dow Jones:
- dividend yield of 7%;
- 50% cut in payout ($328);
would deflate the Dow Jones down to 4,686, an 84% market decline from its current all-time high of 29,551.
But this may not happen should the “policymakers” continue “injecting” massive levels of “liquidity” into the financial system. In that case, the Dow Jones will be at whatever valuations they dictate in US dollars that are worth absolutely nothing.
But we’re not there just yet.
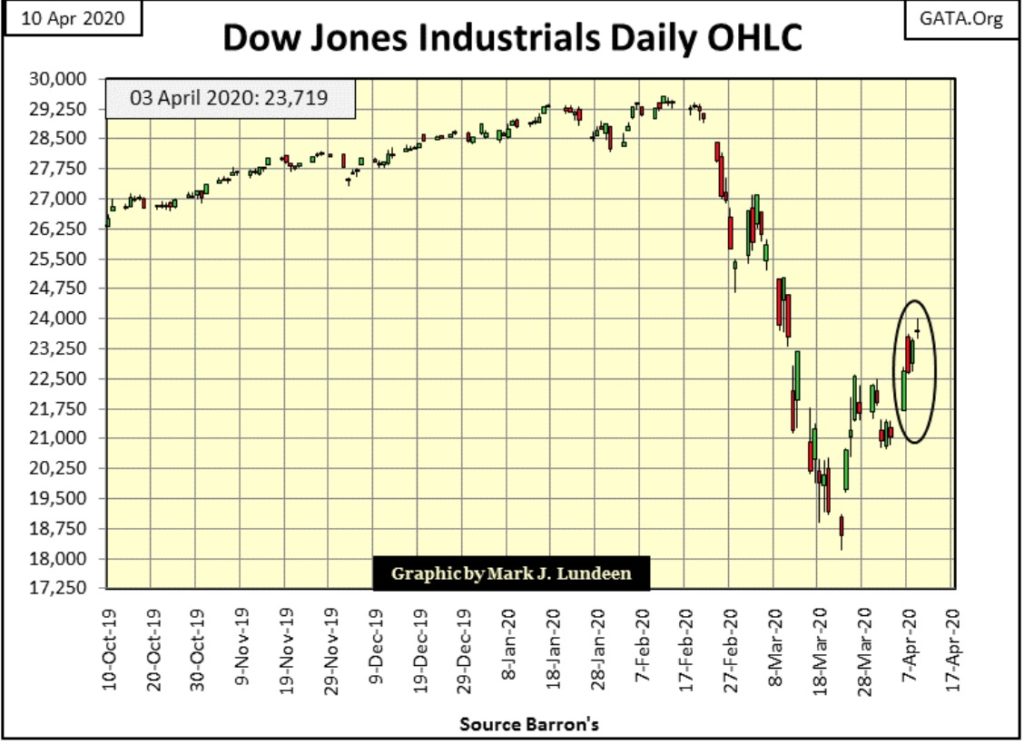
Let’s look at the Dow Jones in daily bars below. So far this bear market correction has seen a nice advance. But where would the Dow Jones be today had the FOMC not implemented its Not QE-4, and allowed the stock market to deflate naturally, as they did during the 1929-32 bear market?
Take a quick look again at the Weekly Changes in Fed Holdings chart above. Without their Not QE-4 “supporting market valuations” since October, I believe we’d all be shocked at how low the Dow Jones would have close at this week.
In week #7 of this bear market, extreme-market events continue dominating the stock market as seen in Mr Bear’s Report Card below. In week #1 of the bear market, a Dow Jones daily move of 3% from a previous day’s closing price increased the pulse and blood pressure of market commentators.
Monday saw the Dow Jones advance by 7.73% from last Friday’s close, and few thought it odd. But then the Dow Jones has always seen its biggest daily advances during Big-Bear Markets; not that you would know that by following the mainstream financial media.
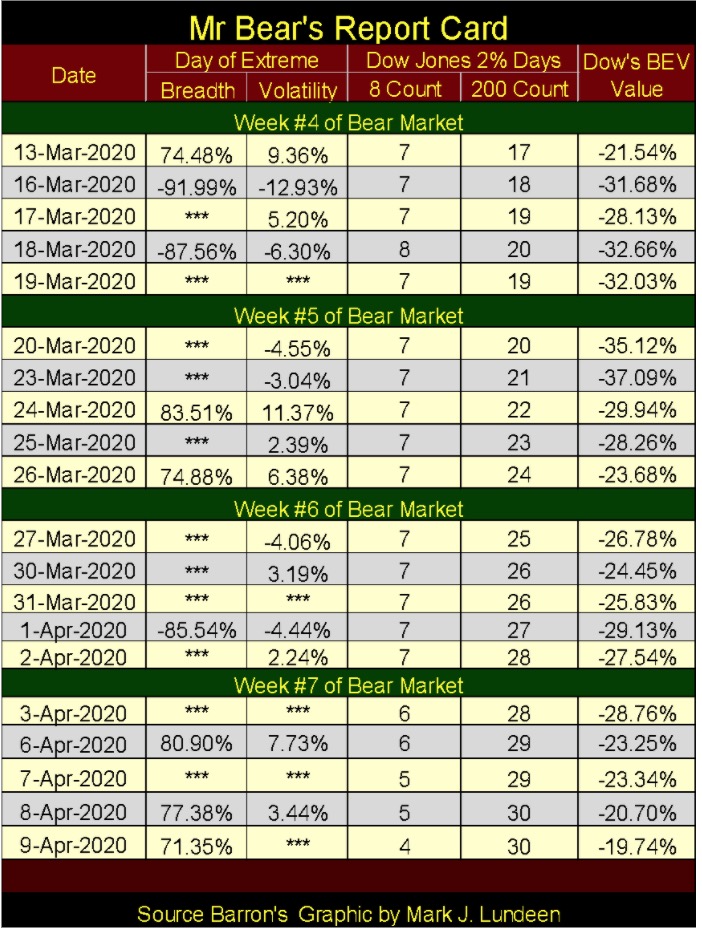
The Dow Jones’ 200 count reached 30 on Thursday this week, or 30 Dow Jones 2% days (days of extreme market volatility) in a running 200-day sample. These days of extreme market volatility can be seen in the table above. Normally a 2% daily move is a BIG-Market Event, but not in this market. In this market, the Dow Jones has to move something over 5% to stand out, and that isn’t good.
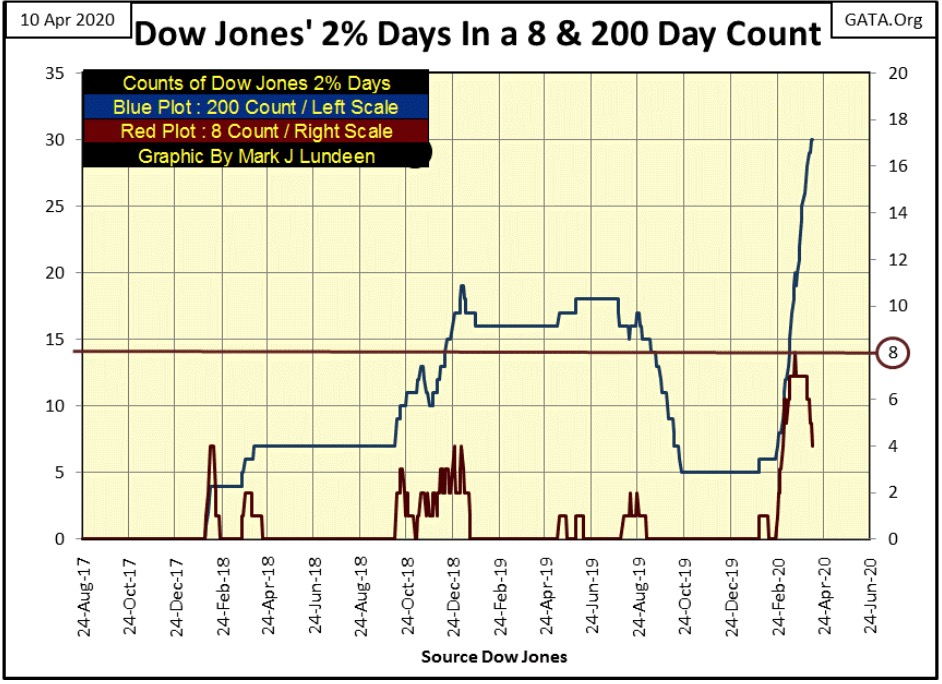
The Dow Jones’ 8 count close the week at four Dow Jones 2% days in a running eight-day sample. What to watch with the 8 count now is how long before it goes down to a Zero, and when it does how long will it stay there? If this is a Big-Bear Market, it may take some time for it to see a zero value again, and when it gets there it won’t stay there for long.
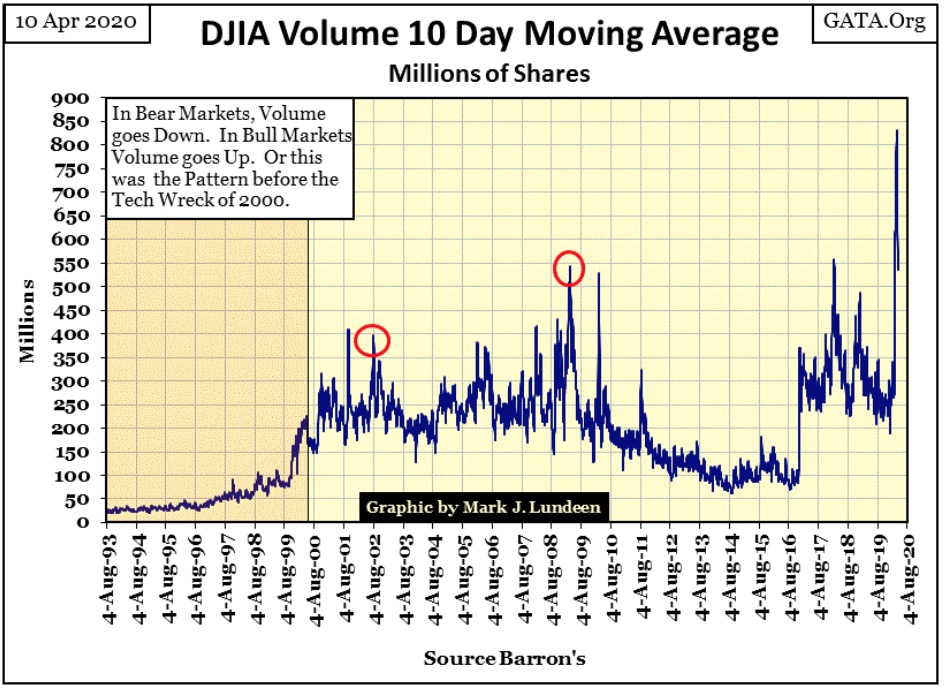
Since this bear market began in late February, trading volume has once again exploded as it did during the high-tech and sub-prime mortgage bear markets. Red circles mark these bear market bottoms. Bear-market bottoms before 2000 were low trading-volume market events. But after Alan Greenspan became Fed Chairman in August 1987, how things changed!
This chart answers the eternal question: What happens when the “liquidity” hits the fan? Trading volume explodes at the NYSE. For the third time in the 21st century, it’s Deja vu all over again.
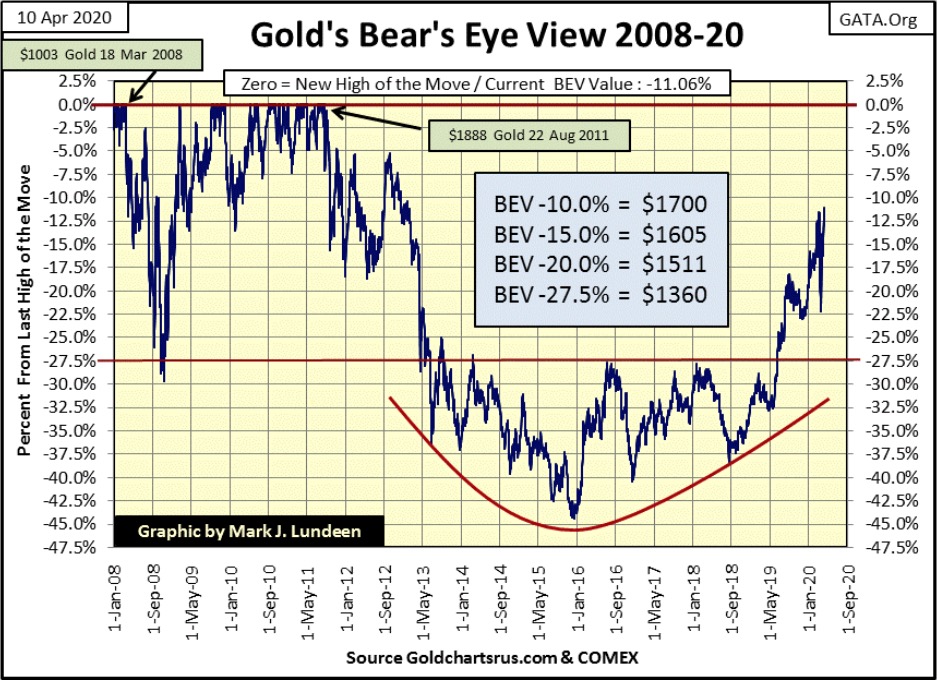
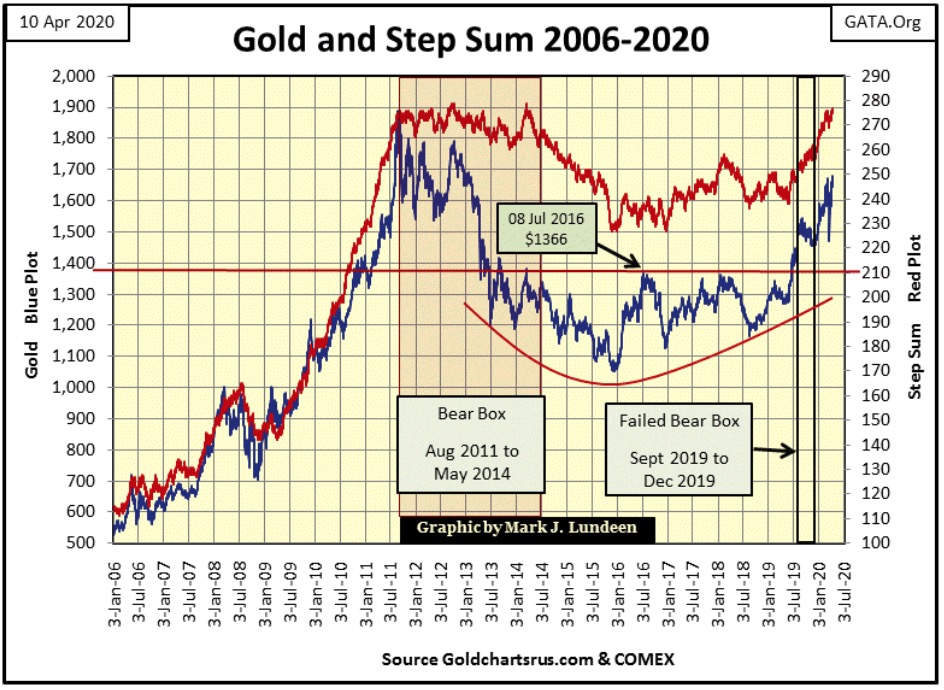
Let’s move on to gold’s BEV chart. This week saw gold close with a BEV value of -11.06%, a level not seen since 2013 when gold was declining towards it’s December 2015, 44% market bottom from its last all-time high of $1,888 in August 2011.
I don’t know about you, but seeing gold breaking up to levels not seen for seven years makes me very optimistic about what is to come for the precious metals markets for the rest of 2020. With a little over 10% to go before gold sees a new all-time high, the prospects for gold rising into history in the months to come are excellent.
Next is gold with its step sum, which displays the underlying power driving the gold market back to, and hopefully soon above its highs of August 2011.
Gold’s step sum (market sentiment) has been driving upwards since last July. The bulls have maintained their optimistic outlook for the gold market in spite of the market decline in the price of gold from September to December of last year (the failed bear box), and the sharp decline in the price of gold these past few weeks.
Usually, I’d trust the price of gold (market reality) for the future trend of the market, NOT its step sum’s trend when these two plots diverge. But golly gee, since last July bullish market sentiment has been correct on the future trend for the gold market: UP. Well, when the bulls are right – they’re right!
I don’t have a crystal ball to peer into the future with, but considering the massive levels of debt the economy must now service (see chart above), and the political class now imposing unemployment on consumers and business (we hear about that daily in the news), the prospect for a massive deflationary event in the financial system are growing ever greater.
Considering everything I’ve been pointing out for months now, the possibility for gold and silver doing something astounding before 2021 becomes more likely by the day.
Here’s the Dow Jones (Blue Plot) with its step sum (Red Plot). Unlike the bulls in the gold market, the bulls in the stock market aren’t as optimistic, even with the Dow Jones rebounding sharply off its lows of March 23rd.
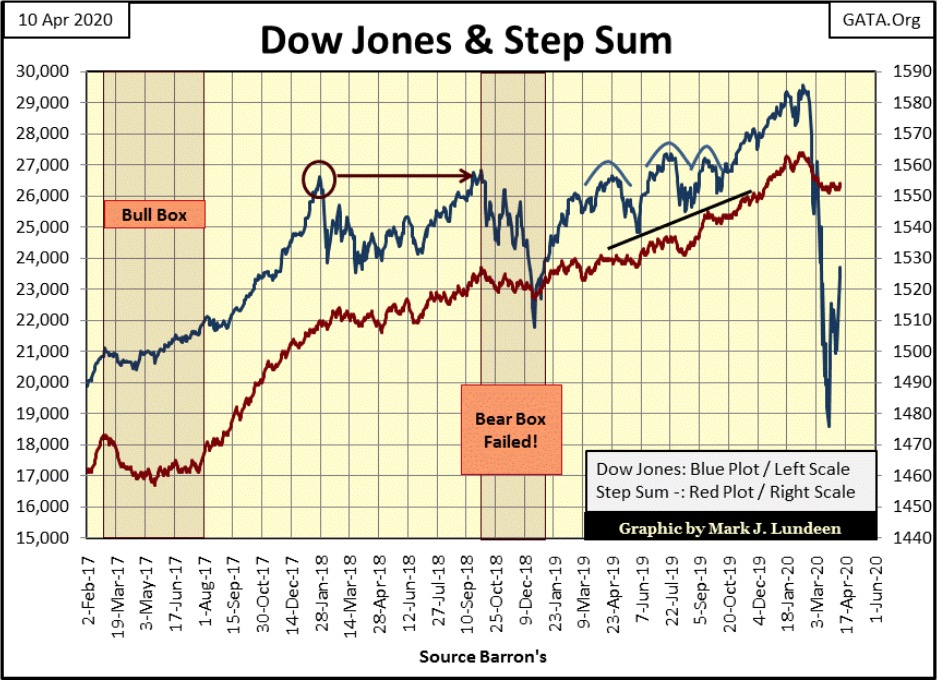
So how far can this correction in the Dow Jones current bear market continue? For longer and farther up than I can say now. But should the Dow Jones even see several new all-time highs from here, it’s only because the “policymakers” cheat anytime things don’t go their way, and that doesn’t change the basic problem of overvaluation in this market.
So, I’m not only a big bear in this market, but a very stubborn one too. I don’t believe allowing these idiot savants at the FOMC to continue flooding the financial system with monetary inflation to maintain absurd stock-market valuations, and asinine low-bond yields and interest rates is a viable long-term program for prosperity.
Gold in its step sum table below closed the week in an overbought condition, a 15 count of +7. Normally I’d expect a bit of a pullback from here, but I see that gold’s step sum has broken above its 275 level, closing the week at 277, and gold’s daily volatility’s 200 Day M/A has increased from 0.67% to 0.78% in the past twenty-five trading sessions. Unlike the stock market, rising market volatility is a positive factor in a bull market in precious metals.
There will be big down days for gold in the weeks to come; there usually are. But I suspect a month from now gold will be closer to, if not at a new all-time high. Gold’s BEV closed the week at -11.06%. Almost a single-digit BEV from a new all-time high. Since March 18th (17 trading days ago) gold has moved that many BEV points.
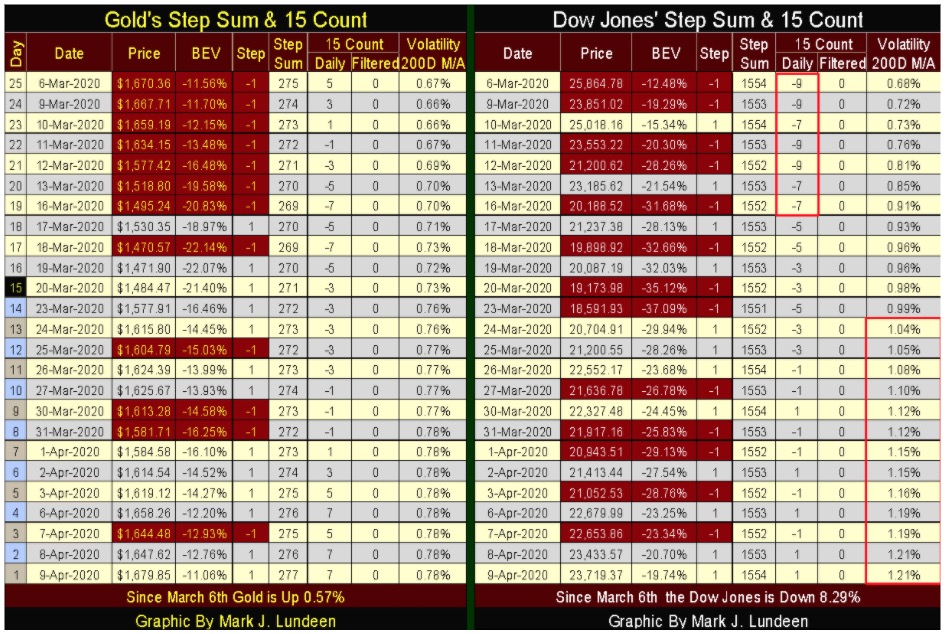
The Dow Jones closed the week with a neutral 15 count of +1, meaning not much of anything as to whether the stock market’s next move is up or down. One thing that is telling is that daily volatility (200 day M/A) has doubled since March 6th, and that isn’t good. But then it’s no guarantee that the current correction in the bear market won’t continue for the next month or so.
So far the Dow Jones has advanced 27.58% from its lows of March 23rd. With continued assistance from the idiot savants sitting at the FOMC’s big conference table, it’s likely the Dow Jones will continue advancing for a while.
So, if you’re wondering what my advice would be for people still in this market; this is an excellent opportunity to sell into market strength, and then wait six months or even a year to see what you should do next. If you are out of this market, then stay out and watch the show from the peanut gallery.
* * *
This is the week of Passover for the Jewish People and Easter for Christians. Passover was God’s fulfillment of delivering the Jewish people, who God calls his own, from Egyptian slavery long ago, way back during the early Bronze Age.
Do I believe God inflicted ten plagues on Egypt, with the last being the death of Egypt’s first born? I didn’t use to believe that as I once believed in a rational world as described by science. But when I actually studied how this rational world worked as described by science, for example, evolution and now global warming, I saw the frauds these people used to bilk billions-of-dollars from the system.
Here’s a thirty-minute video interview with Doctor David Berlinsky, an academic with impeccable credentials on what he thinks of the state of science is today.
With my new “higher criticism” insight into “science”, I had a renewed interest in the Bible and was amazed at the prophecies made in the Bible from long ago about the future. For example this passage at the end of the book of Daniel:
“But thou, O Daniel, shut up the words, and seal the book, even to the time of the end: many shall run to and fro, and knowledge shall be increased.”
Daniel 12:4 King James Version (KJV)
In the 5th century BC, a time when most people seldom moved more than twenty miles from where they were born, and iron smelting was considered high-tech, Daniel prophesized an increase in mobility for many and an expansion of knowledge at the end of human history.
You may disagree, but you can’t deny that travel for the masses from one point to another on the other side of the Earth in less than a day, or commuting to and from work in automobiles are today common occurrences, and that knowledge has expanded exponentially since Daniel wrote these words.
I really like Christianity as it is so different from the other religions of the world. Whereas most, if not all of the world’s other great religions demand good works for salvation, Christianity asks only for faith in Jesus.
But faith in what? Just hours after the last supper, and minutes before he was taken to condemnation before the priests, Jesus said this to his followers:
Greater love hath no man than this, that a man lay down his life for his friends. Ye are my friends, if ye do whatsoever I command you.
Gospel of John 15:13-14 (KJV)
So Jesus, the creator of the universe died on the cross to atone for all of humanity’s sins:
- past
- present
- and future.
so that his friends (you and me) can be with him for eternity in heaven.
What a mench!
A Christian axiom I learned has the ring of truth to it; that no one is condemned for eternity for their sins, but for their refusal to accepts Jesus’s free gift of redemption. One only has to ask for it.
That’s something to think about this Easter Sunday.
—
(Featured image by Markus Spiske from Pexels)
DISCLAIMER: This article was written by a third party contributor and does not reflect the opinion of Born2Invest, its management, staff or its associates. Please review our disclaimer for more information.
This article may include forward-looking statements. These forward-looking statements generally are identified by the words “believe,” “project,” “estimate,” “become,” “plan,” “will,” and similar expressions. These forward-looking statements involve known and unknown risks as well as uncertainties, including those discussed in the following cautionary statements and elsewhere in this article and on this site. Although the Company may believe that its expectations are based on reasonable assumptions, the actual results that the Company may achieve may differ materially from any forward-looking statements, which reflect the opinions of the management of the Company only as of the date hereof. Additionally, please make sure to read these important disclosures.


The TopRanked.io Weekly Affiliate Marketing Digest [The Top VPN Affiliate Programs Roundup]
Want to be let in on a little secret about two massive affiliate opportunities you can take advantage of today?...


Sustainable Finance Faces Hurdles as Green Asset Ratio Reforms Fall Short of Full Transparency
The Green Asset Ratio (GAR) measures banks' alignment with the EU Taxonomy but remains low due to methodological flaws and...


XRP Hits New All-Time High Amid U.S. Crypto Policy Shift and Ripple’s Expansion
XRP surged past its 2018 all-time high, reaching $3.65 amid renewed political support for crypto in the U.S. under Trump....


Germany Moves to Curb Medical Cannabis Abuse, Sparking Access Concerns
Medical cannabis imports in Germany have surged, but health insurance-covered prescriptions remain low. Easy online access raises concerns about abuse...


JPMorgan’s Data Fees Shake Fintech: PayPal Takes a Hit
JPMorgan Chase will charge fintechs for customer data, threatening business models reliant on free access. PayPal’s stock plunged 5.7% after...
 |
|
 |  |
 |
|
-

 Crypto2 weeks ago
XRP vs. Litecoin: The Race for the Next Crypto ETF Heats Up
-

 Crypto1 day ago
Crypto Markets Surge on Inflation Optimism and Rate Cut Hopes
-

 Biotech1 week ago
Spain Invests €126.9M in Groundbreaking EU Health Innovation Project Med4Cure
-

 Biotech4 days ago
Advancing Sarcoma Treatment: CAR-T Cell Therapy Offers Hope for Rare Tumors