Featured
Budget deficit, impending Fed vacancies spell uncertainty for US markets
Budget deficits, Hurricane Irma and troubles in the Federal Reserve Board bring uncertainty to American markets.
This is the way the world ends
Not with a bang but with a whimper.
— T.S. Eliot
We are not sure if there are words that can describe what is going on right now. Houston is a mess because of Hurricane Harvey. Now that the storm has subsided and the waters begin to recede, the recovery and clean-up are barely underway. Except, we are reading that it can best be described as chaotic. But it is off the news as the focus shifts to Hurricane Irma.
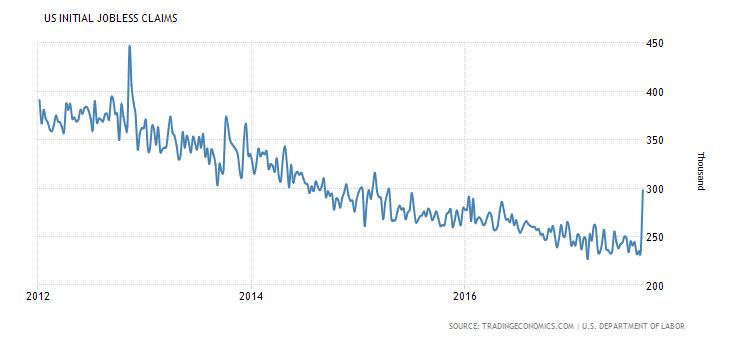
It was no surprise to see initial claims for unemployment benefits leaped this past week from 241,000 to 298,000. This should rise even more going forward. In the Houston area, an unknown number of people—most likely in the thousands—have lost their homes, possessions, and jobs. Thousands of homes will most likely need to be demolished, as they have become unlivable due to mold.
Many parts of Houston and environs will need to be rebuilt. The question is, do you build it as it was? Or do you rebuild to restore prairies and bayous that were paved over and contributed considerably to the massive flooding, thus resulting in the relocation of potentially thousands of people?
And we have not even begun to see what the impact of Hurricane Irma will be. Based on what we know to date, numerous Caribbean islands have been devastated. Others such as Puerto Rico have seen at least a million people cut off from power and water, a situation that could last weeks and even longer. This has potentially left thousands even tens of thousands of people homeless and without jobs. The tourist industry, a mainstay of these islands, will most likely be “out of business” for months if not years. Some smaller islands may become uninhabitable, requiring the relocation of thousands. Going forward, disease and other issues in the aftermath of the hurricane could claim more lives than the hurricane did.
Then there is Florida, a state of 20 million. While the epicenter of the storm appears to be shifting west putting cities like Tampa in its sights, the potential impact on Miami and Dade County with a population of upwards of three million could still be considerable. The high impact window carries up into Broward and Palm Beach counties, however, it appears the counties that could now be hit the hardest will be on the west side of Florida where the population is not as large.
Taking into consideration all of southern Florida and up into South Carolina and Georgia, the impact is expected to be high. In all 40 million could be in the path of Irma, 12% of the US population. Add in Houston and Texas impacted by Harvey and one could be talking about 50 million people or 15% of the US population exposed to severe flooding and hurricanes. And let’s not forget the tens of thousands impacted by wildfires on the West Coast.
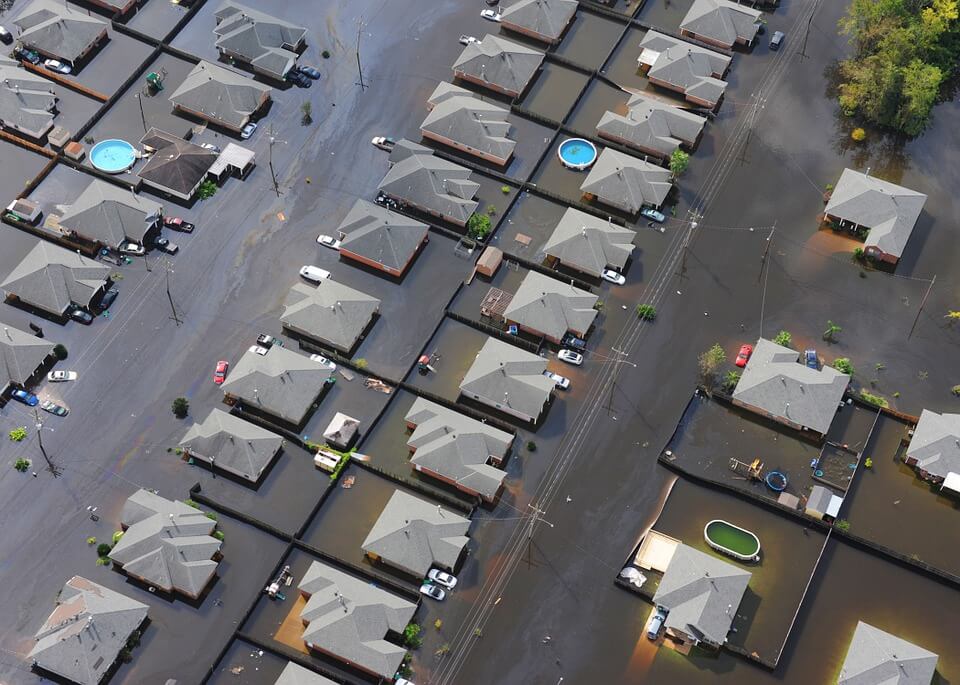
Hurricane Harvey and Irma devasted the US in a short period of time. (Source)
Hurricane Irma is bigger than the state of Texas, thus engulfing the entire state of Florida. Hundreds of thousands (estimated at 650,000 or more) have been ordered to evacuate creating massive traffic jams. The evacuation alone is the largest in US history. Gas stations have run out of gas and stores out of supplies.
We do not say any of this to be glib, but what has not even begun to be contemplated in this disaster is the cost—on people, jobs, careers, and, of course, on governments and on the US economy, not to mention the economies of the numerous hard-hit islands. The Caribbean islands hit have been reduced to third-world conditions resulting in some cases mass evacuations.
Harvey has been estimated to cost upwards of $180 billion. Very little of that would be covered by insurance. The costs of Irma are unknown, but given the devastation to date, it could be even higher. The growth in Miami-Dade, Broward, and Palm Beach since Andrew hit in 1992 has been huge. Swiss-Re the re-insurer estimates that damage in Florida could exceed $200 billion. Insurance companies could face major losses although it is believed that most can weather the “storm.”
Nonetheless, some insurers may not survive. Add in the devastation caused elsewhere, and one could be looking at a bill exceeding $500 billion or more for Harvey, Irma, and the wildfires. That is not even counting the potential long-term impact on jobs, careers, and businesses in the path of the hurricanes.
Unemployment is sure to rise given already a spike in jobless claims. Businesses could fail. It is estimated that potentially upwards of ten million people (half the population) in Florida could lose power, not just for days but weeks or longer. Already as we write over a million people have lost power. Cities will most likely see their tax revenue base collapse because of people losing their homes and business.
This, in turn, could imperil municipalities leading to bankruptcies. The tourist industry, a mainstay of Florida and the islands, could be set back for months if not longer. As a consequence, that feeds right up into Canada where thousands of Canadians either spend the winter or vacation in Florida or the islands–islands that may no longer be there. Major airlines that feed off the tourist industry will face a major challenge with canceled flights and the cost of sending empty planes to rescue people.
While rebuilding could be positive it is unsure as to where the money will come from given the fight over the debt ceiling and budget that was once again pushed “down the road” after an unprecedented agreement between President Trump and the Democrats. As well, does reconstruction just recreate what was lost? That is what has happened in the past. Indeed urbanization intensified paving over in Houston’s case prairies and bayous. And then the cycle repeats itself. Insurance companies may force the issue by making insurance for those living in hurricane and flood zones prohibitively expensive. Governments could refuse to finance further building as well in hurricane and flood zones.
FEMA is already bankrupt and needs to be refinanced. The US debt stands today at $20 trillion and the US budget deficit is estimated to be close to $700 billion. Add in the costs of Harvey and Irma and the budget deficit could soon soar past $1 trillion. Try getting that one through an extremely fractious and divided Congress and Senate where many congressmen and senators want to cut, not add.

The damages from the two hurricanes are still rising. (Source)
The down payment in aid provided by Congress thus far is “peanuts” compared to what will ultimately be needed. Most economists are already downgrading the 3rd quarter GDP because of Harvey and Irma. That could carry over into the 4th quarter. Oil production was also hit because of Harvey with a quarter of refineries shut and 8% of US oil production knocked out. US stocks markets faltered this past week but have not broken. The US$ has been knocked back as many now expect the Fed to put any further interest rate hikes on hold. It is unknown at this time how the hurricanes could impact the rest of the country. But the negative impact is not expected to just be local. Gold has reached its highest levels since June 2016.
We are reminded of the San Francisco quake of April 1906. Initially, at least, it was thought the economic impact would be small. But a recession soon followed and in October 1907 there was a stock market panic where the New York Stock Exchange (NYSE) fell almost 50%. No, the crash was not caused by the San Francisco quake. But the quake was a factor in the subsequent recession. The crash was triggered by a failed attempt to corner the market of the United Copper Company financed by Knickerbocker Trust and others, which sparked the collapse when the scheme fell apart.
Nature has a strange way of biting back even as man has tried to tame it. If Irma were the only natural disaster going on it would be a one off. But, in a space of week or two, the US has been hit by two “storms of the century” Meanwhile, two more dangerous hurricanes are underway in the Atlantic (Jose) and the Gulf of Mexico (Katia). Jose, like Irma, could cover much the same path, sending a potential “double whammy” to the Caribbean islands and even to the US.
Katia is headed towards Mexico and could hit major population centers near Veracruz. Wildfires due to hot dry conditions are engulfing parts of California right up into British Columbia. And while all this was happening a major earthquake hit Mexico just off the Pacific coast causing dozens of deaths and damage right up to Mexico City a city of twenty million including suburbs.
None of this takes into consideration the tightening noose on the investigation into the Russian ties of Trump and his people being carried out by special counsel Robert Mueller, the ongoing North Korea crisis, and the political and cultural divide in the US. These are “hurricanes” of a different kind. Take it all together and one could say that the perfect storm could be forming and spark a financial crisis of unprecedented fury.
Fed in turmoil?
We can’t leave without noting that the Federal Reserve Board of the US could be in the midst of its own hurricane. Long-time Vice Chair Stanley Fischer has decided to step down in mid-October some eight months before his term was to expire in June 2018. With Fischer’s departure, that leaves four vacancies on the seven-man board. Fed Chair Janet Yellen’s term is up in February 2018. One replacement has been nominated thus far but needs to be confirmed by the Senate.
Given how slow the Trump administration has moved to fill positions (currently hundreds of positions remain unfilled) one has to be a bit concerned about the growing lack of experience and leadership at the Fed and other US agencies and diplomatic posts. Particularly when the Trump administration has made it clear, they do not back Yellen and the Fed’s policies.
The Fed has signaled its intention to start shrinking their $4.5 trillion balance that exploded during the financial crisis of 2007-2009 and the subsequent period of quantitative easing (QE). The Fed next meets September 19-20 in Washington to discuss the shrinking and the potential for another interest rate hike. Many believe the Fed won’t hike interest rates now given the economic turmoil that could arise out of the hurricanes.
Who might become the next Fed chair is a mystery. Gary Cohn currently the chair of the National Economic Council was thought to be the leading candidate. But Cohn and the Trump administration are now at considerable odds lessening his chances. Odds are equally low that Trump would re-appoint Janet Yellen. Few other candidates are being noted. The lack of a Fed Chair and experience at the Fed is just another piece of uncertainty for markets going forward. And markets do not like uncertainty.
Markets and trends
|
|
Percentage Gains Trends
|
|||||||
| Stock Market Indices | Close
Dec 31/16 |
Close
Sep 8/17 |
Week | YTD | Daily (Short Term) | Weekly (Intermediate) | Monthly (Long Term) | |
| S&P 500 | 2,238.83 | 2,461.44 | (0.6) | 9.9 | neutral | up | up (topping) | |
| Dow Jones Industrials | 19,762.60 | 21,797.79 | (0.9) | 10.3 | neutral | up | up (topping) | |
| Dow Jones Transports | 9,043.90 | 9,383.74 | 0.3 | 3.8 | up (weak) | up (weak) | up (topping) | |
| NASDAQ | 5,383.12 | 6,360.19 | (1.2) | 18.2 | up (weak) | up | up (topping) | |
| S&P/TSX Composite | 15,287.59 | 14,985.32 | (1.4) | (2.0) | down | down | up (weak) | |
| S&P/TSX Venture (CDNX) | 762.37 | 772.05 | (0.8) | 1.3 | up | down (weak) | up (weak) | |
| Russell 2000 | 1,357.14 | 1,399.43 | (1.0) | 3.1 | neutral | up (weak) | up (topping) | |
| MSCI World Index | 1,690.93 | 1,948.37 | 0.8 | 15.2 | up | up | up | |
| Gold Mining Stock Indices | ||||||||
| Gold Bugs Index (HUI) | 182.31 | 216.70 | 1.7 | 18.9 | up | up | up | |
| TSX Gold Index (TGD) | 194.35 | 208.64 | (0.1) | 7.4 | up | up (weak) | up | |
| Fixed Income Yields | ||||||||
| U.S. 10-Year Treasury yield | 2.45 | 2.16
|
(0.5) | (11.8) | ||||
| Cdn. 10-Year Bond yield | 1.72 | 1.85 | (2.1) | 7.6 | ||||
| Currencies | ||||||||
| US$ Index | 102.28 | 91.33 (new lows) | (1.6) | (10.7) | down | down | down | |
| Canadian $ | 0.7440 | 0.8230 (new highs) | 2.0 | 10.6 | up | up | up (weak) | |
| Euro | 105.22 | 120.32 (new highs) | 1.4 | 14.4 | up | up | up | |
| British Pound | 123.21 | 132.02 | 1.9 | 7.2 | up | up | down | |
| Japanese Yen | 85.57 | 92.73 | 2.3
|
8.4 | up | up | up (weak) | |
| Precious Metals | ||||||||
| Gold | 1,151.70 | 1,351.20 (new highs) | 1.6 | 17.3 | up | up | up | |
| Silver | 15.99 | 18.12 | 1.7 | 13.3 | up | up | up (weak) | |
| Platinum | 905.70 | 1012.30 | 0.3 | 11.8
|
up | up | down (weak) | |
| Base Metals | ||||||||
| Palladium | 683.25 | 931.25 (new highs) | (4.7)
|
36.3 | up | up | up | |
| Copper | 2.5055 | 3.04 (new highs) | (2.6) | 21.3 | up | up | up | |
| Energy | ||||||||
| WTI Oil | 53.72 | 47.48 | 0.4 | (11.6) | neutral | down (weak) | down (weak) | |
| Natural Gas | 3.72 | 2.89 | (5.9) | (22.3) | neutral | down | neutral | |
© David Chapman
Note: For an explanation of the trends, see the glossary at the end of this article. New highs/lows refer to new 52-week highs/lows.
© David Chapman
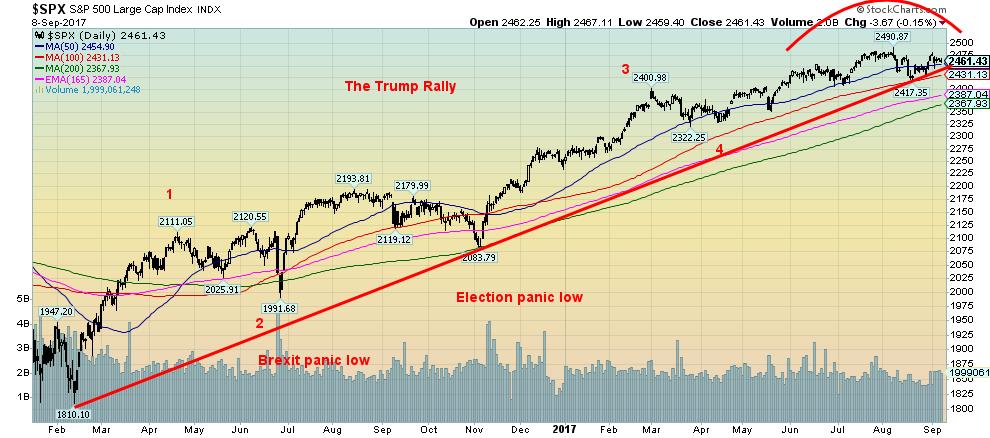
It is possible that the US stock markets have made their final top. The failure this past week to make new highs could set in motion a swift decline. A break now of 2,440 and especially under 2,400 could quickly send the index down to 2,300. There is an alternative in that where we labeled minor waves 3 and 4 could instead be waves of a lesser degree. That would make the current corrective minor waves 3 and 4.
There is good support down to the 200-day MA currently near 2,370 and as long as that holds the market could regroup and start another assault towards new highs. Of more importance would be the low of April 2017 near 2,325 (current label wave 4). If that breaks then it would signal that a potential major top is in. Naturally new highs above 2,490 would signal that the market has further to go. But the reality is the weak seasonals coupled with the long rally that has taken place since the February 2016 low signals that the likelihood is the market could be on the verge of a more significant drop.
We are expecting at best a corrective period. That correction could be shallow 8-10%. A drop to the 200-day MA would be a 5% correction. A 10% correction would take us down to around 2,240. Note the highs made in July to September 2016 just below 2,200. We would consider a breakdown under that level to be a signal that a more serious bear is underway.
© David Chapman
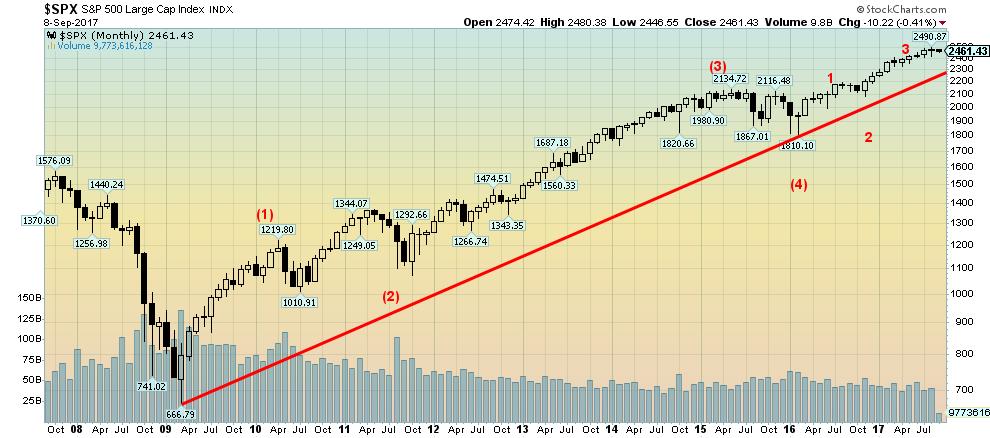
Here is the big picture, a monthly chart dating from the major March 2009 lows. Five waves up. Wave (2) was the 2011 EU financial crisis and wave (4) was the 2015/2016 tapering. None of these corrections exceeded 20% to satisfy the definition of a bear market. Eight years up is a long time. The longest bull market was the 1990-2000 bull a period of almost ten years (the mini-bear of 1998 fell just short of a 20% correction).
So we know we are late in the cycle. It may very well be that the market following a pullback makes another run to new all-time highs that take us into the first quarter of 2018. The major trend line appears to come in near 2,300. If that line were to break on any pullback then it could trigger the start of a bear market. Something to keep in mind going forward.
© David Chapman
Here is that spike in jobless that we noted. Initial claims leaped by 62 thousand to 298 thousand. The market had expected 241 thousand. This is before Hurricane Irma that could spark another spike. There could also be more claims coming as a result of Harvey as well. It may very well be that this is just a temporary spike. That was what was seen during Hurricane Sandy back in 2012. When things settled down the downward trend of jobless claims continued. Irrespective this is now the highest level of initial claims since 2014. Watch continuing claims for clues that labour market is deteriorating.
© David Chapman
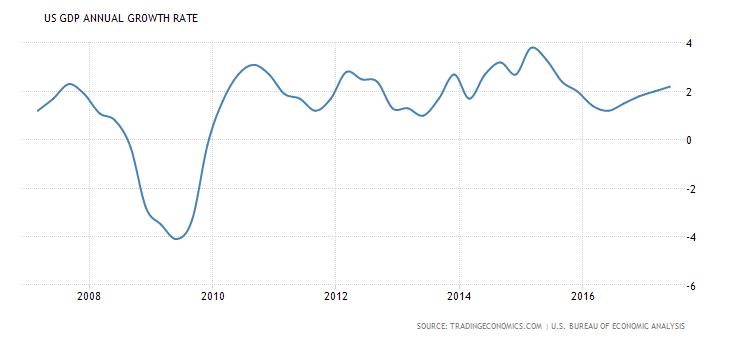
Second quarter GDP came in higher than expected and as a result, the feeble recovery that got underway following the 2007-2009 financial crisis continues. Given the potential impact of the hurricanes, the expectation is that it will shave upwards of 0.4% off Q3 GDP. That could continue into Q4. So expect GDP growth to falter going forward.
© David Chapman
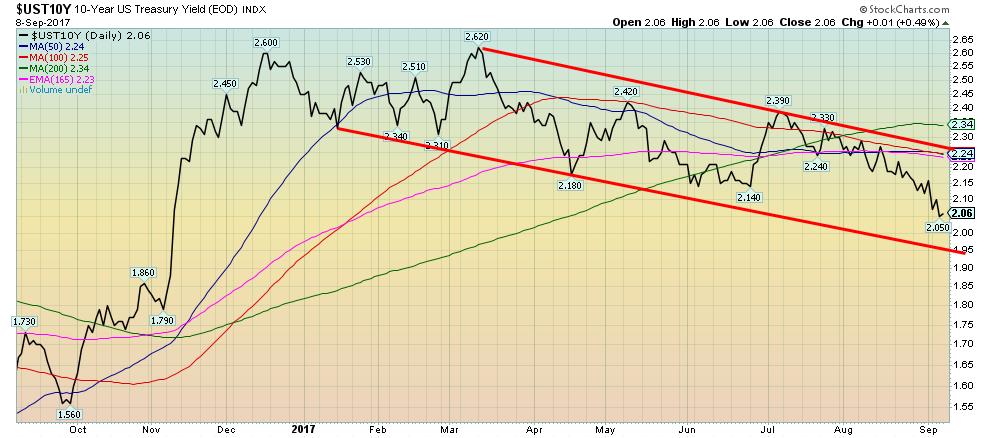
Bond yields continued to fall this past week (prices that move inversely to yields rose) reflecting concerns over the hurricanes and their potential to spark a recession and in response to a faltering stock market. The high seen back in March 2017 at 2.62% we suspect was the first wave up of a larger pattern. The current wave down is the correction to that rise in yields. The major trend line is seen down around 1.95% and that appears to be a possible target. Yields break out above 2.25% and 2.35%.
© David Chapman
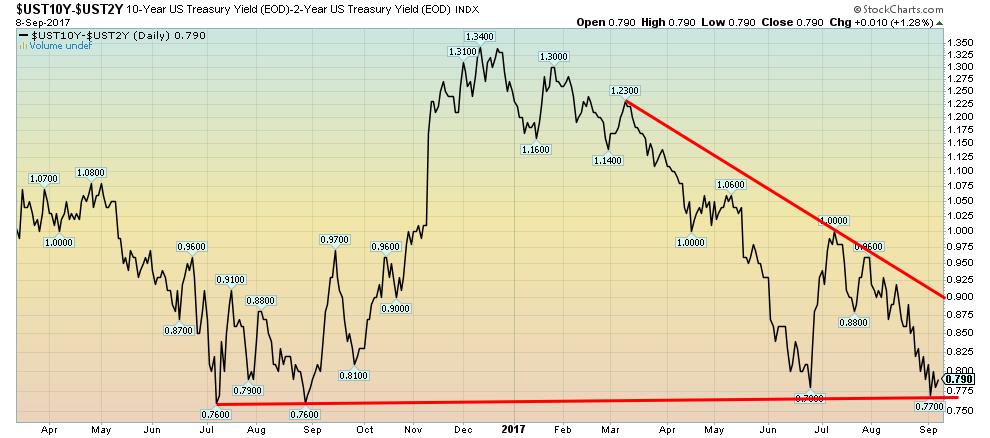
Spread watch. The two-year Treasury note and ten-year Treasury note spread narrowed this past week to 0.79%. This is a reflection of longer dated securities yields either falling or remaining flat as short rates rise. With the agreement to extend the debt limit out to December 2017, it meant that yields on one month Treasuries eased somewhat but yields for maturities in December rose. Major support continues to be around 0.76/0.77% so once that breaks we could embark on a rapid decline. In the past recessions were predicted when the 2-10 spread went negative. That occurred in 2000 and 2007 prior to the 2000-2002 recession and the 2007-2009 recession.
© David Chapman
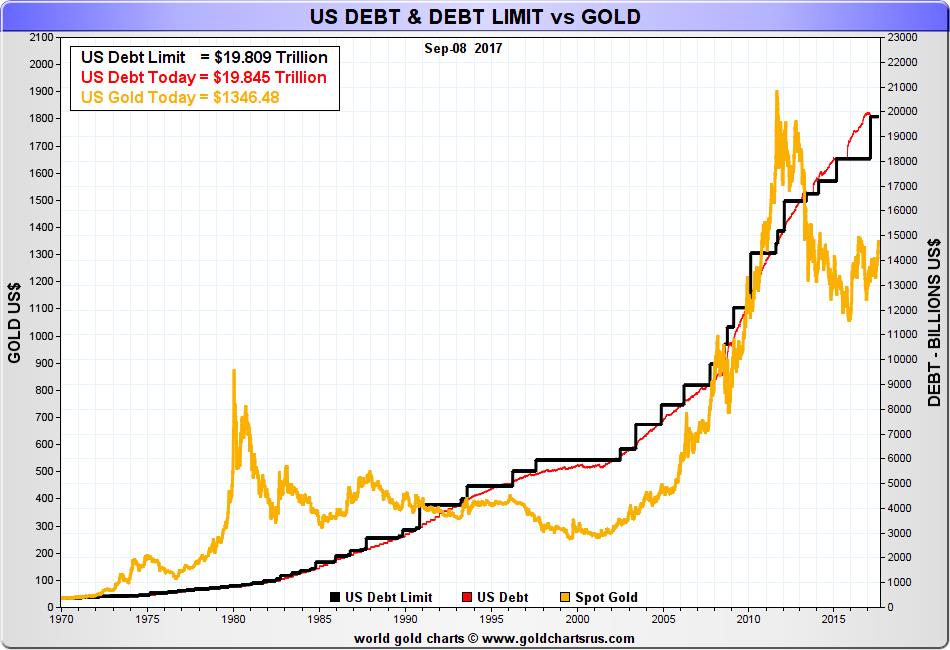
We didn’t know whether we should show this chart under our precious metals commentary or our bond commentary. In an unprecedented move, President Trump forged an agreement with the Democrats to extend the debt limit to $19.8 trillion and out to December 2017. Enough Republicans joined the Democrats to pass the motion.
The move, however, did not address underlying issues and it has set up December for an even bigger clash. The result of this deal means funding will continue and paying debts until December. Over the years, gold has correlated nicely with the rise in the debt and the debt limit. US government debt appears poised to cross $20 trillion sometime over the next few months.
There have been periods where the rise in gold prices exceeded the rise in the debt and the debt limit. After peaking in 2011 gold fell into a huge funk and has now fallen sharply behind the rise in debt and the debt limit. Our expectations are that a huge catch up is now under way that could take gold prices over $2,000. This could especially be the case if the December debate degenerates threatening a government shutdown and potential default by the US.
© David Chapman
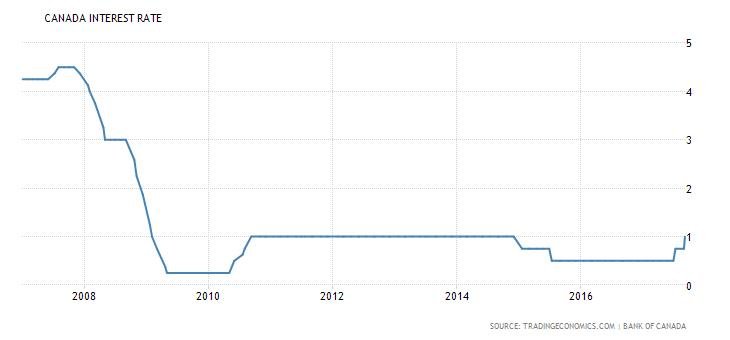
The Bank of Canada (BofC) hiked the key bank rate to 1% this past week bringing it back in line with the level seen from 2011 through 2015. It reflects the stronger Canadian economy seen of late especially the recently reported Q2 GDP numbers that exceeded expectations. The latest jobs report saw 22,000 jobs added in August. Again, it was above expectations but it was a good news bad news report.
While the net was 22,000, it was made up of an increase in part-time employment of 110,000 and a decline in full-time jobs of 88,000. The unemployment rate slipped to 6.2% and tightening labor conditions saw wage growth up 1.8% year over year. With interest rates rising, it has put upward pressure on the Canadian dollar that has hit its highest point since 2014. The Canadian dollar is currently at 82.30.
© David Chapman
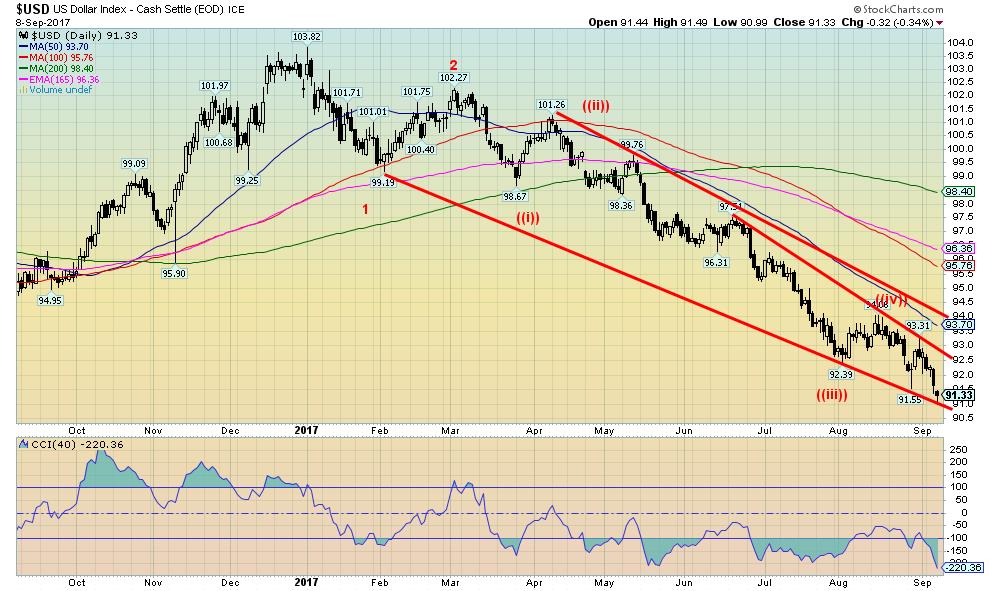
The US$ Index fell this past week right into our target of 91-91.10 with a low of 90.99. The US$ Index could now be poised for another rebound. The US$ Index hit the lower end of the downtrend line and bounced on Friday leaving what appears to be a small hammer on the charts. The US$ Index hit new 52-week lows. This could be signaling the end of wave 3 down. However, if the US$ Index were to firmly break under 91 then the next targets could be down to 90-90.15.
The US$ Index also appears to be forming a falling wedge triangle. The triangle breaks out above 92.50 and especially above 93.70. Targets then could be as high as 97. The US$ is being pressured by the potential for turmoil at the Fed, the expectation that there will be no further interest rate hikes and the potential for recessionary conditions to emerge from the impact of Hurricanes Harvey and Irma. Right now the US$ Index appears to be at extremes so expect a bounce back. Again if the US$ Index firmly breaks under 91 then odds favor a further decline to the 90 zone.
The other side of the US$ Index is the Euro since it makes up roughly 57% of the US$ Index. The Euro also made new 52-week highs this past week. Its reversal point is around 118. So we can keep an eye on the Euro as a clue to the direction of the US$ Index.
© David Chapman
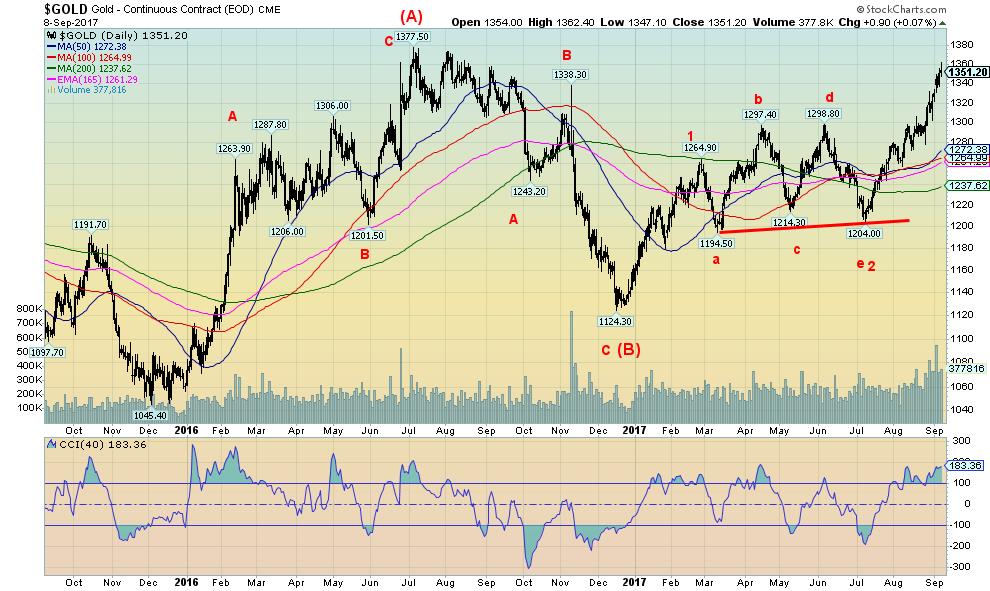
Gold prices surged to new 52-week highs this past week taking out the highs of early September 2016. Gold, however, stalled at the $1,360 level (high $1,362) a level we expected to provide resistance. A firm break above $1,360 would most likely suggest that the $1,377 high of July 2016 should fall and gold prices could rise to $1,400 or higher. But there are concerns.
The commercial COT continues to build on the short side. Neither silver nor the gold stocks confirmed gold’s high as both remain below comparable highs. We like to see the metals in sync and as long as silver and the gold stocks do not confirm gold’s high it is a divergence we need to keep an eye on. Normally we expect both silver and the gold stocks to lead. Instead, they are lagging.
Furthermore, the US$ Index has reached some target zones. A rebound in the US$ could put some downward pressure on gold prices. Nonetheless, we expect the downward pressure to be temporary. Given new highs above $1,377, there are potential targets as high as $1,630. Naturally, there is a lot of resistance to break through. Breaking the back of the commercial COT would also help. We are reminded that during the run-up to $1,900 in 2011 the commercial COT appeared to be indicating a top.
Instead, it took weeks before gold made its final high in September 2011. Gold sentiment is also high and is reaching up into the high 70’s for some indicators. Market Vane’s bullish consensus stands at 64%. High but not extreme. However, it is the highest level seen in a few years. Support for gold on any pullback would be from $1,300 to $1,325. A break under $1,300 would be more serious although we have no expectations of that at this time.
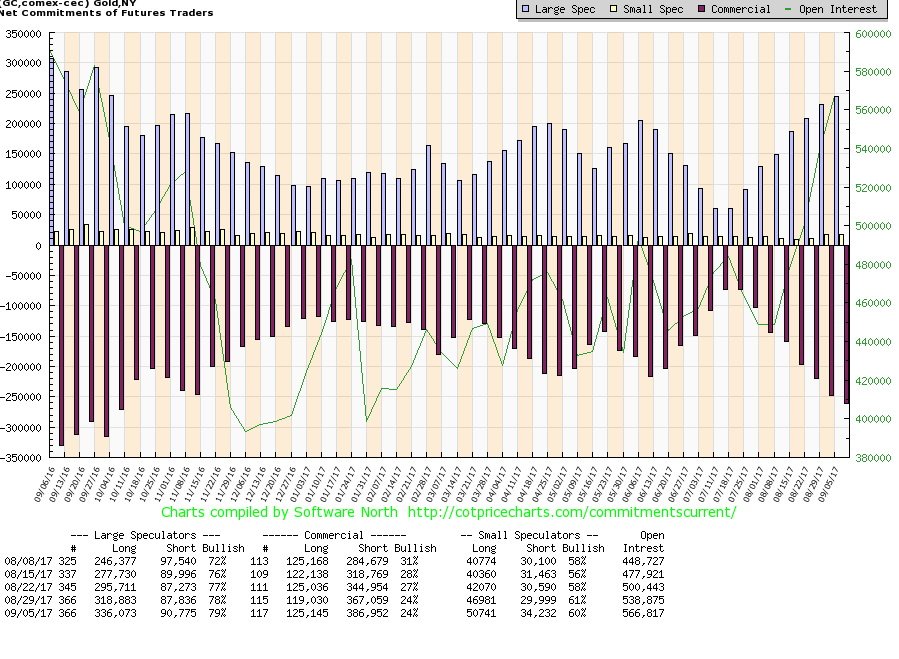
© David Chapman
The commercial COT for gold stayed steady at 24% this past week. However, the mix did change. Short open interest rose roughly 20,000 contracts, however, it was offset partially by a roughly 6,000 contract rise of long open interest. It was no surprise that the large speculators’ COT (hedge funds, managed futures etc.) rose to 79% from 78%. Long open interest rose about 17,000 contracts while short open interest rose only about 3,000 contracts. There remains room for the commercial COT to fall further before a top might be seen for gold. But it is a consideration going forward.
© David Chapman
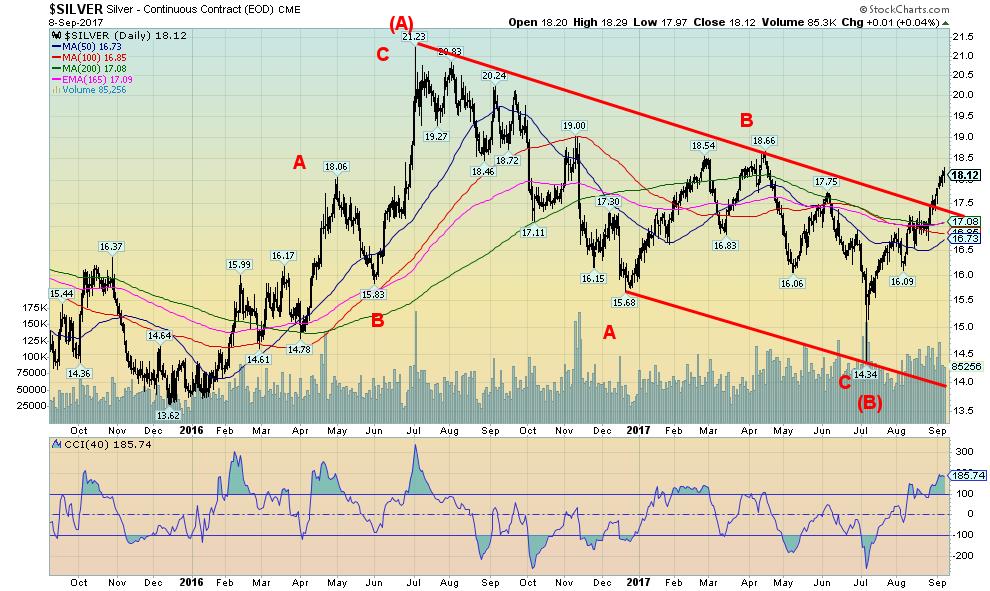
Silver has firmly broken above the downtrend line from the July 2016 top and cleared the key 200-day MA. However, as noted silver has not yet made new highs. Above lies the March 2017 high of $18.66. Further, the 52-week high is currently at $20.14. That level was seen later in September 2016. After that, the high is $19 seen in November 2016. Nonetheless, like gold, silver prices are seeing some extremes in the indicators. A correction would ease some of that strain. Nonetheless, it is also not unusual to see indicators remain at extremes for some time in a strong bull market (or bear market). Initial support for silver would be seen around $17.75. There is considerable support now down to $17.
© David Chapman
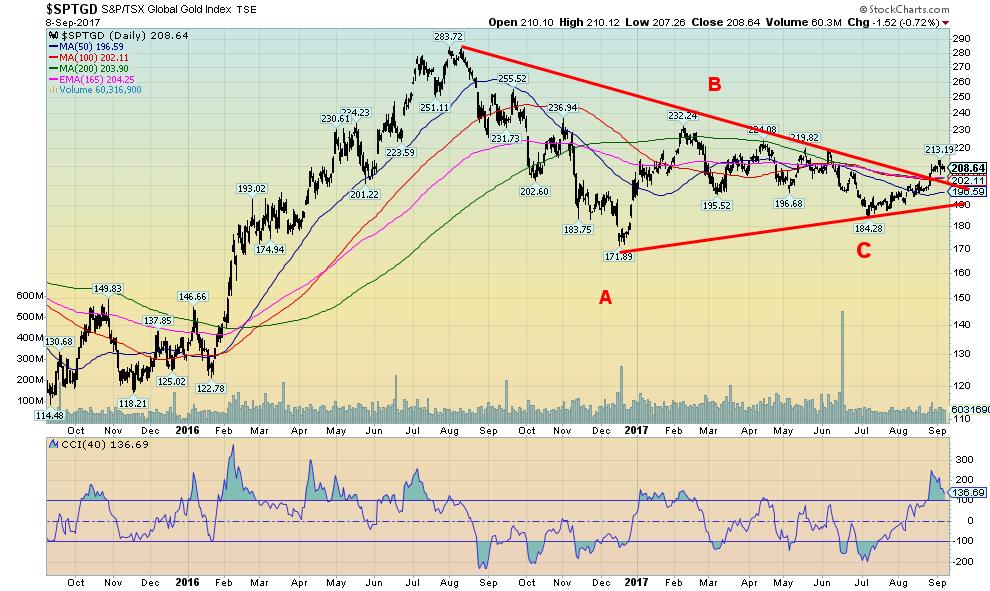
Gold stocks continue to lag. The Canadian gold stocks, in particular, are lagging. Part of the reason is the strong Canadian Dollar. The TSX Gold Index (TGD) has broken above its 200 day MA but it remains well below previous highs. The 52-week high is currently 255 seen in September 2016. That’s over 20% away. Within distance is a series of highs made in late 2016 and 2017. The TGD needs to clear above 235 to suggest that the 255 high is attainable. There appears to be solid support to 190/200 and even down to 180.
© David Chapman
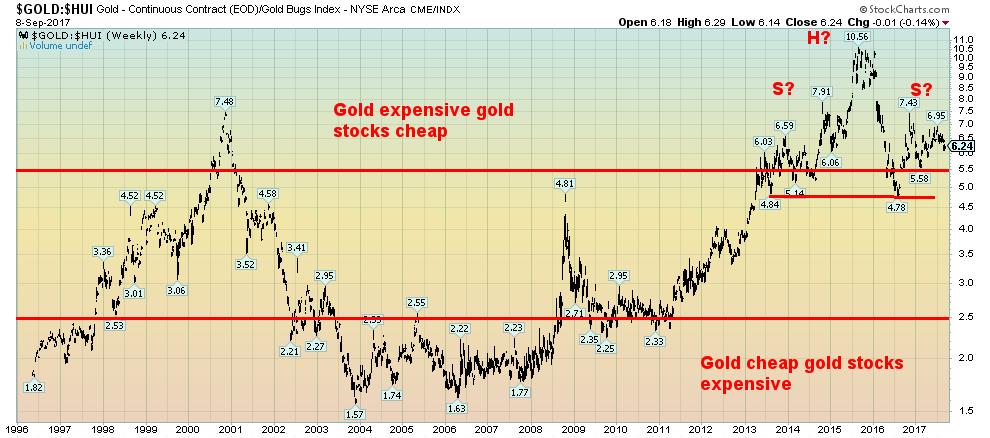
It is no surprise that gold stocks remain cheap compared to gold. This long term weekly chart of the Gold/HUI ratio shows that cheap for stocks is something that has persisted now for roughly four years. Maybe it is the new normal. But we like to look at chart patterns and we are encouraged by what appears to be a large head and shoulders top forming. A break under 5.5 would be helpful we need to break under 4.8 to suggest much lower levels in favor of gold stocks. But persistence in extremes is not unusual given that gold stocks remained overvalued to gold for a solid six years from 2003 to 2008. A breakdown under 4.8 would suggest that the Gold/HUI ratio could fall once again into the gold stocks expensive gold cheap range.
© David Chapman
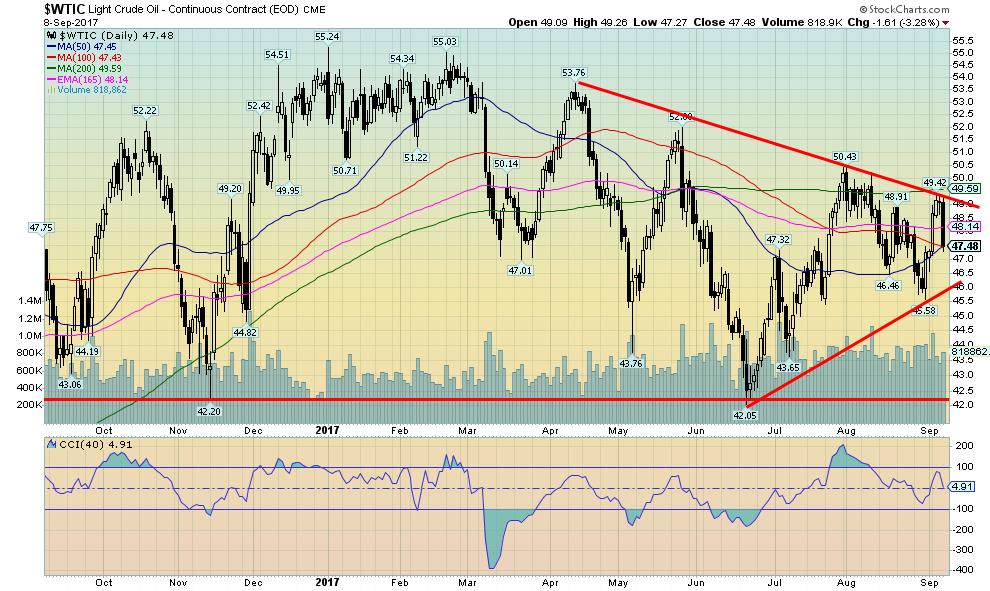
WTI oil prices have been all over the map the past couple weeks with a sharp rise followed by a sharp drop on Friday. Failure interestingly came at the 200-day MA and the downtrend line from the high of March 2017. WTI oil fell on Friday on fears that demand is about to fall sharply. Florida is on a per capita basis the highest consumer of gasoline in the country.
With the potential for much of Florida to be off the grid for more than a few weeks, it was thought that demand would plunge. Oddly it was Hurricane Harvey that sparked the rise in oil prices (along with gasoline prices) as refineries were shut down and wells capped. The downdraft that struck oil prices on Friday also hit other commodities including copper and natural gas.
The reason was essentially the same. The hurricanes were going to dampen demand for some time. There is support down to $48 but a breakdown under that level could send oil prices back to major support near $42. WTI oil has been volatile of late but it is tracing out a series of lower highs and lower lows. The very definition of a downtrend.
GLOSSARY
Trends
Daily – Short-term trend (For swing traders)
Weekly – Intermediate-term trend (For long-term trend followers)
Monthly – Long-term secular trend (For long-term trend followers)
Up – The trend is up.
Down – The trend is down
Neutral – Indicators are mostly neutral. A trend change might be in the offing.
Weak – The trend is still up or down but it is weakening. It is also a sign that the trend might change.
Topping – Indicators are suggesting that while the trend remains up there are considerable signs that suggest that the market is topping.
Bottoming – Indicators are suggesting that while the trend is down there are considerable signs that suggest that the market is bottoming.
(All charts are courtesy of Stock Charts and COT Price Charts.)
__
DISCLAIMER: David Chapman is not a registered advisory service and is not an exempt market dealer (EMD). We do not and cannot give individualized market advice. The information in this newsletter is intended only for informational and educational purposes. It should not be considered a solicitation of an offer or sale of any security. The reader assumes all risk when trading in securities and David Chapman advises consulting a licensed professional financial advisor before proceeding with any trade or idea presented in this newsletter. We share our ideas and opinions for informational and educational purposes only and expect the reader to perform due diligence before considering a position in any security. That includes consulting with your own licensed professional financial advisor.


El Dorado Raises $9M to Expand Cross-Border Fintech Platform
El Dorado, a Latin American fintech improving cross-border financial services, raised a $9 million Series A led by Paradigm with...


Bitcoin Stalls Near $60K as Strategy Moves, ETFs Outflow, and EU MiCA Rules Take Effect
Bitcoin hovers near $60,000 with ETF outflows, while Strategy boosts reserves, sells BTC, and raises dividends to reassure investors. Ethereum...


Cannabis Dominates Global Drug Use: Trends, Risks, and Shifting Markets
Cannabis remains the world’s most widely used illicit drug, with 256 million users in 2024, surpassing all others combined. Growth...


Italy Approves First Hydrogen-Powered Train for National Rail Network
ANSFISA has approved Italy’s first hydrogen-powered train, the Alstom HMU214, for use on the Brescia–Iseo–Edolo line. Capable of 140 km/h,...


Cotton Market Weakness Persists Despite Brief Rebound
Cotton prices fell to new lows last week before a modest rebound. USDA data shows crop conditions remain worse than...
 |
|
 |  |
 |
|
-

 Crypto2 weeks ago
Bitcoin and Ethereum Markets Steady as Strategy and Bitmine Expand Holdings Amid World Cup Crypto Activity
-

 Impact Investing5 days ago
ESG Gap Persists as Firms Struggle to Link Sustainability to Financial Value
-

 Crowdfunding2 weeks ago
Temotiva Launches Crowdfunding Campaign to Advance Preventive Mental Health
-
 Fintech39 minutes ago
El Dorado Raises $9M to Expand Cross-Border Fintech Platform
You must be logged in to post a comment Login