Featured
Why this bull market is more likely to end in tears of despair
The stock markets appear to be rolling over. But we need to breakdown to confirm the negative signals. On the TSX the best performers have been Golds, Metals, Materials and Info Tech. And is anyone noticing that the TSX Venture Exchange (CDNX) has become the best performing index in North America. The CDNX is over 50% junior mining companies and many have quietly doubled, tripled and more.

Ignore the economy! Buy stocks! That seems to be the message. Who cares if there are 36 million—or is it 40 million—unemployed? Who cares if the U.S. economy is going to contract 4.6% in 2020—or is it 4.9%, or is it, as the Conference Board says, 7%? Besides, it’s poised to rebound upwards of 5% in 2021. Who cares if dozens of companies will go bankrupt and many more will just close their doors for good, leaving potentially millions of workers with no job to go back to and 10,000 applications for every job opening? And we can only guess who cares if there are over 3 million cases of COVID-19 in the U.S. and over 130,000 deaths. By year-end, the figures could be 12 million cases and between 300 to 500 hundred thousand deaths. By 2021, the U.S. economy will be rebounding like gangbusters, especially after the election is out of the way.
Wall Street, it appears, can ignore all of that. Interest rates are historically low—at rock bottom—and are projected to stay that way for years. Monetary and fiscal policy is keeping the economy from complete collapse and the debt doesn’t matter. And there is more relief on the way as another $1 trillion rescue package is in the works. Canada appears poised to extend the CERB program. What? It’s only money and the Fed and the BofC can print it forever. The U.S. and Canada can borrow at ultra-low interest rates and have the Fed and BofC buy the debt. Debt monetization on steroids.
Since the pandemic low in March it seems that almost everything is soaring. The NASDAQ is up 57%, the Dow Jones Industrials (DJI) is up 40%, the TSX Composite is up 38%, and the TSX Venture Exchange (CDNX) is flying up 101%. But it is not just stocks that are leaping. Gold is up 25%, oil has regained an incredible 530%, and copper has leaped 43%. Gold stocks, as represented by the TSX Gold Index (TGD), has gained 105%. Even foreign indices are jumping as China’s Shanghai Index (SSEC) has started to fly upwards with the improving Chinese economy, and is up 29% since March. Even Hong Kong’s Hang Seng Index has gained 20% despite the ongoing protests and crackdown by China. Who needs democracy if the stock market is soaring?
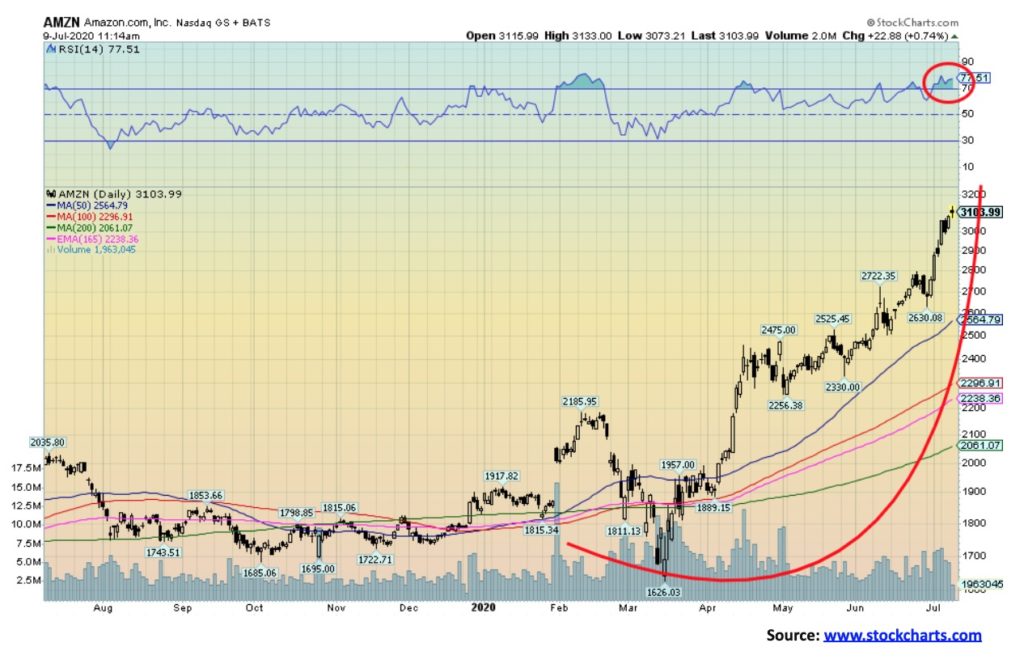
Maybe the picture of this bull market is best explained by one stock. Amazon (AMZN) keeps making Jeff Bezos the richest man in the world as it is up 90% since the March low. Jeff Bezos’ net worth is US$180.5 billion. If Jeff Bezos were a country, he would be the 53rd largest economy in the world as per the 2019 IMF estimates. There would be 133 countries smaller than Jeff Bezos. As to Amazon, well, it’s the biggest company in the world with a market cap of $1.5 trillion and a PE of 147.2. That would make Amazon the 13th largest country in the world, just ahead of Spain. Buying Amazon is safer than buying Spain. Oh yes, Moody’s rating for Amazon is A2; for Spain, Baa2.
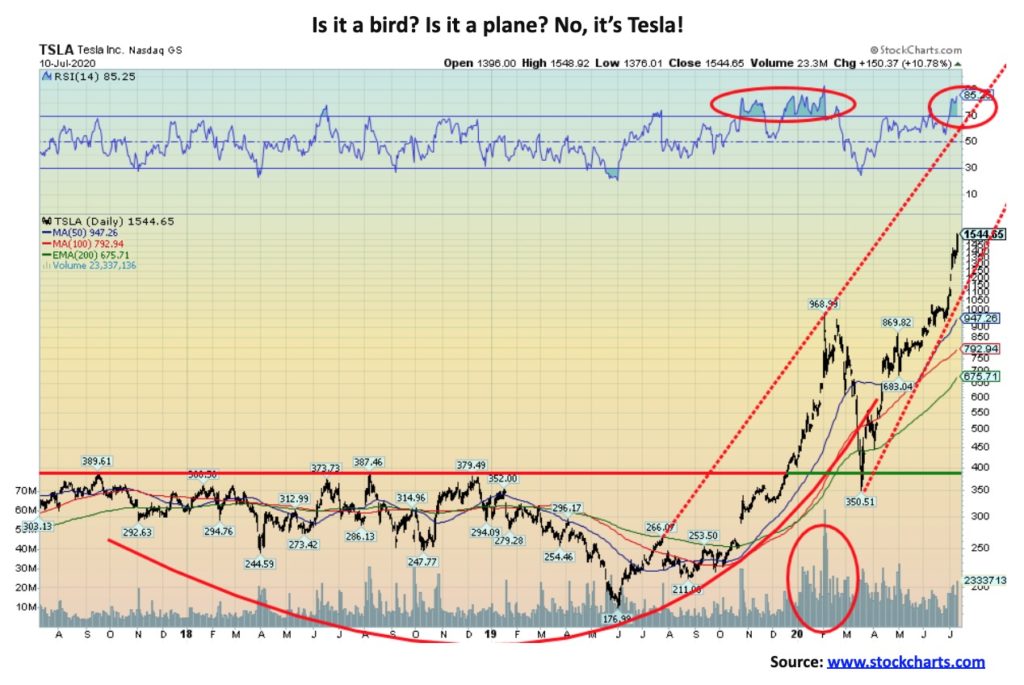
This bull market could also be attributed to the rising star. Tesla (TSLA). This stock is up 269% so far in 2020, up 341% from its March 2020 low, and up 772% from its last major low seen in June 2019. Its performance has been so strong that maybe they have to rename the FAANGs as FAANGTs, whatever that is. Throw in Microsoft and who needs to own anything else? Surprisingly, Tesla is not a part of the S&P 500. That could be coming. With some $5 trillion plus in index funds or actively managed funds benchmarked to the S&P 500, there would be a mad scramble to add the name to their portfolios lest they miss the boat. With a market cap as of July 10 of $286 billion Tesla could quickly become another trillion-dollar company. Tesla has just over 185 million shares outstanding. But be warned. Tesla may not be added to the S&P 500. It is just market rumour right now. (See chart on next page). Note, with an RSI of well over 70, it is super-extended.
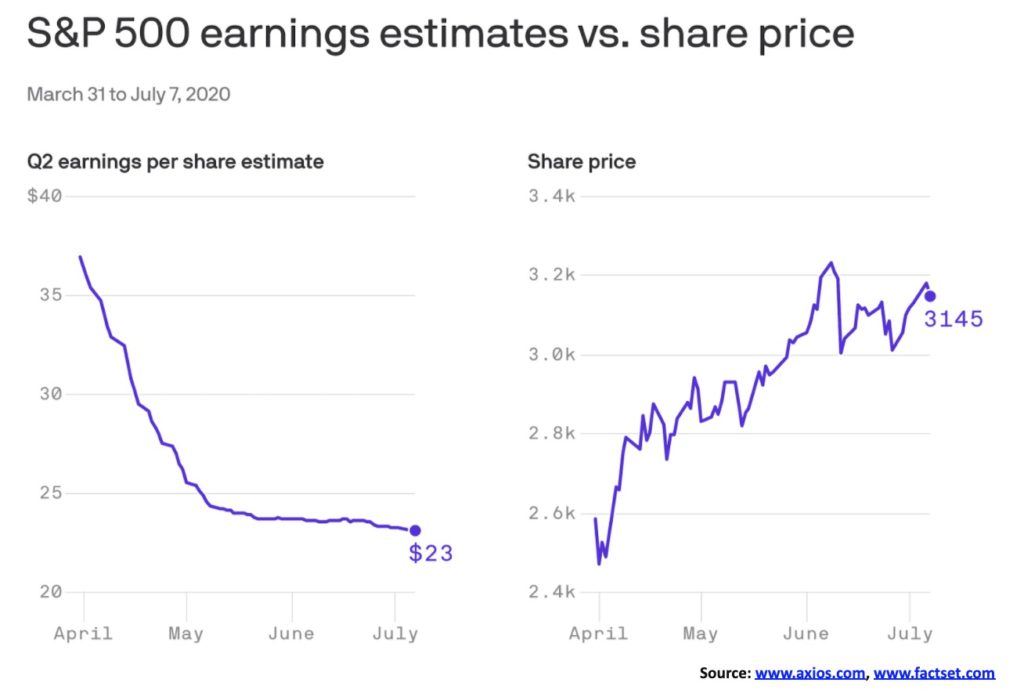
According to Axios, a U.S. news website, the NASDAQ has pushed itself to the largest spread over the S&P 500 since the dot.com bubble burst in 2000. Both the NASDAQ’s price earnings and price-to-sales are also the highest since that time period. They displayed an interesting chart in one of their recent letters. The chart showed how the median estimate for S&P 500 companies’ earnings per share was falling by a record 37%, even as the S&P 500 was gaining 20%. The decline is the largest since Q4 2008 when S&P earnings fell 34.3% and we know what happened back then.
The biggest declines in earnings were seen for energy, consumer discretionary, and industrials. As well, don’t forget that the NASDAQ has been propelled to record highs largely on the backs of double-digit gains on just five stocks: Facebook, Amazon, Apple, Microsoft, and Google (Alphabet). In 1972, it was called the “Nifty Fifty” rally. In 2020, we guess it is the “Fabulous Five” rally. A reminder: after the “Nifty Fifty” rally peaked in early 1973, the market (DJI) fell 45%.
The result of all of this is that the bull market is more likely to end in tears of despair rather than tears of joy. Since the beginning of 2020, bankruptcies have been occurring at a record pace. The retail sector in the U.S. has set a record with the latest casualty being Brooks Brothers. Even Chuck E. Cheese bit the dust. Other high-profile names that have bit the dust in 2020 include J.C. Penney, Hertz, Latam Airlines, Diamond Offshore Drilling, Chesapeake Energy, and Whiting Petroleum. Here in Canada, high-profile Cirque de Soleil Entertainment Group is the latest to collapse. In Western Canada, a raft of energy companies have gone under. Industries most impacted by the collapse include energy, entertainment, health and personal care, retail and restaurants, airlines, cruise lines, travel and lodging, and even industrial companies. Overall, the pace of bankruptcies is the fastest since 2009. Hundreds of companies that have fallen into bankruptcy have cited the COVID-19 as one of the primary reasons, due to the massive negative impact on revenues and earnings. Couple that with debt that becomes unserviceable and bankruptcy becomes the only way out. And with bankruptcy comes the loss of thousands of jobs.
Oh yes, the jobs apocalypse. Canada created 952,900 jobs in June as things re-opened. May and June have recouped roughly 40% of the job losses of March and April. That’s actually better than the U.S. who recouped only about 34% o f the job losses seen in March and April. But what about going forward? In the U.S., United Airlines has warned of 36,000 impending job losses, Wells Fargo is preparing to let go thousands, Levi’s cut 700 jobs, and hotels such as Marriott, Hilton, and Hyatt have announced thousands of jobs to be cut. In Canada, VIA Rail has announced that at least 1,000 will lose their jobs. But these are the announced job losses. Many just close their doors. From here on in, the job losses are more likely to be a slow process as employers realize the longer-term impact of the COVID-19 on their business. The first round of job losses was because of mandated closings. The second round may also be mandated closings after opening up in May/June and, as well, the drop in consumption.
But financial trouble for companies is just a part of it. In the U.S., states and municipalities are being pushed to the brink of bankruptcy as revenues collapse. They need large bailouts to prevent sharply raising taxes and slashing of services. The same is being seen here in Canada, as a major city such as Toronto has a $1.5 billion hole that has to be filled unless it raises taxes and slashes services. A bailout is needed. The same holds true for the TTC that provides the city’s subway, buses, and streetcar lines.
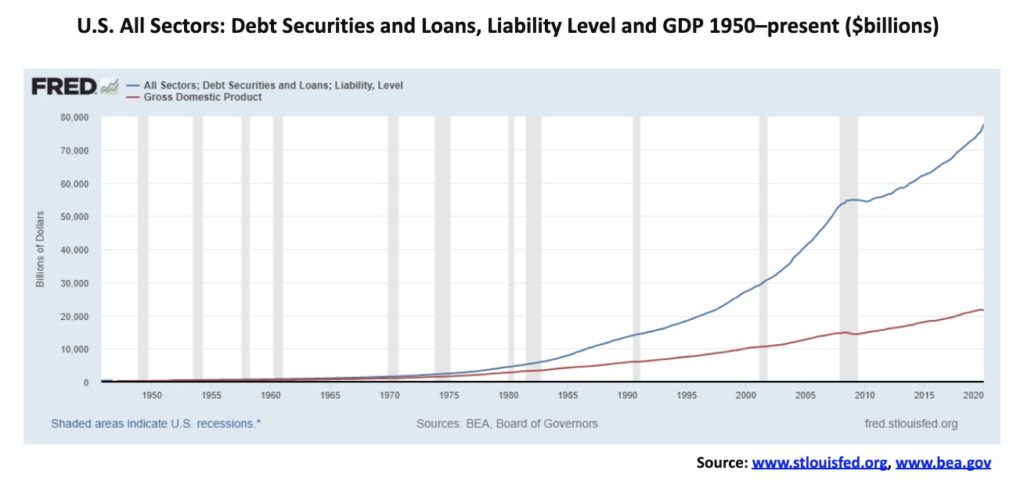
Debt has grown at an enormous pace over the past several years. Our chart below shows the growth of U.S. debt for all sectors vs. the growth of GDP. Since Q2 2009 when the recession was supposed to have ended, all debt has grown $25.3 trillion or 46% vs. $5.6 trillion or 39% for GDP. That works out to $4.50 of debt for every $1 of GDP.
Much has been made of the amount of the current budget deficits required to bail out the economy. Canada just announced they are going to have a deficit of Cdn$343.2 billion in 2020 as a result of the fallout from the coronavirus. The U.S. is expected to have a deficit of US$3.4 trillion. That represents 15.9% of GDP for Canada and 16.9% for the U.S. Also, much has been made of Canada smashing through the trillion-dollar mark for federal debt. That represents a 44% Federal debt to GDP for Canada. The U.S.’s federal debt to GDP is, by contrast, an astounding 132.5%. It’s not the worst. Japan has the highest federal debt to GDP at 283%. Others, including the U.K, Germany, and France, have a higher federal debt to GDP than Canada. So, some perspective on Canada’s federal debt is needed.
The stock markets have been soaring. But the past decade’s GDP growth rate was the slowest and lowest of any recovery in the past thirty years. The 1990s’ expansion saw growth at double the rate of the past decade. Yet you’d never know it from the stock market. The stock market is not the economy. Instead, it is a reflection of too much money chasing returns not available elsewhere. But, as we all know, historically low interest rates, massive growth in debt, and massive expansion of central banks balance sheets have contributed to the bubble that has been created in the stock market. The result has seen the 1918 pandemic, the 1929 depression, and the 1968 social unrest and race riots all come together against the backdrop of the impending election that promises to be the most controversial and potentially the most violent one ever. And we have an overvalued stock market. What could go wrong?
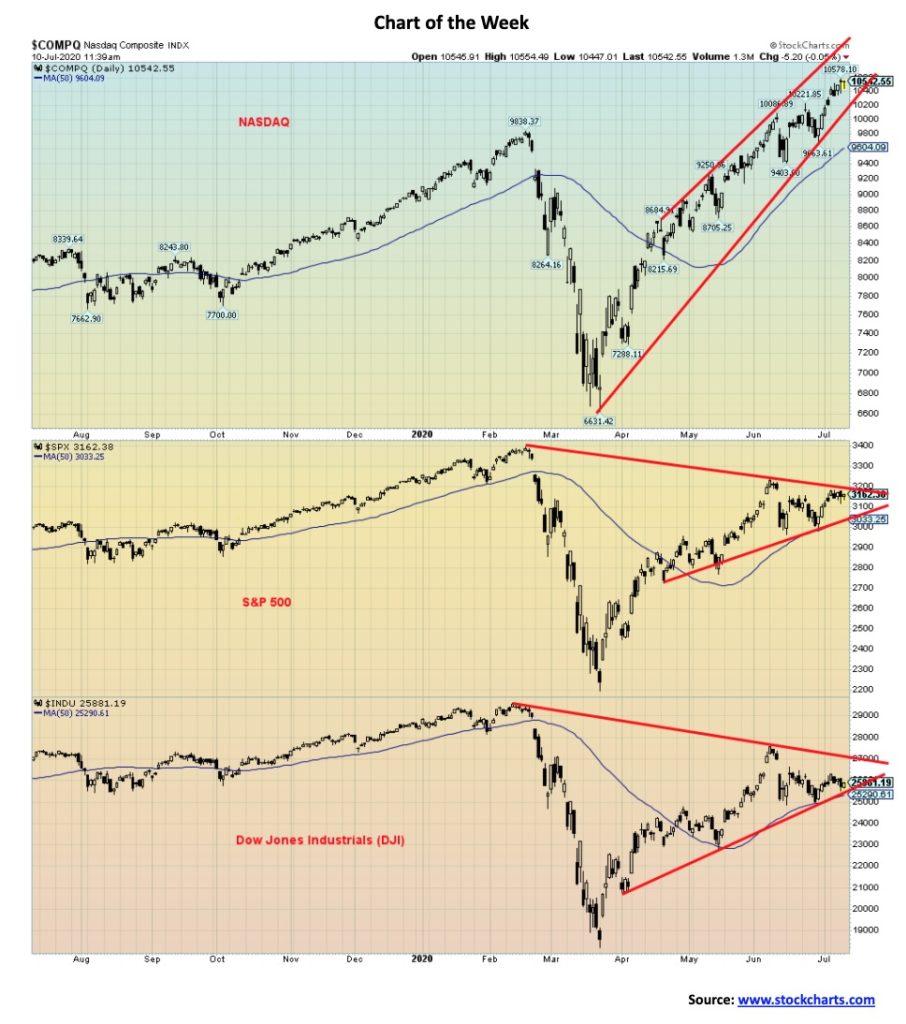
This is a picture of the significant divergences that have arisen between the major indices. One of the first things we are taught in technical analysis is Dow Theory. Dow Theory has five basic tenets. Without explanation, they are: 1. The averages discount everything; 2. The market has three trends; 3. Major trends have three phases; 4. The averages must confirm each other; and 5. Volume must confirm the trend. Dow Theory is used over and over again in technical analysis. These five tenets can be applied to almost any market that has similar vehicles. Our most common application is with major indices and gold and silver. Our concern here is number 4: the averages must confirm each other.
Here we have the NASDAQ making, on an ongoing basis, new all-time highs. Meanwhile, the S&P 500 and the Dow Jones Industrials (DJI) are not. The original concept from Dow for number 4 was comparing the DJI with the Dow Jones Transportation (DJT). But it also applies to the other major indices. They should all be making new all-time highs. They are not and, until they do, the divergence remains in place. As Dow says, if only one average is giving the signal, then there is no bull market. The conclusion is, there is no bull market until the S&P 500 and the DJI confirm the NASDAQ.
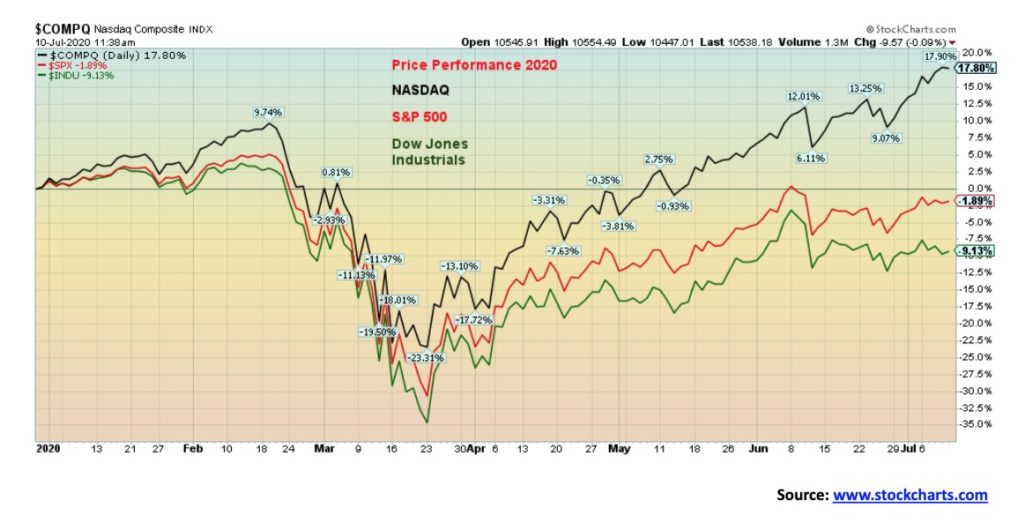
We can see it in the price performance of the three as well. The NASDAQ is up on the year; the other two are not. We are not in a bull market. We are in a corrective market to the sharp decline seen in March 2020.
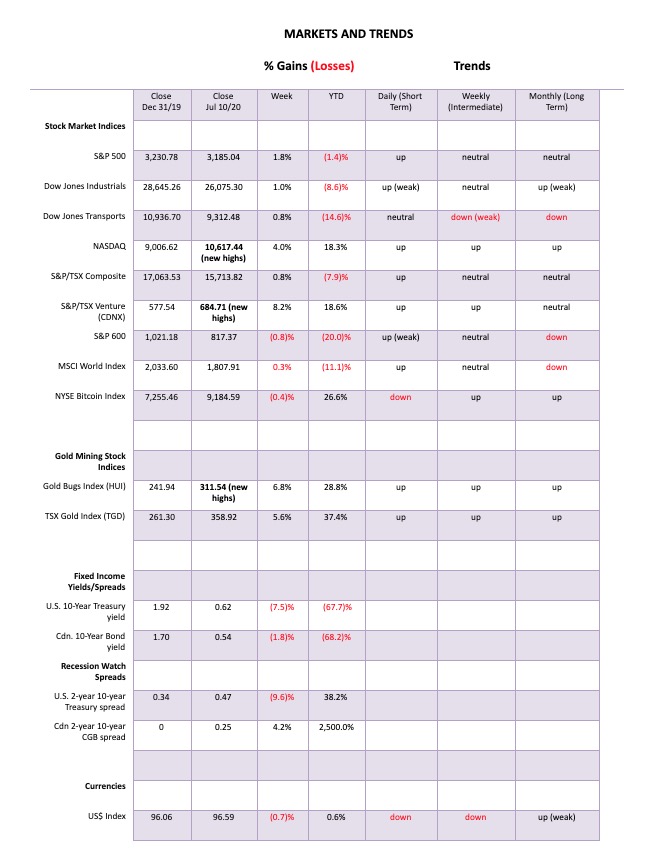
Another week; another up week. This past week the S&P 500 and the other stock indices defied the sharply rising coronavirus numbers and the fact that what was opened up might be closed down again—along with the growing violence on the street as we march towards the most contentious election in U.S. history—and the index rose 1.8%. Others joined the party—well, almost everyone. The Dow Jones Industrials (DJI) was up 1.0%, the Dow Jones Transportations (DJT) gained 0.8%, the NASDAQ starred again up 4.0% and new all-time highs, but the small cap S&P 600 faltered, down 0.8%. A divergence? In Canada, the TSX Composite gained 0.8% but the TSX Venture Exchange (CDNX) gained 8.2%, making new 52-week highs, and is now the best-performing index. Overseas, the MSCI World Index was up 0.3%, the London FTSE bucked the trend and fell 0.8%, the Paris CAC 40 lost 1.6%, the German DAX was up a small 0.2%, the Tokyo Nikkei Dow (TKN) gained 1.7%, and China’s Shanghai Index (SSEC) starred making new 52-week highs, up 9.5%. The SSEC is buoyed by the recovering Chinese economy and its continued low coronavirus numbers. For the record, if anyone is following, Bitcoin lost 0.4%. Bitcoin and the cryptos seem to have lost their lustre.
It won’t be out until about the end of the month, but Q2 GDP is expected to show a contraction up to 50% for the U.S. economy, although consensus numbers are a contraction of around 35%. The trade deficit is widening, not getting smaller—going in the opposite direction of what Trump wants. A deepening trade deficit is negative for GDP. With both exports and imports falling, it suggests the global economy is also contracting. The threat of closing down again what had been opened up would effectively threaten any nascent recovery. We believe the recovery will be more L-shaped, not a V or a U or a swoosh. The U.S. dollar is turning negative and the job market remains bleak. But the Fed balance sheet grew and M2 money supply keeps rising at what we believe is an unsustainable pace. Rising gold prices are a sign of systemic problems in the economy.
So, under all these circumstances can the stock market keep going up? Only if they come up with more stimulus and more money printing. But, as we note further down, the Fed’s balance sheet has started to contract. And the fight over another $1 trillion dollar rescue package is running into resistance from deficit hawks. The extra payments that Americans were getting is coming to an end, even as Canada is extending theirs. Already there is a growing army of people living on the street or in their cars.
And the violence leading up to the election continues. Even mainstream newspapers are recognizing the potential for an election poop show. Ian McGugan, writing in The Globe and Mail (“Why investors face chaos unless there’s a landslide presidential victory this November”, The Globe and Mail, July 11, 2020 – https://www.theglobeandmail.com/investing/markets/inside-the-market/article-investors-should-start-hoping-for-a-trump-or-biden-landslide-victory/) says that any combination of a narrow Biden or Trump victory is sure to bring court challenges. Possibly only a landslide win by either candidate might prevent a hung election, and if Trump is on the losing end, even that is not guaranteed. It could make the hung election of 2000 look like a Sunday school picnic. As well, violence is growing on the streets, attempts at voter suppression are growing, right-wing militias are preparing to start a civil war if Trump doesn’t win, and left-wing protestors may also riot if Biden doesn’t win. We could go on. All of this may happen—or maybe none of it. But, in a deeply divided nation led by a president who encourages divisiveness, the odds of the election going off smoothly are, it appears, slim to none.
And then there is the coronavirus where the U.S. is now reporting record numbers. Instead of going down, their numbers are going up. And a stock market going up, defying the chaos behind the scenes.
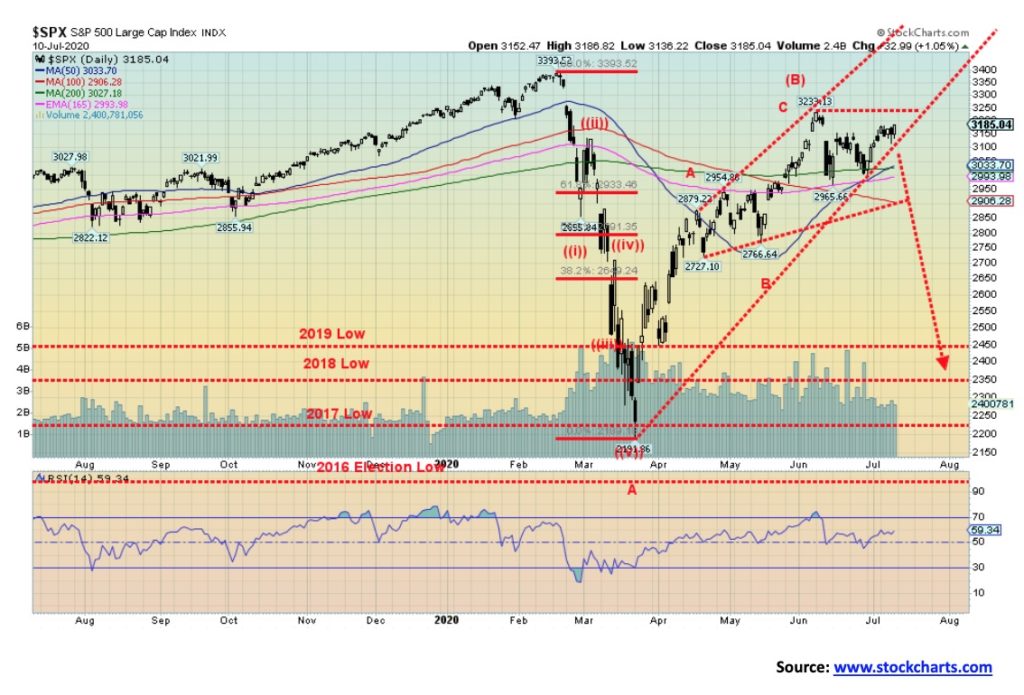
The S&P 500 could be making a lower top here. The recent low was at 3,000. A breakdown under that level could next target down to 2,765. That coincides with the May low. A breakdown under that level would next target down to 2,400. Under 2,400, new lows are possible. Only new highs above 3,233 could change this scenario. This is not to say that can’t happen.
A reminder that the March collapse took out the 2019, 2018, and 2017 low. That signaled to us we have most likely entered a secular bear market. The rally since March, as good as it has looked, has been so far a classic bear market rally—meaning it sucks everyone back in again while the bear is waiting to emerge once again from its cave and claw investors.
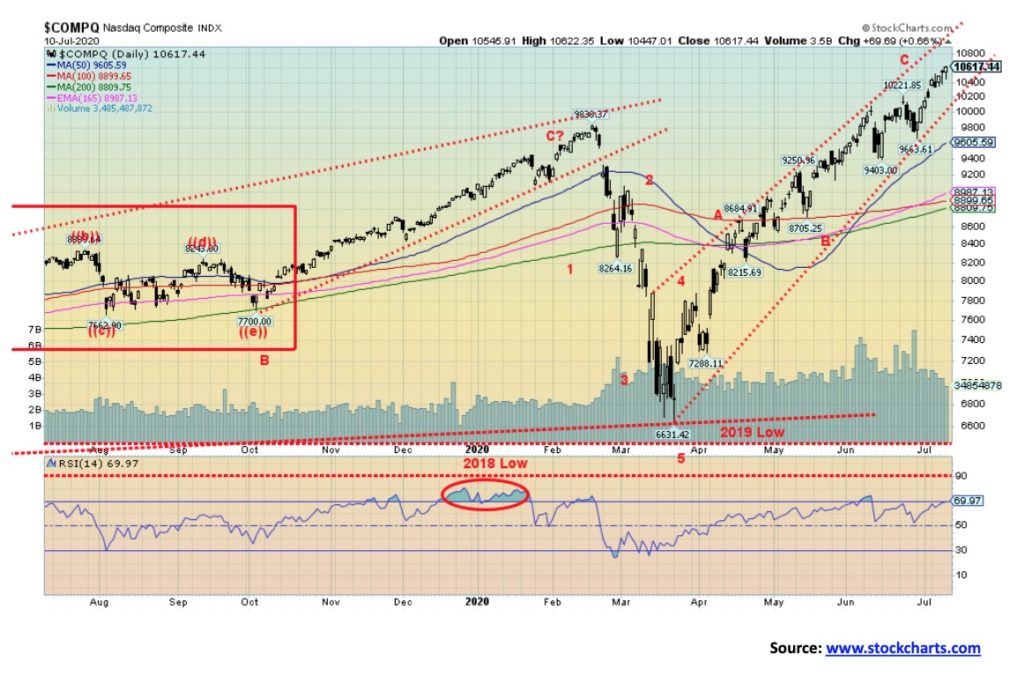
Here is the big star: the NASDAQ. All-time highs seem to be old hat to the NASDAQ. Not so much for everyone else. They haven’t quite joined the party. The NASDAQ is up 60% from the depths of the coronavirus low in March. It is still the only major index in positive territory for 2020. But we know five or six stocks have been leading the way up. Take them out and it doesn’t look so robust. Volume keeps tailing down. No matter how we look at it—narrow based rally, diverging with the other indices—this tells us, okay, be long but keep a tight stop.
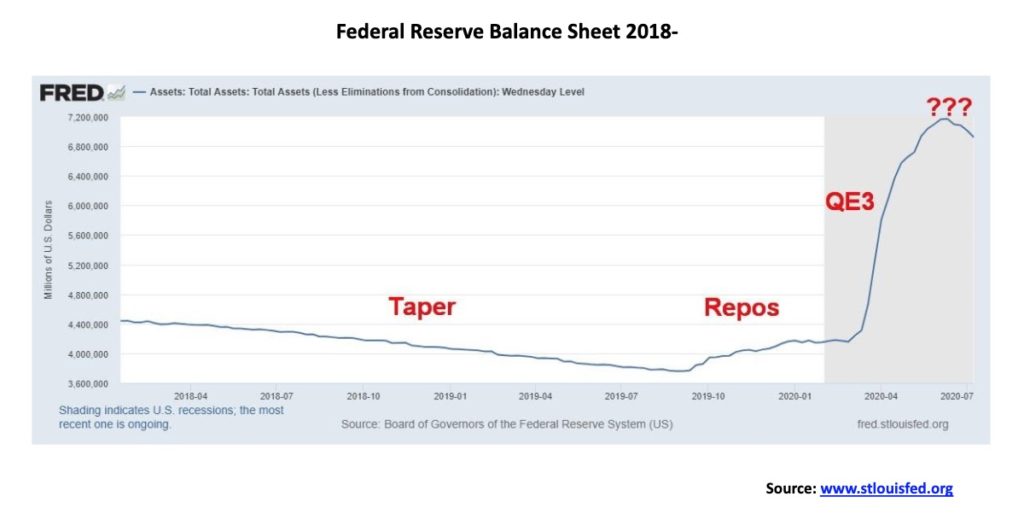
What is going on with the Fed’s balance sheet? From March until early June the Fed’s balance sheet exploded by over $3 trillion as they purchased bonds and more from the money banks and financed the growing deficit to combat COVID-19. But, after peaking with the June 10 report, the Fed’s balance sheet has fallen by $248 billion, including $88 billion in the past week. As we have noted, ironically the stock market peaked on June 8 and while the NASDAQ has gone on to make new highs, the S&P 500 and the DJI have not. We have little doubt that the Fed’s lack of purchases over the past month or so is having a dragging effect on the stock market. Are they trying to prick the bubble?
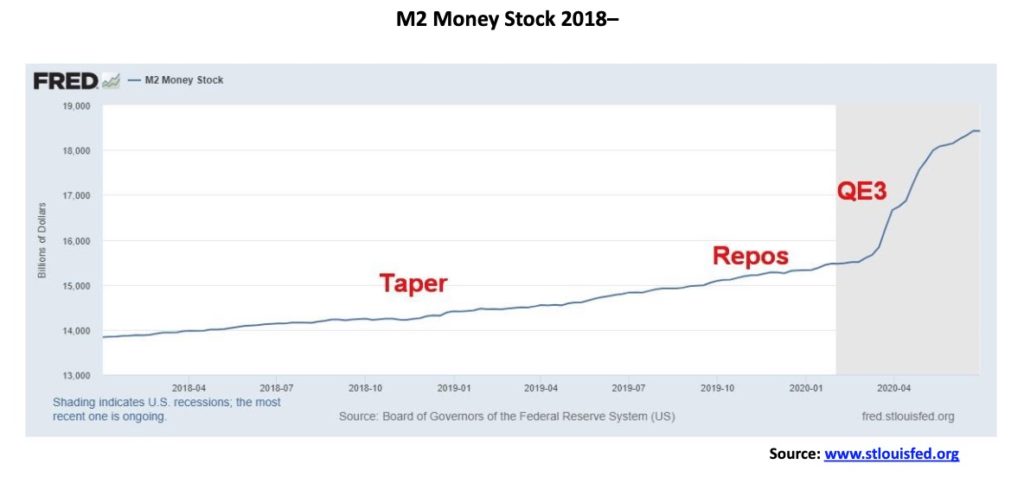
Money supply, as represented by M2, continues to grow. M2 is up $2.8 trillion since the beginning of March as the economy shut down. While the rate of growth has slowed considerably, it is still up about $182 billion since June 8. Fed balance sheet down. M2 up, albeit at a slower rate. So, what gives? We don’t have an answer nor have we found any. Hardly anyone mentions the Fed balance sheet now.
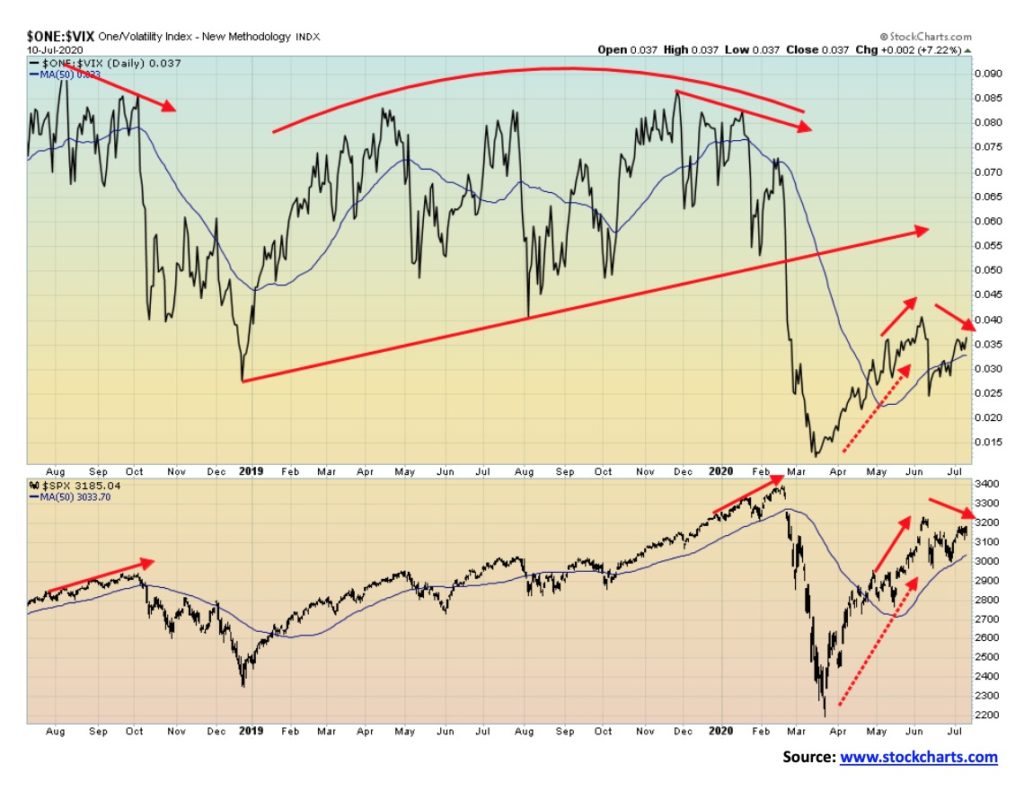
The VIX volatility indicator has no divergences except to confirm the stock market. So far, the VIX is making a lower top just like the S&P 500. If that’s correct and the S&P 500 goes to new highs, we would expect the VIX to make new highs as well. (Note: we have inverted the VIX as usually it is the opposite of the index). If there is any divergence, we note the S&P 500 is off only 6.5% from its all-time high. The VIX, on the other hand, would have to gain 148% (on the inverted VIX chart) to reach its 2019 high. That’s quite a difference. We are with the VIX. This is not a healthy market.
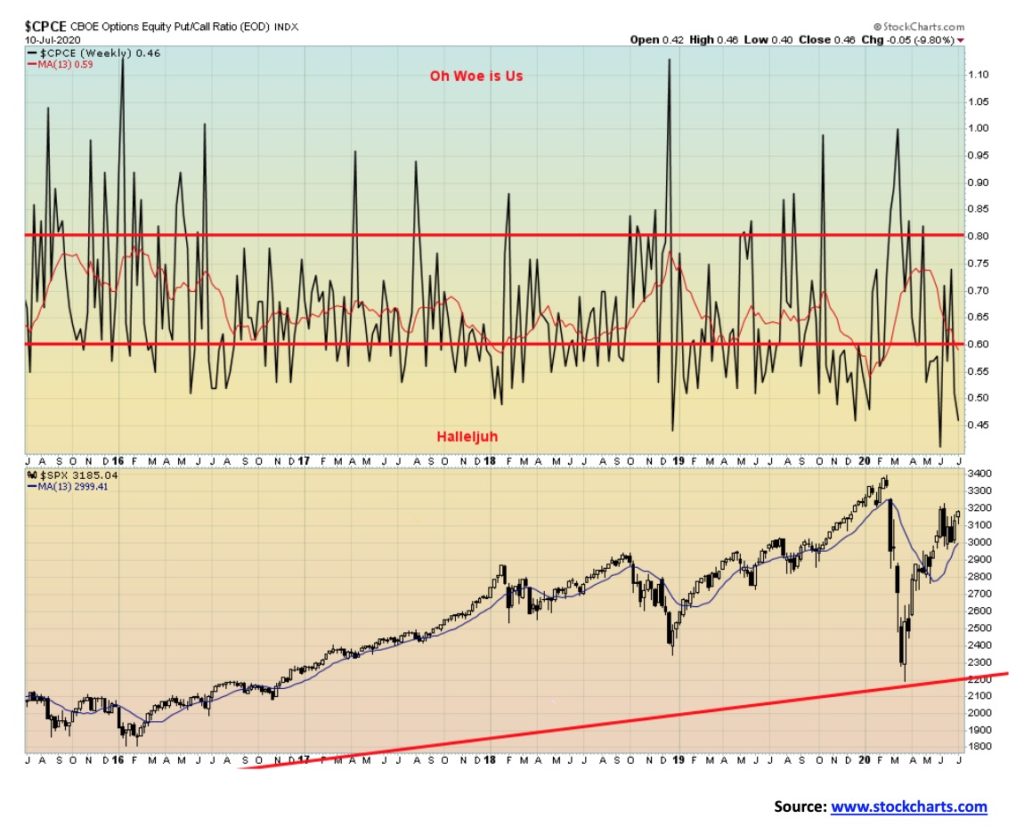
We were surprised to discover that the recent rebound in the stock market has brought out the call buyers in force. This week the CBOE equity put/call ratio dropped to 0.45, a level almost as low as the record low we saw in February at the top. What it tells us is the market is bullish and is expecting it to go higher. Maybe they have been watching the NASDAQ and thinking if the NASDAQ can make all-time highs the S&P 500, DJI, etc. can as well. But usually this is a sign of an impending top.
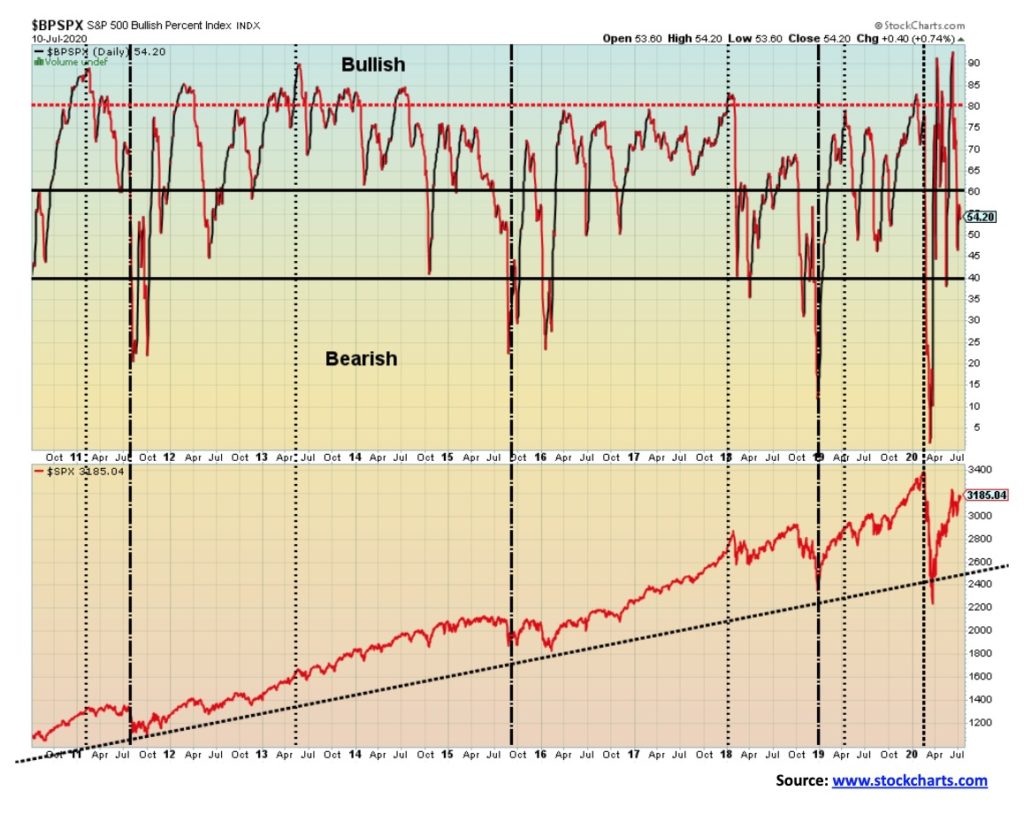
The S&P 500 Bullish Percent Index (BPSPX) has fallen into neutral territory, diverging sharply from the S&P 500 that has been trying to recover and post new highs. It has fallen precipitously from the bullish level seen earlier. Could it be telling us something? On the other hand, the futures.com daily sentiment indicator is at levels often associated with a top. It’s as high today as it was on June 8, the last top.
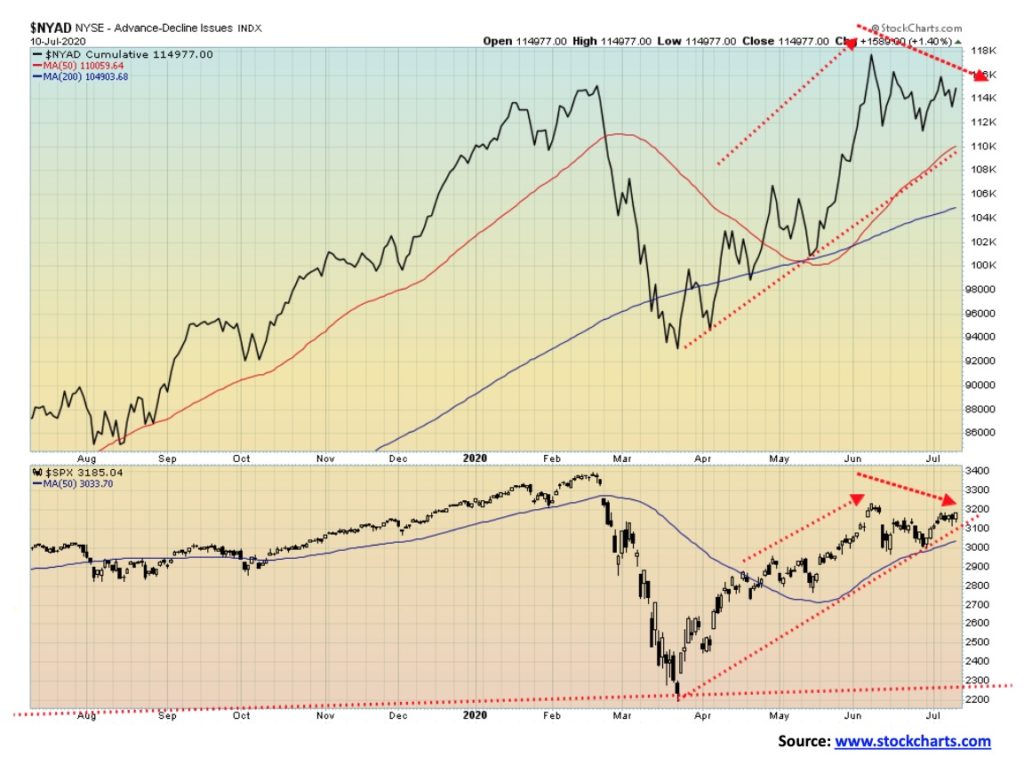
The NYSE advance-decline line continues to be somewhat supportive of the S&P 500. It’s holding well above its 50-day MA, whereas the index is above—but that’s it, just above. There are no divergences between the two. Again, that’s supportive. Grant you, just before the March collapse the advance-decline line also was supportive of the up trend. Many believe that the advance-decline line is a sign of strength in the market. But could it be misleading?
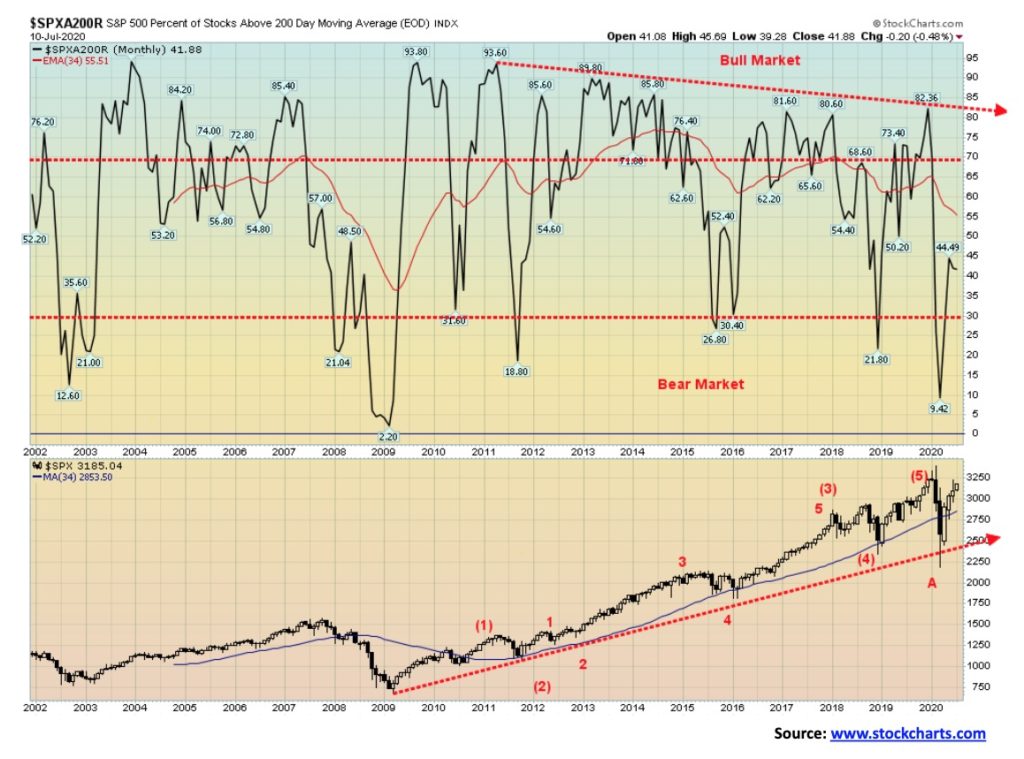
The S&P 500 % of stocks trading over their 200-day MA has not been an encouraging sign of a strong bull market. We have consistently pointed out that the index has been led by the big six: the FAANGs plus Microsoft. The latest reading of this technical indicator shows that only 42% of the stocks in the S&P 500 are trading over the 200-day MA. That’s pretty low for a bull market. A reading over 70% indicates a bull market. We haven’t come close. This is not a bull market—it’s a bear market correction.
The TSX Composite joined the party this past week, posting an 0.8% gain. But it was a really mixed gain and, overall, it underperformed the U.S. indices. There were stars and dogs. The stars: Golds (TGD) +5.6%, Metals & Mining (TGM) +5.5% (new highs), and Materials (TMT) +5.8% (new highs). The dog: Energy (TEN) -3.6%. Overall, eight of the fourteen sub-indices posted gains. Other winners were Consumer Discretionary and Consumer Staples, Information Technology (new highs), Health Care, and Industrials while Financials, Income Trusts, Real Estate, Telecommunications, and Utilities lost. We have continued to believe the best places to be were Golds, Metals, Materials, and Info Tech. That all were making or close to new highs this past week supports that.
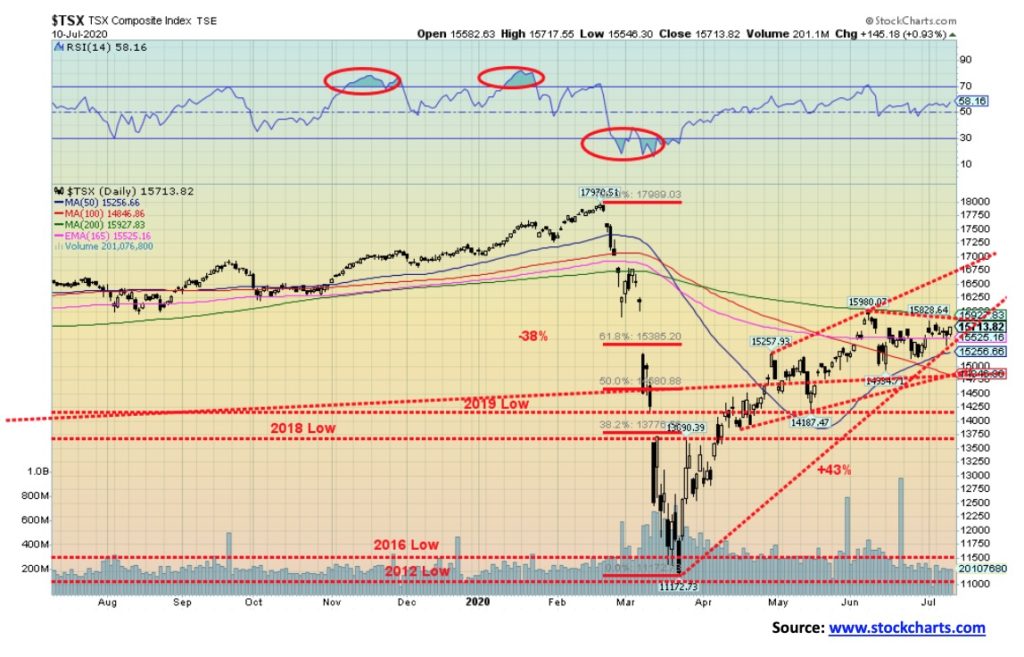
The TSX has been a bit of an underperformer. It has struggled at the 200-day MA and now could be rolling over. Financials are the largest component followed by Energy and both have been poor performers. Financials are down 18.3% in 2020 and Energy is down a whopping 48.9%. Health Care (THC) is also a drag, down 30.1%, Income Trusts (TCM) down 19.2% in 2020, Real Estate (TRE) down 22.5%. Info Tech (TTK) has been the big winner, up 44.2%. So, for the TSX it is not just being anywhere, you have to be specific and be in the right sectors. There is support for the TSX down to 15,000 but below that the decline could be swift. Resistance is clear at 15,700 to 16,000. A breakout over 16,000 could launch a new bull market.
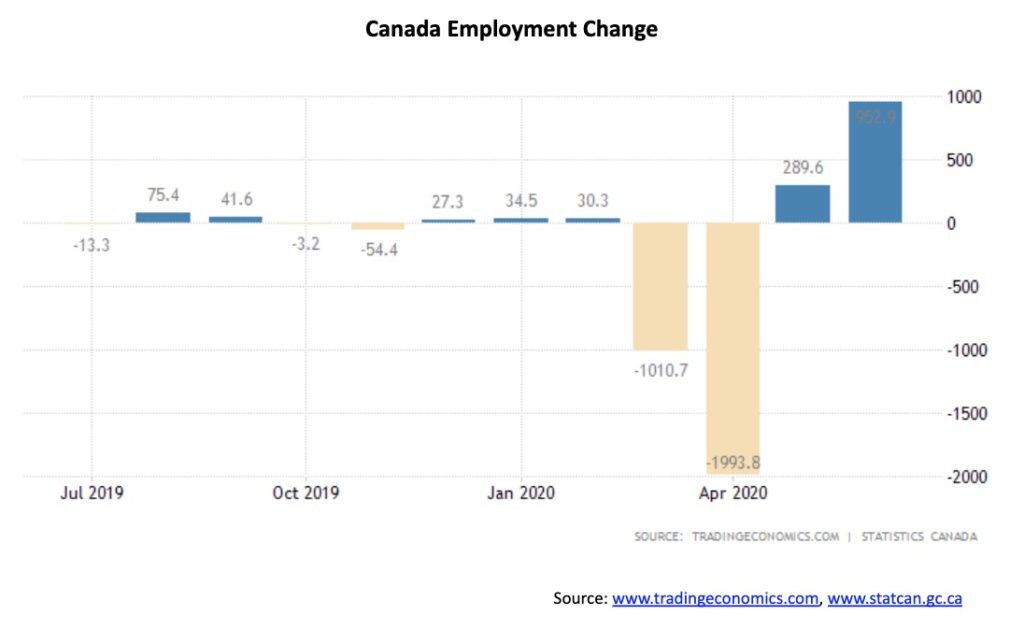
Wow! Canada produced a record 953 thousand jobs in June 2020, surpassing the consensus forecast of 700 thousand. Of those 488 thousand were full-time and 464 thousand were part-time. The bulk of the jobs were in the service sector, including retail trade (+222 thousand), accommodation and food services (+164 thousand), and healthcare and social assistance (+121 thousand). Jobs also increased in goods-producing sectors, including construction (+83 thousand) and manufacturing (+81 thousand). Ontario led the way with a gain of 378 thousand, given the lifting of COVID-19 restrictions in May.
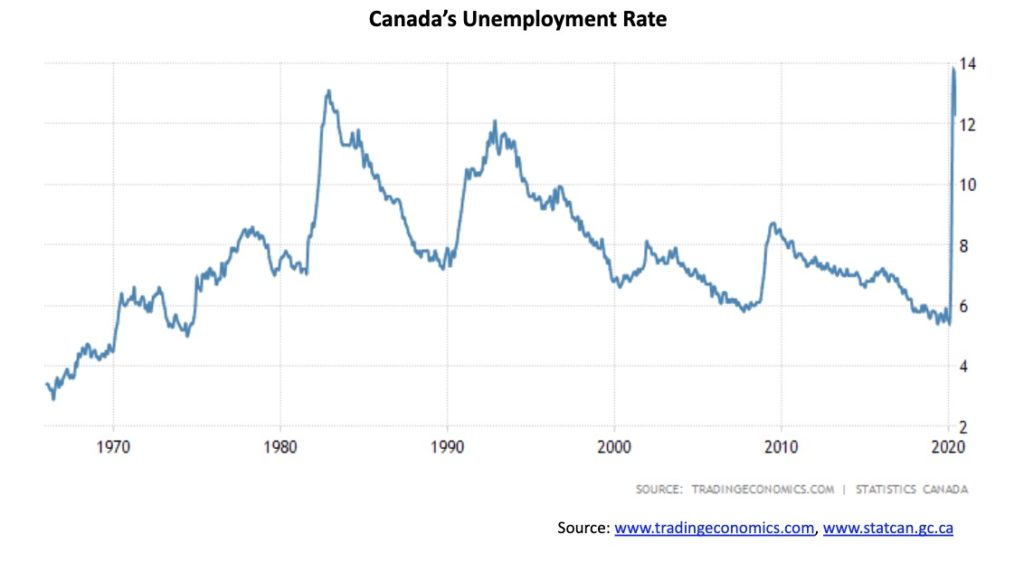
Some perspective. The job gains over the past two months were 1,242.6 thousand. But that’s against a loss of 3,004.5 thousand in March and April, leaving 1,761.9 thousand still out. That’s 59% of those who lost their jobs who are still unemployed. That’s actually better than the U.S. where the comparable number is 66%. The job picture is improving, but it has a long way to go. Don’t expect the July numbers to look so good. Canada’s unemployment rate fell from 13.7% to 12.3% but that was above the expected 12.0%. The labour force participation rate jumped to 63.8% from 61.4% as more people were looking, but that is still below the 65.5% that existed in February. If we were at the higher participation rate the unemployment rate would be a lot higher. The current employment-population rate is 56%. That’s better than the 52.9% recorded in May, but is also well below the 61.8% seen in February. That means that 44% of the working age population is not working. The R8 unemployment rate (similar to the U.S.’s U6 unemployment rate—the highest measurement) was 15.5%. That was down from 18.2% in May. The R8 rate includes discouraged job searchers and involuntary part-timers.
It will be tougher going forward to get the unemployment rate down. The next chart shows the unemployment rate going back into the 1960s. It has never been so high. These were the easy jobs to regain. But, as small businesses don’t reopen because of bankruptcies and more, the jobless rate will remain high. New job postings are apparently 21% below last year’s levels. And there may be many looking for jobs but their skills don’t fit the jobs available. Those impacted more negatively include women, young people, the less educated, gig workers, and, sadly, people of colour. No matter how one cuts it, it will take years to whittle these numbers down and that assumes there is not another wave that closes things down again. Many have also had their hours cut. While average hourly earnings rose, it was largely because so many came back to work. 2,452.6 thousand were still officially listed as unemployed in June. That’s more than double what the number was in February. There were 1,762 thousand fewer employed in June than in February, including over 500 thousand part-timers not employed.
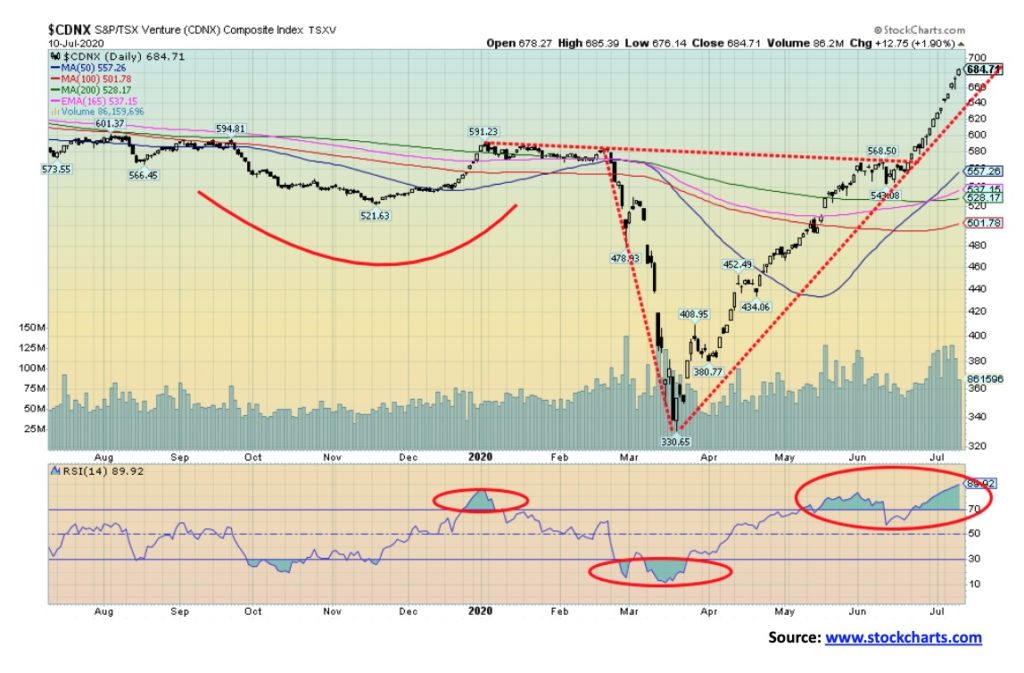
The TSX Venture Exchange (CDNX) has been flying. Since that low in March, the CDNX is up a stellar 107%. The CDNX is made up of at least 50% junior mining—predominately gold mining—so it is no surprise that we found numerous junior gold miners that have doubled, tripled, and even quintupled in that period (that’s a 5-bagger in other parlance). And the best part about it is hardly anyone has noticed. Okay, not those who are familiar with the sector. It seems that every other day we learn of a junior miner that has received a significant investment from Eric Sprott of Sprott Inc. A recent announcement that Mr. Sprott had invested in junior miner Stratabound Minerals (SB-CDNX) saw the stock leap from 10 to 20 cents in a heartbeat. It hit a high of 25 cents and closed Friday at 14.5 cents. Such is the volatility in the junior gold mining market. But the CDNX is now getting quite stretched. Its daily RSI has been consistently overbought over 70 for the past few weeks. Its weekly chart is now approaching the 4-year MA, an area that might provide resistance. The CDNX is also at its 55-month MA which is not much more than the 4-year MA. But that is just the nature of the CDNX in a junior gold mining bull market. The CDNX has a wild history of big rises followed by huge plunges: 2003–2007 +437%; 2007–2008 -80%; 2008–2011 +263%; 2011–2015 -81%; 2016–2018 +101%; 2018–2020 -65%. Now here we go again. Given that previous bull markets have tended to last at least a year or even two or three, we still might be in the early stages of this one. After all, it is only four months for this one so far. But that doesn’t mean it can’t have a sudden 25% pullback. Be prepared for volatility. There is some resistance up around 700–750, then again up to 900–1000. Support is at 600 and then down to 500. Since that March low there has only been one week where the CDNX did not go up. The CDNX has suddenly become the best-performing index. Yet still few are paying attention. Wait till they notice.
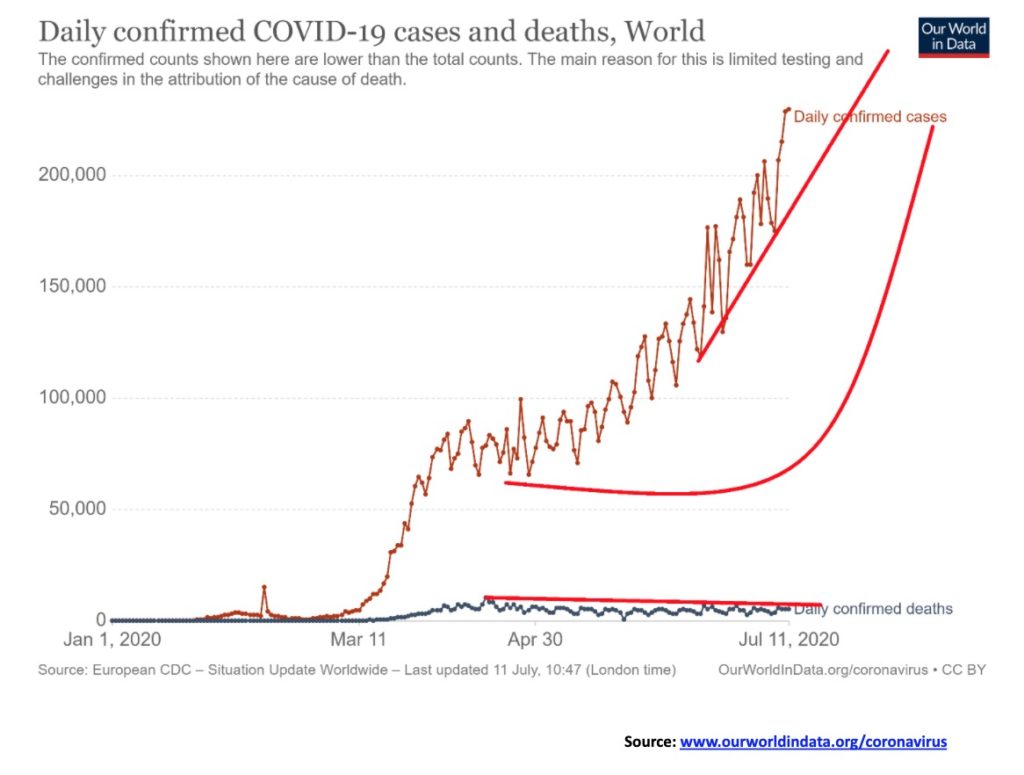
Instead of going down the number of COVID-19 cases keeps on rising. And remember that this is just the reported ones. Many more, especially in third world countries, may just go unnoticed. The big three are the major contributors – U.S., Brazil, India. Unsurprisingly all three are led by leaders who were dismissive of the coronavirus. Jair Bolsonaro, the president of Brazil, is just the latest leader to be diagnosed with COVID-19. Mr. Bolsonaro once described COVID-19 as “just the sniffles”. His country is second behind the U.S. with over 1.8 million cases and over 71 thousand deaths. India has only recently soared in third place behind Russia. Peru completes the top five in cases. In terms of deaths the U.S. and Brazil remain numbers 1 and 2 but the U.K., Italy and Mexico are numbers 3 through 5. There appears to be no end of this.
Coronavirus: As at July 12, 2020 14:22 GMT
# Cases – 12,884,275
# Deaths – 568,561
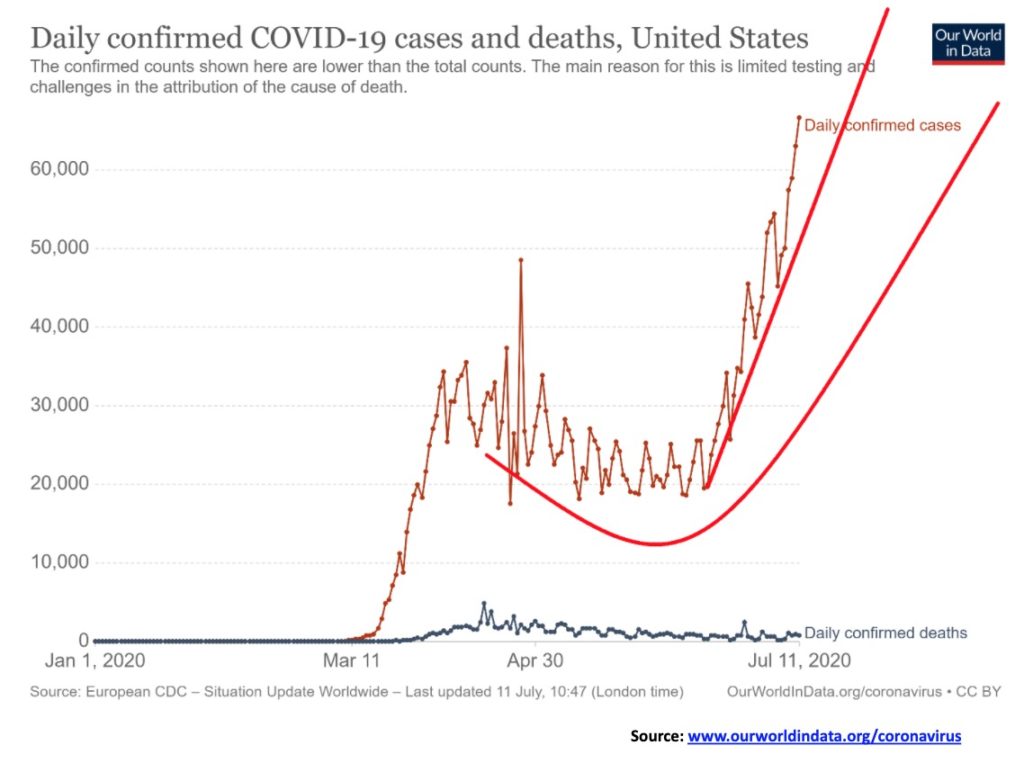
The number of cases in the U.S. have soared. A few weeks back we showed that the U.S. was breaking out to the upside in terms of the number of cases and suggested they could soon see a record number. This past week they had record day with over 70 thousand cases. Quite possibly health guru Tony Fauci’s prediction that the U.S. could soon have 100 thousand cases in a day because of the direction they were going in could become a reality. Leading the way in new cases is Florida and Texas two states that decided to dismiss the fears of COVID-19 and opened up early. They are now being forced to walk that back and even close down again. The top five in cases are New York whose numbers are now falling, California, Texas, Florida and New Jersey whose numbers are also falling. Georgia, Arizona, and, North Carolina are other states where the numbers have been rising sharply besides the big three of Florida, Texas and California.
Coronavirus: As at July 12, 2020 14:22 GMT
# Cases – 3,357,928
# Deaths – 137,429
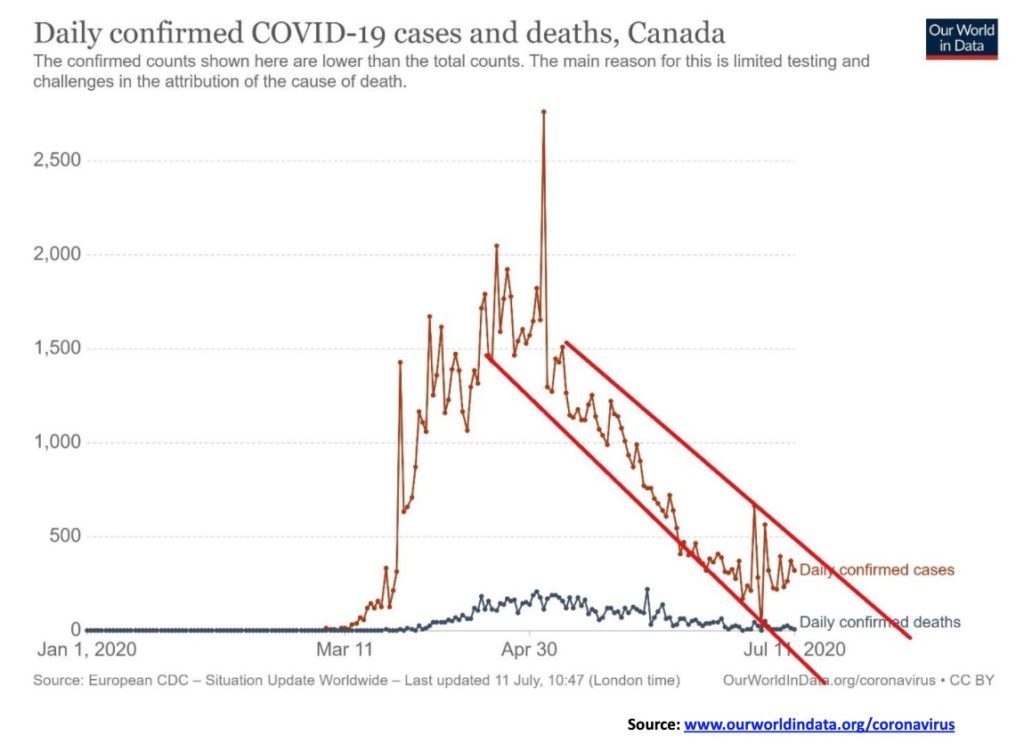
Canada is one country where the numbers are actually falling although there has been a bit of volatility in the numbers over the past week or so. But overall Canada is on a downward trend as are the number of deaths. Countries in the EU are also seeing falling numbers. Spain recently reported a day when they had no new cases yet Spain was one of the major leaders in the early going. In Asia, Taiwan looks like a genius for its ability to control the coronavirus. Number of cases – under 500; number of deaths – 7. Not bad for a country of about 24 million people densely packed on an island about half the size of New Brunswick and just over two-thirds the size of Nova Scotia. Canada ranks #20 in the world in terms of cases and #14 in terms of deaths.
Coronavirus: As at July 12, 2020 14:22 GMT
# Cases – 107,347
# Deaths – 8,773
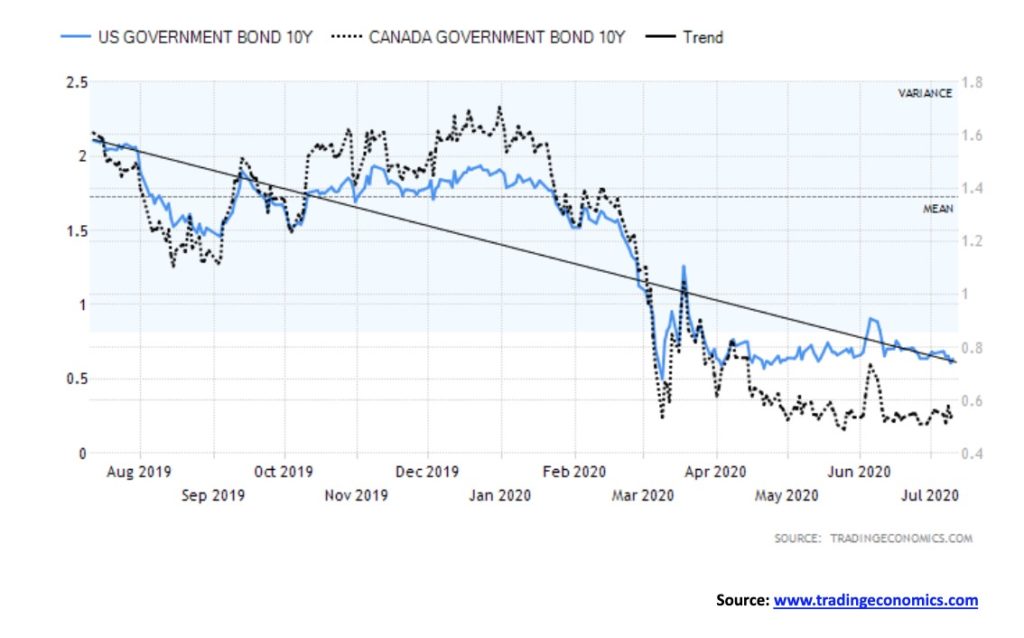
There continues not much to be said about interest rates. They are going to remain low for the foreseeable future. The Fed and BofC show no propensity to hike interest rates and therefore are poised to keep that at near zero for the next few years. That means longer rates, especially for government bonds, will remain low. With the Fed and BofC absorbing some (much?) of the debt to finance the huge coronavirus deficits, that keeps a lid on longer rates. The governments seem intent on issuing long dated bonds to try and lock in these super-low interest rates. But these super-low rates also encourage speculation and house-buying, given low mortgage rates. And, as well, it encourages arbitrage borrowing at the bank and buying high-yield stocks. This past week, rates slipped ever so slightly with the U.S. 10-year treasury note falling to 0.62% from 0.67% and Canada’s 10-year Government of Canada bond (CGB) dropping to 0.54% from 0.55%. Oh, there might be blips to the upside but, overall, interest rates appear destined to remain low, for the governments at least, for some time.
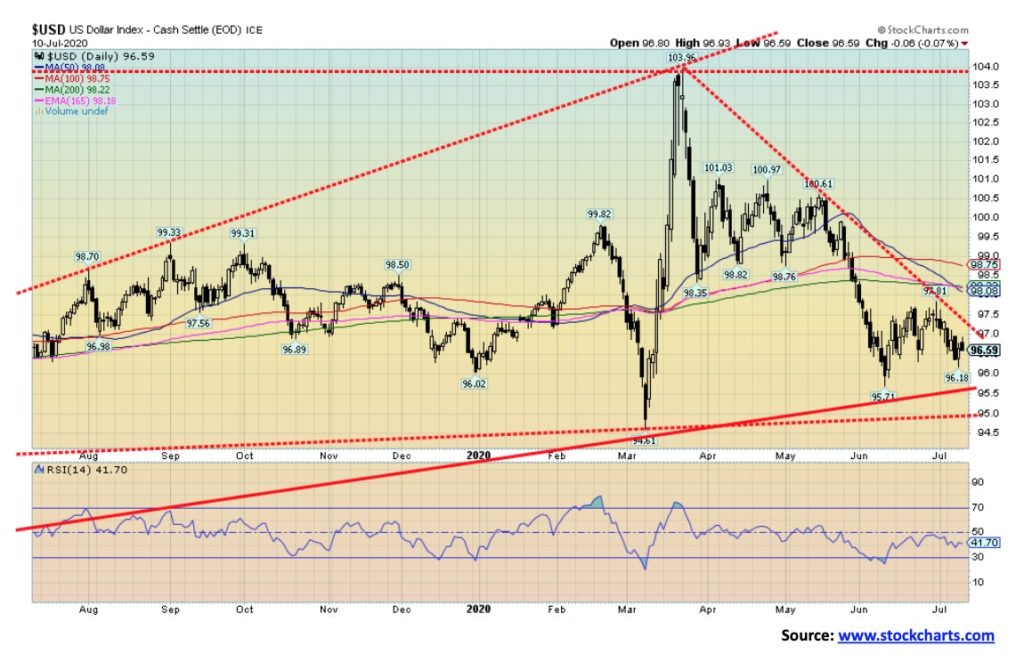
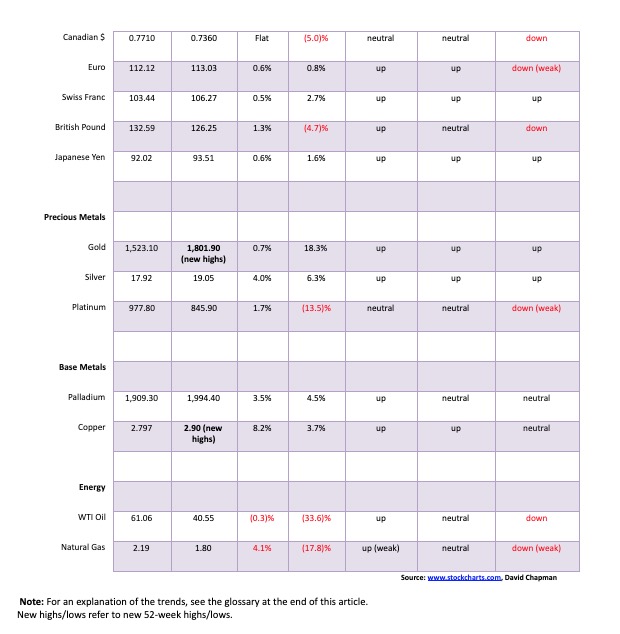
The US$ Index fell 0.7% this past week as the coronavirus count in the U.S. kept on rising. The major beneficiary appears to have been the pound sterling as it rose 1.3%. The euro gained 0.6%, the Swiss franc was up 0.5%, the Japanese yen gained 0.6%, while the Cdn$ was flat. The US$ Index continues to look bearish, but it still needs to break under 95.50 and especially under 95 to suggest a sharp decline. Rebounds seem to come out of the blue; Thursday’s action suggested we might have another temporary low, given the day saw new lows, then we saw an upside reversal and a higher close. Except it failed to follow through on Friday. So, this may be short-lived. Resistance is seen at 97 and a break above that level would suggest a move back up to 98 and even to 99. A rise in the US$ Index would be negative for gold, although gold has shown some propensity of late to rise even as the US$ Index rises. The last high was at 97.81 so that should act as resistance while the last low was at 95.71 and it is now an area of support. Overall, fiat currencies continue to look poor as shown by gold rising to record highs or once again close to record highs in a number of the major currencies.
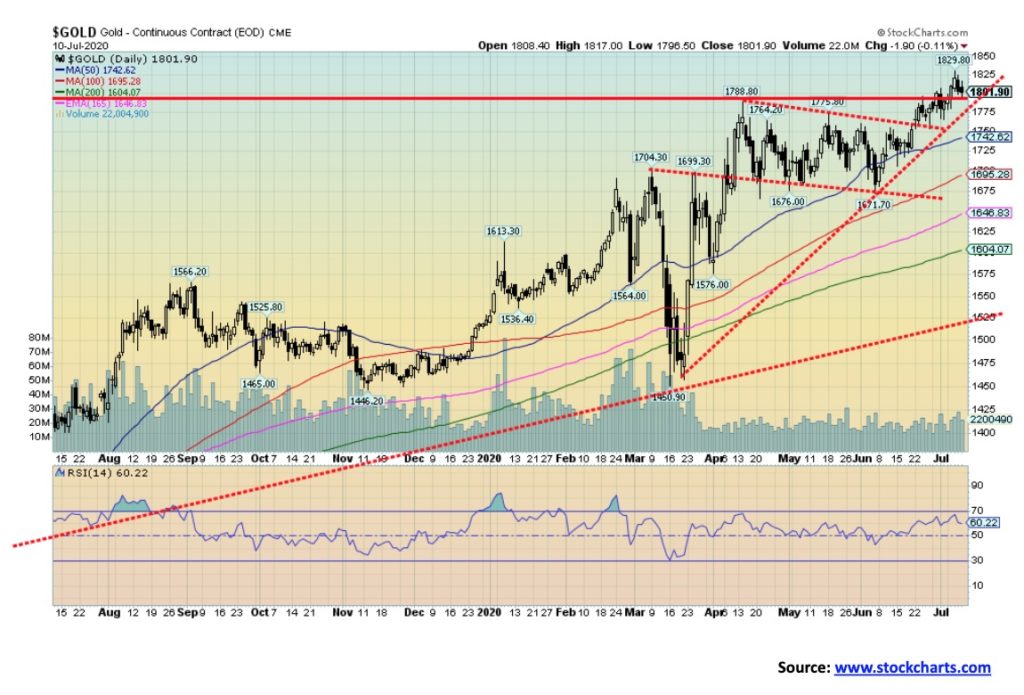
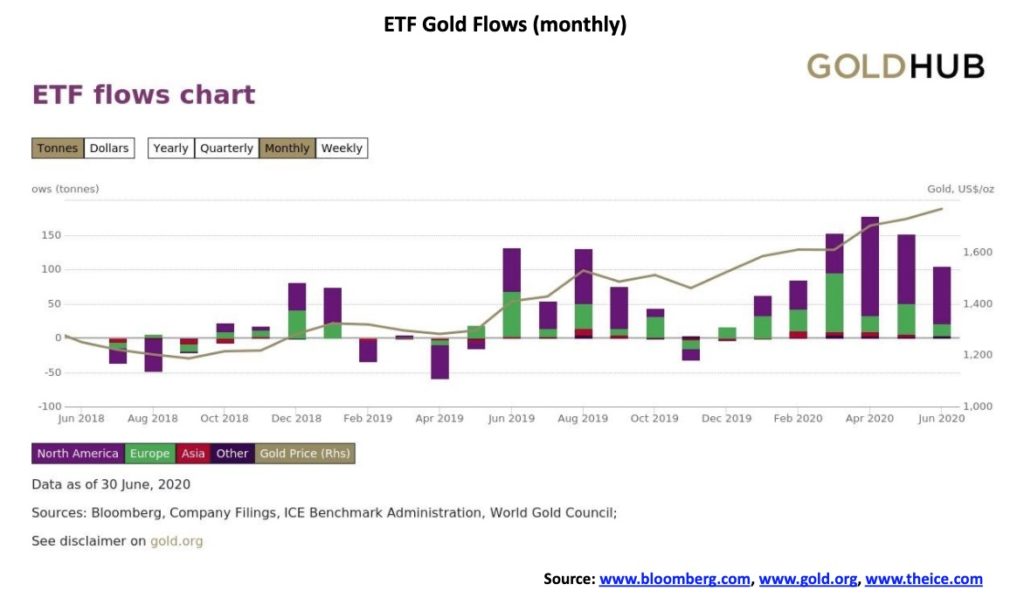
Once again, gold made new 52-week highs, hitting $1,829 as it rose 0.7% this past week. Gold is now up 18.3% on the year. In breaking through $1,800 gold took out another milestone—the 2012 high of $1,798. And we finally broke above $1,800 which had faced considerable resistance because of the importance of the point. But the fight isn’t over as gold was pushed back to $1,801 by week’s end. Gold ETFs have been seeing record inflows, with June receiving 104 metric tonnes or $5.6 billion of fresh funds. For 2020, flows now total 734 metric tonnes and $39.5 billion. Still, in the overall big picture the inflows into gold ETFs remain small compared to the global stock and bond markets.
Gold hit a record high in Japanese yen this past week and is just short of record highs in Canadian$, pound sterling, euros, and Swiss francs. Gold has already hit record highs in numerous other lesser currencies. It proves once again that gold protects against currency devaluation.
While gold was up 0.7% this past week, silver rose 4%, and platinum gained 1.7%. Of the industrial metals with precious metals attributes, palladium gained 3.5% and copper was up 8.2%, hitting fresh 52-week highs. The gold/silver ratio closed at 94.6. A break under 92 could send the gold/silver ratio lower. We’d love to see it back at 70 at least.
Despite the gains, we continue to read bear reports for gold so it is always fair to report them lest we become blindly bullish. We are very aware of our 31-month cycle for gold. It last came in August 2018 at $1,167. The next one is due in April 2021 +/- 5 months. The 2018 low was only the first one from the significant December 2015 low. The December 2015 was, we believe, a 7.83-year cycle low. That is next due around October 2023 +/- 10 months. We are also looking for the 23–25-year cycle low, last seen in 2001, so it is due around 2023–2025. That tells us the peak of this cycle could be quite important. We still see gold setting new highs as we continue to target $1,950 as a minimum. It could go even higher, towards $3,000 as some have forecast.
As long as gold remains above $1,750 on any pullback, we should be okay. The major break zone remains at around $1,675. The 200-day MA is currently at $1,604 and there remains long-term uptrend support down to $1,525. Given that we have taken out all of the highs of 2018, 2016, 2013, and 2012, the odds favour us taking out the highs of 2011 at $1,924 before this is finished. But we warn against getting too bullish, as pullbacks will occur and they could be sharp and swift. Gold stocks remain cheap vs. gold. Despite our words of caution, this gold market could still end in a blow-off move. Blow-offs are spectacular and it is in this phase that investors forget to take profits, blinded as they are by the spectacular rise. We certainly saw that in 1979 and to another extent in 2011. But there is lots of reason to own gold right now in this era of political, currency, and economic instability and uncertainty.
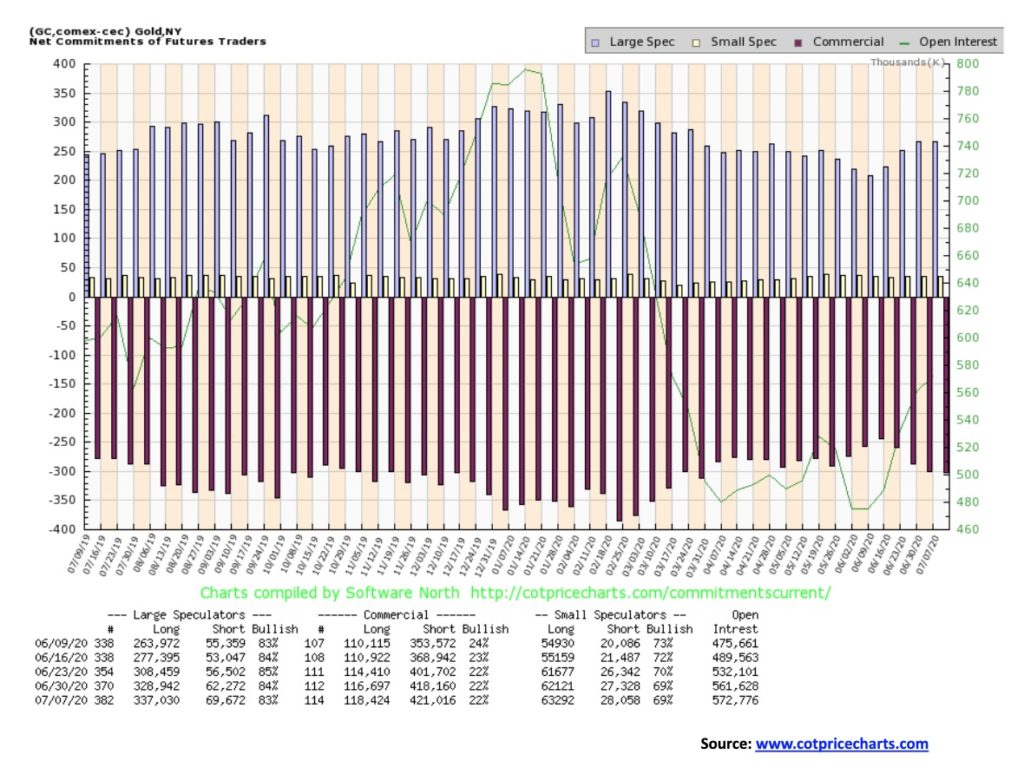
The gold commercial COT was steady this past week at 22%. That is a bearish position, but we have in the past seen gold keep on rising despite the negative COT. Long open interest actually went up almost 2,000 contracts while short open interest also rose about 3,000 contracts. The large speculators COT (hedge funds, managed futures, etc.) actually slipped to 83% from 84%. That was despite a rise of roughly 8,000 contracts for long open interest, but short open interest was also up by over7,000 contracts. That’s interesting considering the rise in price. But this COT report only goes to July 7. Next week’s COT will go to July 14. Open interest rose in line with the rise in gold prices.
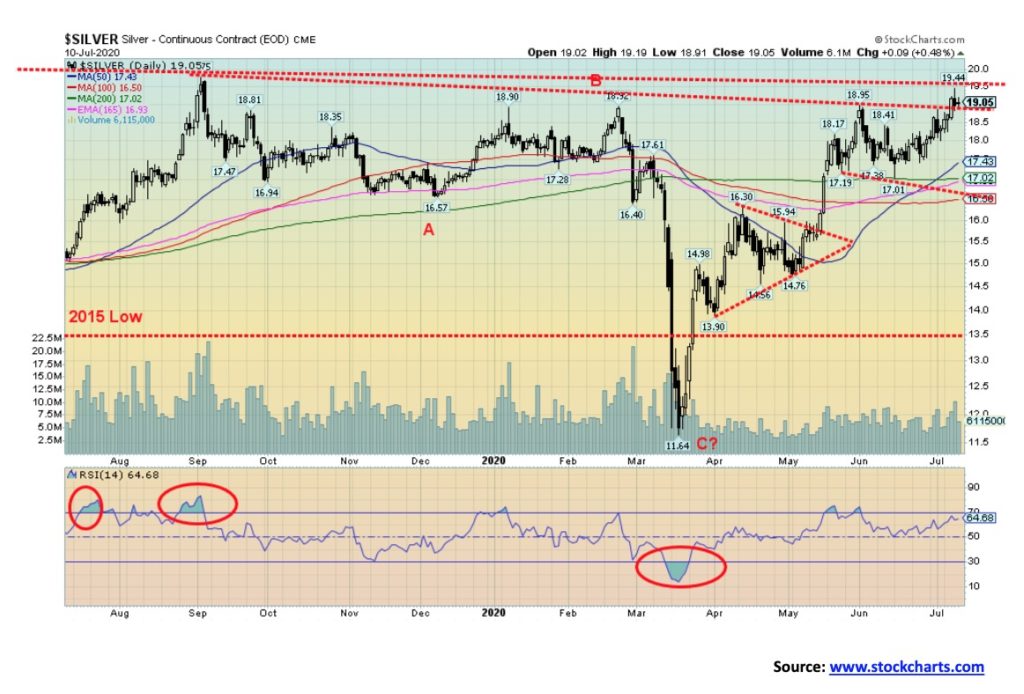
Finally, it happened. Silver prices jumped through $19, hitting a high this past week of $19.44 before settling back and closing at $19.05 up 4% on the week. Still, with gold setting new 52-week highs, silver’s failure to do the same is an ongoing negative divergence which continues to be of some concern. The bears continue to say silver is about done, having rallied 640% from its March low of $11.64. With an RSI at 64 we would not consider silver overbought here, although arguably it is diverging with the earlier high where the RSI was higher over 70. There remain considerable barriers for silver prices, even as it has picked up a bit lately. The 52-week was seen last September 2019 at $19.75. July 2016 saw silver hit a high of $21.23. The rebound high in 2013 following the collapse was seen at $25.12. Both those levels remain distant. The 2011 high of $49.28 is but a distant memory. Gold has long taken out its 2019, 2016, and 2013 rebound high. It has now also taken out its 2012 high. All that remains is the 2011 high. So, the divergence between gold and silver continues to be a major concern. That is, until it is resolved one way or the other. Fundamentals remain strong for silver. To the upside, taking out $19.75 firmly would set our sites on the $21.23 2016 high. To the downside, the major line in the sand is now at $17. A decline under $18 would be negative and suggest further declines to $17. Silver is terminal, under $16.50.
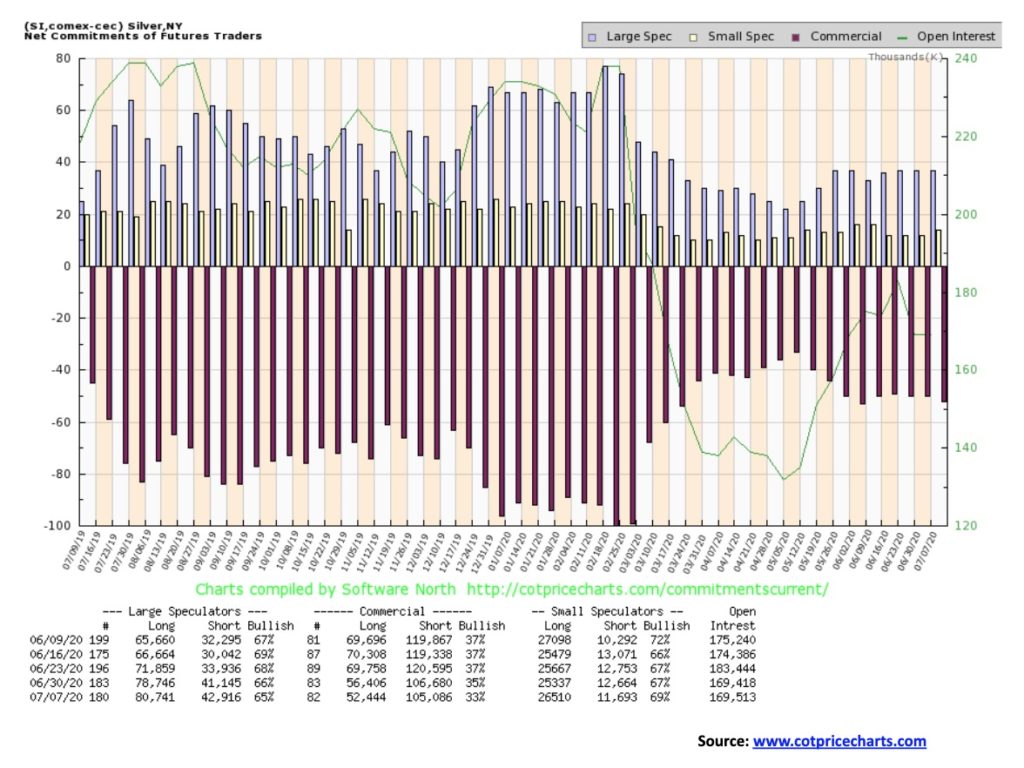
The silver commercial COT slipped a bit this past week to 33% from 35% as silver prices climbed over $19. Long open interest dropped roughly 4,000 contracts while short open interest also fell off about 1,500 contracts. Longs falling indicates profit-taking. The large speculators COT was also off to 65% from 66%, which is surprising given the rise over $19. While long open interest rose roughly 2,000 contracts short open interest was also up almost 2,000 contracts. Total open interest was flat which is interesting on a rising week for silver prices. Contraction would be a bit bearish while rising open interest would have been bullish. This week’s COT leaves us mixed.
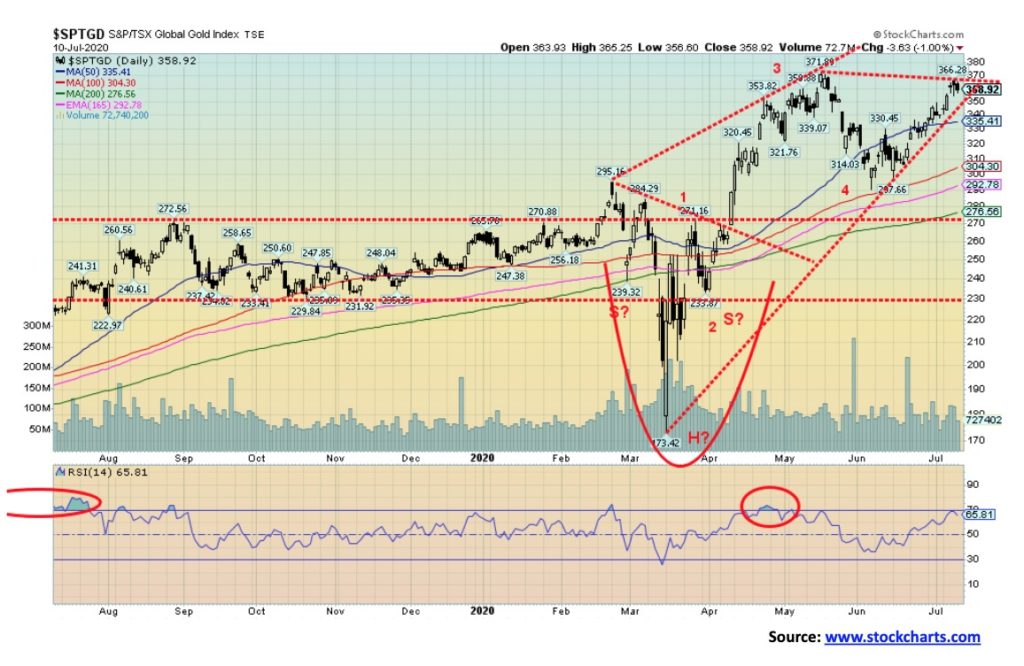
Gold stocks enjoyed a good week. The TSX Gold Index (TGD) gained 5.6% and is now up 37.4% on the year while the Gold Bugs Index (HUI) made new 52-week highs, gaining 6.8% and is now up 28.8% on the year. That the TGD did not make new 52-week highs while the HUI did is an unresolved divergence. As we have so often noted, the averages need to confirm each other. With a high this past week at 366, the TGD was just shy of the previous high of 372. The all-time high was seen in 2011 at 455. We note the RSI did not get over 70, a level usually associated with an overbought market. So, in theory, we have room to move higher even after a pullback. A firm breakout over 372 could target the TGD to 445 which is just shy of the all-time high. Support is seen down to 335 and pullback to that level would be considered normal. Below 330 a drop to 300 could get underway. Major support is at 275. 10%, even 15%, in a bull market for gold stocks is not unusual. The first sign of a little bit of trouble is under 350. Volume has tailed off a bit. We still don’t believe the major public or funds are invested in gold stocks. It could take a bit more to get their attention, especially if the stock market were to start to fall and the gold stocks kept rising (and gold and silver as well).
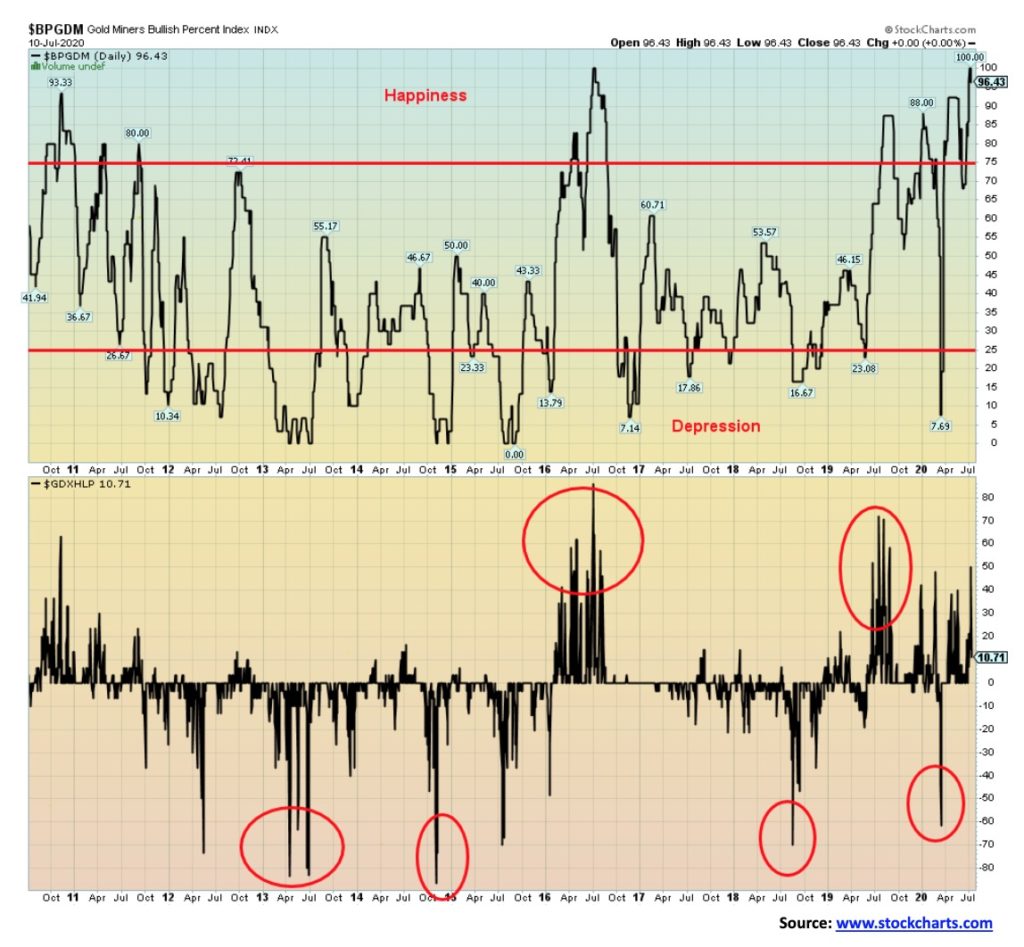
Are gold stocks stretched to the limit? The Gold Miners Bullish Percent Index (BPGDM) recently hit 100 which is as high as it has ever been over the past number of years. The BPGDM last hit 100 in July 2016. From July to December 2016 gold prices fell over $250 or 18% while the TSX Gold Index (TGD) dropped almost 40%. If there is one small consolation, it is the Gold Miners new highs-new lows Percent Index (GDXHLP) has not reached the heights seen in 2016 nor even seen in 2019. The BPGDM has eased a bit this week, dropping back to 96.43. Still, it’s a big cautionary note for the gold miners right now as it is signaling a potential pullback. As we have noted, the fundamentals for gold and, by extension, gold stocks still appear strong but the technicals need a rest to ease the super bullishness.
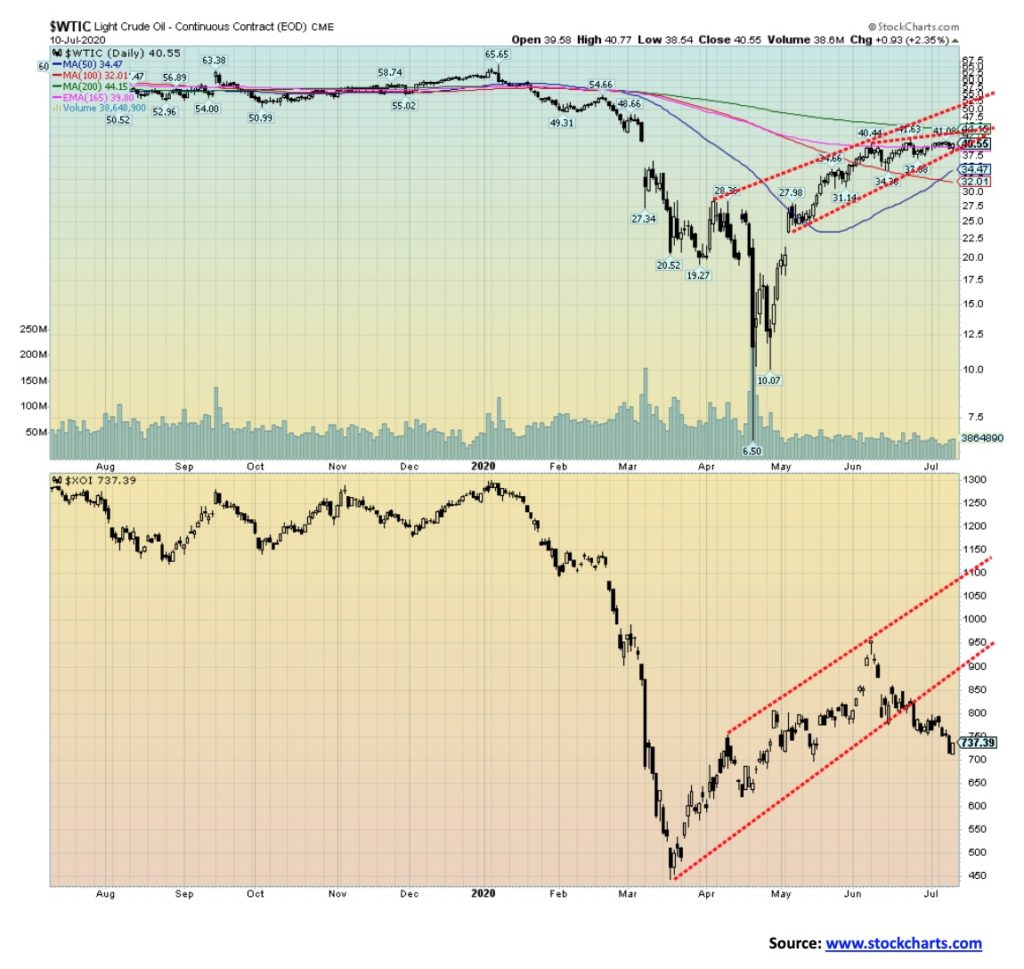
WTI oil prices continue to hover around $40. They are poised to either break out or to break down. Looking at the energy stocks that fell sharply this past week, the betting appears to be on a breakdown. WTI oil was off a small 0.3% on the week while natural gas (NG) recovered, gaining 4.1%. The energy stocks? Not so good, as the ARCA Oil & Gas Index (XOI) fell 5.0% and the TSX Energy Index (TEN) dropped 3.6%. The XOI pictured above appears to now be in breakdown mode. Will WTI oil soon join it?
The sharply rising coronavirus numbers are putting out a cautionary sign for oil prices. However, the IEA is now talking out of both sides of its mouth with concern over the rising coronavirus but also noting that demand could rise 400 thousand bpd due to economies opening up particularly in China and to some extent India. Rising demand in India would be a surprise given their rising coronavirus numbers and millions unemployed. Famine could hit even India. A slight drop in supply of just 2 million bpd in June tightened supply. Reports that the COVID hit more than a few refineries in Texas added to supply woes as they were forced to suspend operations.
Helping supply is news that Libya has lifted a force majeure on its oil exports. That could send more supply on the market. Libya has been gripped in a civil war with factions backed by the Great Powers. Pipelines are under pressure as, once again, as court rulings are negatively impacting Keystone and the Dakota Access lines and the Atlantic Coast pipeline was scrapped by Dominion Energy and Duke Energy. If elected president, Biden has threatened to shut down Keystone for good. Pipelines have been major flash centers for environmentalists over the past decade. Pipeline ruptures don’t help. Trans Mountain in Canada also remains under pressure.
Note that WTI oil has stalled just under the 200-day MA. Breakdown is seen under $32 and especially under $20. Only a firm breakout over $45 could change the growing, potentially negative outlook for oil.
—
(Featured image by Markus Winkler via Pixabay)
DISCLAIMER: This article was written by a third party contributor and does not reflect the opinion of Born2Invest, its management, staff or its associates. Please review our disclaimer for more information.
This article may include forward-looking statements. These forward-looking statements generally are identified by the words “believe,” “project,” “estimate,” “become,” “plan,” “will,” and similar expressions. These forward-looking statements involve known and unknown risks as well as uncertainties, including those discussed in the following cautionary statements and elsewhere in this article and on this site. Although the Company may believe that its expectations are based on reasonable assumptions, the actual results that the Company may achieve may differ materially from any forward-looking statements, which reflect the opinions of the management of the Company only as of the date hereof. Additionally, please make sure to read these important disclosures.


Bitcoin Stalls Near $60K as Strategy Moves, ETFs Outflow, and EU MiCA Rules Take Effect
Bitcoin hovers near $60,000 with ETF outflows, while Strategy boosts reserves, sells BTC, and raises dividends to reassure investors. Ethereum...


Cannabis Dominates Global Drug Use: Trends, Risks, and Shifting Markets
Cannabis remains the world’s most widely used illicit drug, with 256 million users in 2024, surpassing all others combined. Growth...


Italy Approves First Hydrogen-Powered Train for National Rail Network
ANSFISA has approved Italy’s first hydrogen-powered train, the Alstom HMU214, for use on the Brescia–Iseo–Edolo line. Capable of 140 km/h,...


Cotton Market Weakness Persists Despite Brief Rebound
Cotton prices fell to new lows last week before a modest rebound. USDA data shows crop conditions remain worse than...


Eli Lilly Hits $1 Trillion Valuation Amid Strong Bullish Momentum
Eli Lilly stock hit a record high, surpassing $1 trillion market value after strong product demand. Shares surged over 7%,...
 |
|
 |  |
 |
|
-

 Cannabis2 weeks ago
WNBA Removes Cannabis From Banned Substances List in New CBA
-
 Markets21 hours ago
Cotton Market Weakness Persists Despite Brief Rebound
-

 Cannabis1 week ago
Trulieve NYSE Listing Signals New Era for Global Cannabis Industry
-

 Africa2 weeks ago
Remote Work Reshapes Sales Management: Key Lessons for Moroccan Leaders