Featured
The discrepancy between Wall Street and Main Street doesn’t make sense
Wall Street (stocks) are soaring while Main Street suffers with 40 million unemployed in the U.S. and 3 million unemployed in Canada. It doesn’t make a lot of sense. With trillions being thrown into the financial system through QE and direct payments all that money goes somewhere. But it is not going into Main Street, it’s going into Wall Street and that is being reflected in the stock market.
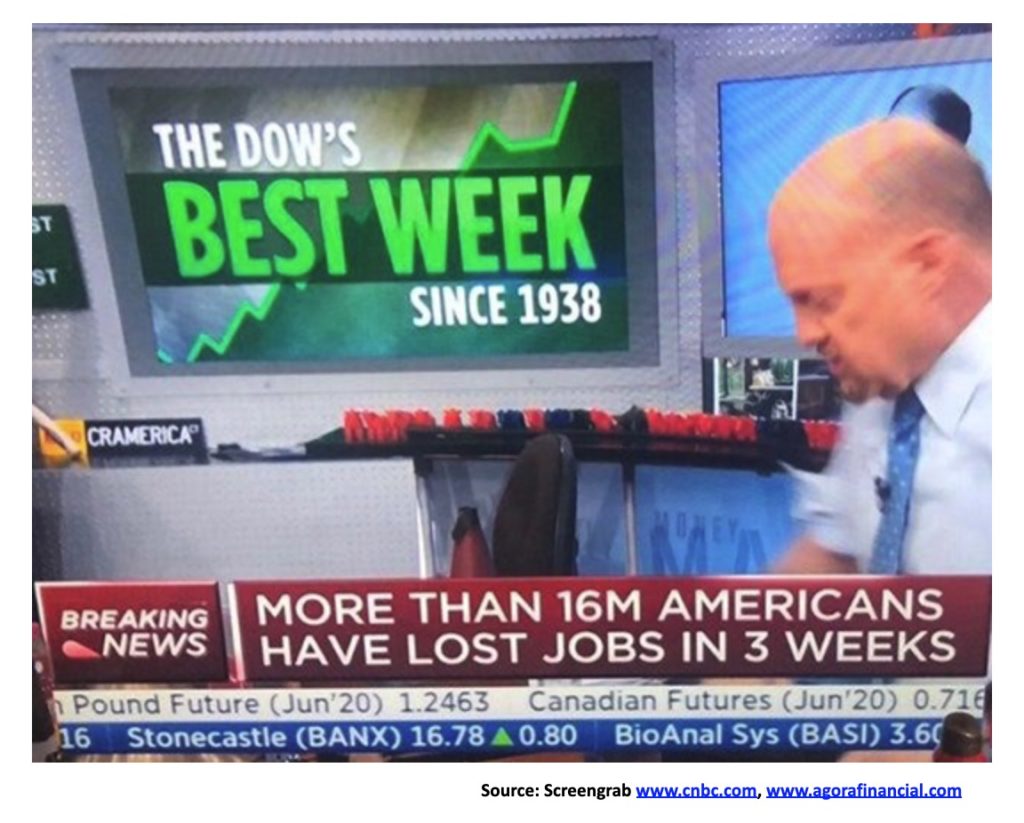
We couldn’t help but notice the disconnect. We saw the below screengrab at Agora Financial and found messaging so completely at odds with each other that we felt we had to show it. Reality bit with Friday’s release of the April employment numbers for both the U.S. and Canada. They weren’t pretty (featured in our Chart of the Week). As to the Dow Jones Industrials (DJI), well, it might be the old adage of throw gobs of money at it and thanks to QE, it might go up.
What it made us wonder is, where has all the money gone as a result of bailing out the 2008 financial collapse and where will all the money go to bail out the COVID-19 collapse? On May 6, 2008, the U.S. national debt stood at $10.1 trillion. Today it is $25 trillion and rising: an increase of $14.9 trillion. Total U.S. debt (corporations, financial, consumer, and government) stood at $50.2 trillion. Today it is $77.2 trillion and rising, an increase of $27 trillion. GDP, on the other hand, was $13.8 trillion. Today it is $21.4 trillion and falling. An increase of $7.6 trillion. In other words, it took $3.55 of debt to purchase $1 of GDP during that 12-year period. How much debt will it take to pull the economy out of what will be the biggest contraction since the Great Depression?
But there is more. The Fed’s balance sheet exploded during this time, rising from $0.9 trillion in May 2008 to $6.7 trillion today, an astounding increase of $5.8 trillion or 644%. The S&P 500 was at 1,418 on May 6, 2008 and today it is at 2,882. The Fed balance sheet went up $6.44 while the S&P 500 was up $1.03 and GDP up a mere $0.55. Where did the money go? Not into the economy. It went into the stock market. Since August 28, 2019, when the Fed’s repo program was underway, the Fed balance sheet went up $0.76. Yes, the S&P 500 has stood still, falling slightly, a mere $0.002. GDP has also fallen slightly down $0.008. But if there hadn’t been all that money flowing from the Fed primarily on to Wall Street would the S&P 500 have done as well as it has? Probably not. It didn’t hurt as well that firms were buying back their own shares, adding what one analyst calculated adding as much as 1,000 points to the S&P 500.
It is projected that if QE and borrowing continue at the current pace, by 2024 the U.S. National debt could reach $42.3 trillion while total debt would rise to $92.1 trillion. As to GDP, well, it will go in the opposite direction, down to $18.1 trillion. But that’s assuming we remain on roughly the same course. The Congressional Budget Office (CBO) and the Office of Management and Budget (OMB) are more optimistic, of course. National debt of $28 trillion from the CBO and $28.2 trillion from the OMB, while GDP will rise to $25.2 trillion according to the CBO and $26.8 trillion from the OMB. The reality? Possibly somewhere in between the two forecasts?
Governments including the U.S., Canada, the EU, China, Japan, and more have rolled out the most massive recovery plan ever seen. Interest rates lowered, massive amounts of funds injected into the financial system through borrowings and QE, thus preventing a seize-up in the credit markets and providing some sort of cushion to millions of individuals and businesses. Right now, no one seems too perturbed about the size of the deficits or the amount of money being doled out. But what about later? There is a collective loss of confidence, causing a collective disaster, as people lose their jobs, people stop spending, and, in response, businesses lay off employees and close their doors. Rinse, repeat.
The U.S. plans on issuing a record $2.999 trillion of debt in the April/June quarter. The U.S. plans on reopening for the first time since 1986 the 20-year note. The deficit for 2020 is estimated to be $3.8 trillion. The big question is—who is going to buy all this debt? How much will the Fed be buying? And will China buy any? As to China, probably not. According to the latest figures available (February 2020), China’s share of U.S. debt has actually fallen by $38 billion to $1.092 trillion over the past year. Japan has picked up the pace, increasing their holdings by $200 billion to $1.268 trillion. The U.K. has added $101 billion to $403 billion and is the third largest holder. In total, debt held by foreigners has increased by $692 billion.
Bizarrely enough, the U.S. has threatened to default China’s share of the debt as a part of their spat over who caused the coronavirus. Would Trump do it? We would guess not, as hopefully saner heads would prevail as even a selective default is effectively a default to everyone and the U.S. treasury market would be sent into a black hole. The U.S. dollar could lose its reserve status and the global financial system could collapse. The U.S. Constitution also forbids it.
However, it is believed they could freeze Chinese assets or even seize them or not pay the interest to China but pay interest for everyone else. China apparently has some 600 metric tonnes of gold stored with the Federal Reserve Bank of New York. Would the U.S. attempt to seize it? Numerous countries hold gold with the NY Fed as result of WW2 where holding their gold in the U.S. was considered safe from seizure in war torn countries in both Europe and Asia.
In other words what this would be is a synthetic default setting aside thoughts of outright seizure. But two could play that game and U.S. assets in China could be frozen or seized. We don’t have recent figures but Chinese direct investment in the U.S. had fallen to a mere $5.8 billion by 2018, down 88% from 2016 while at the same time U.S. direct investment in China stood at $117 billion. U.S. corporations would, we suspect, not be pleased. With supply chains already disrupted it is not just a snap of the fingers to reconstruct them elsewhere. Bringing them back to the U.S. could also be the most expensive route. However, other foreign countries might benefit. China, however, has considerable influence globally, so re-building supply-chains in other foreign countries might not be that easy either.
The world is trying to re-open—cautiously, a bit at a time. No, that doesn’t satisfy those who thought shutting the economy down in the first place was the “height of stupidity.” A small but determined minority have objected to the shutdown from the beginning and have recently accelerated their attacks as, for example, showing up at the State Capital of Michigan (and elsewhere) masked and armed. But polls show that the lockdown, despite its hardships, seems to have wide support.
A recent poll here in Canada showed that 80% of Canadians “strongly supported” or “somewhat supported” the measures taken primarily by the provinces to limit the spread of the COVID-19. Even 61% agreed that “the rules have been effective but should remain in place a while longer.” Some 66% willingly accepted the rules while another 25% grudgingly accepted them. Seems that only 5% would neither accept or follow the rules. Eight percent were “somewhat opposed” to the lockdown while 7% “strongly opposed” the lockdown.
While these numbers were for Canada, some recent numbers we saw for the U.S. were largely in line with the Canadian poll where at least 2/3rds polled approved of extending lockdowns. Yet it is the “strongly opposed” who appear to have the high profiles on the internet or in demonstrations attacking the health authorities and politicians who went along with the health authorities and WHO. As well, they strongly believe that China is behind the pandemic and, in particular, are highly supportive of Trump attacking China and possibly putting sanctions or tariffs on them.
A “war” with China over trade or even a new “cold” war is not a very good idea. It is fraught with peril. As we have often pointed out, no one wins in a trade war. Accusations that China failed to contain the coronavirus from a lab in Wuhan is disingenuous when the U.S.’s own intelligence agencies counter the argument as there is no proof of that being the case. The risk is now that the trade truce between China and the U.S. comes apart. With signs that the U.S. economy is falling into a deep recession (depression?) fighting a trade war with China is not a winning proposition. Yet, oddly, both political parties are equally “hawks” versus China. But with U.S. business already reeling from the shutdowns related to the COVID-19, fighting another trade war with China would be very costly. The stock market would most likely also not be pleased. We saw how the stock market reacted in 2018 to the start of the trade war.
Oh yes, the stock market. After falling as rapidly as it did, losing almost 40% in just over a month, it turned on a dime and raced right back up, gaining almost 35% until it settled down over the past week. Sounds great, except there is one problem. This is a benefit to, some would say, Wall Street, but millions of individual investors benefit as well through their brokerage accounts—if they didn’t pull all their money out at the recent lows as some did. But over on Main Street it is a different story. Main Street is reeling from record unemployment, bankruptcies are starting to mount, and hundreds of small businesses are on the brink of never returning. A dramatically changed landscape as the lifting of the lockdown starts.
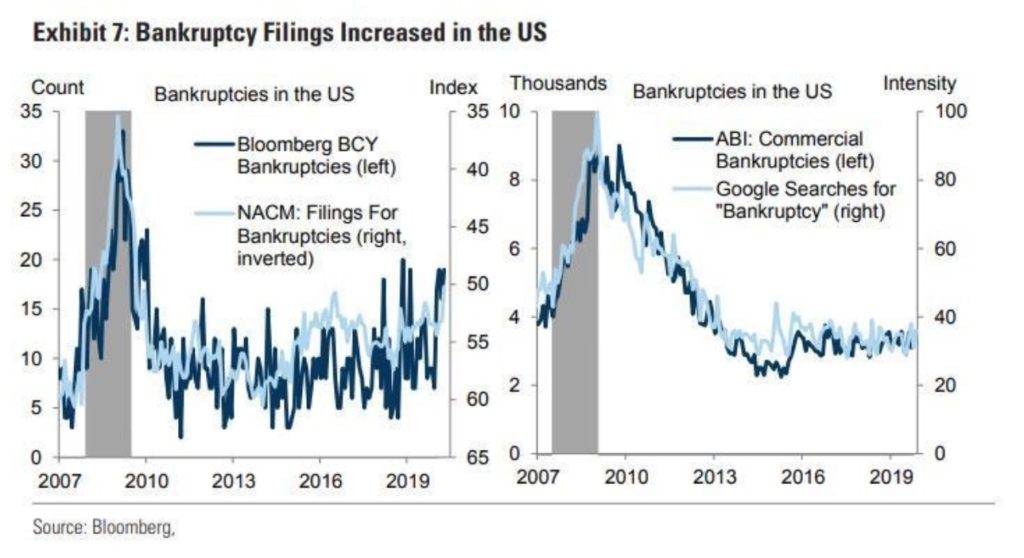
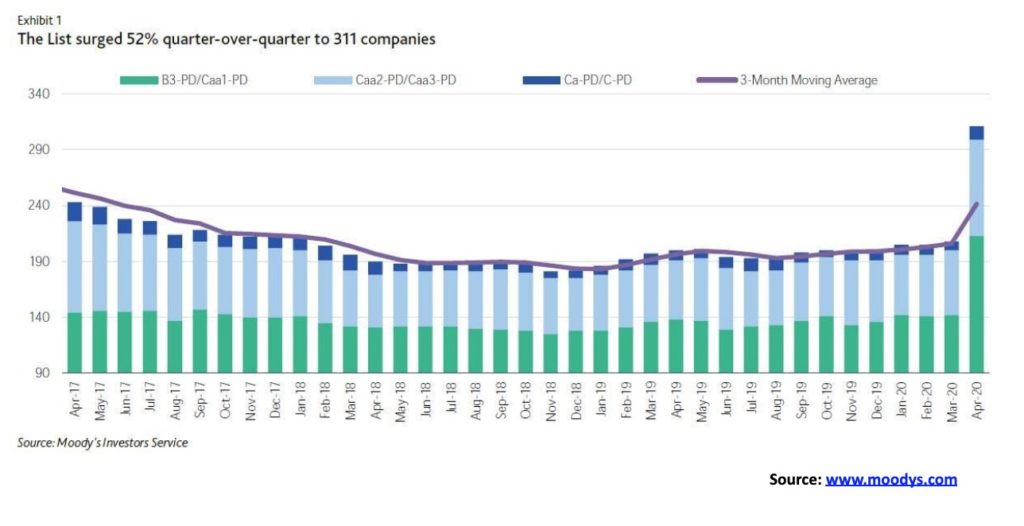
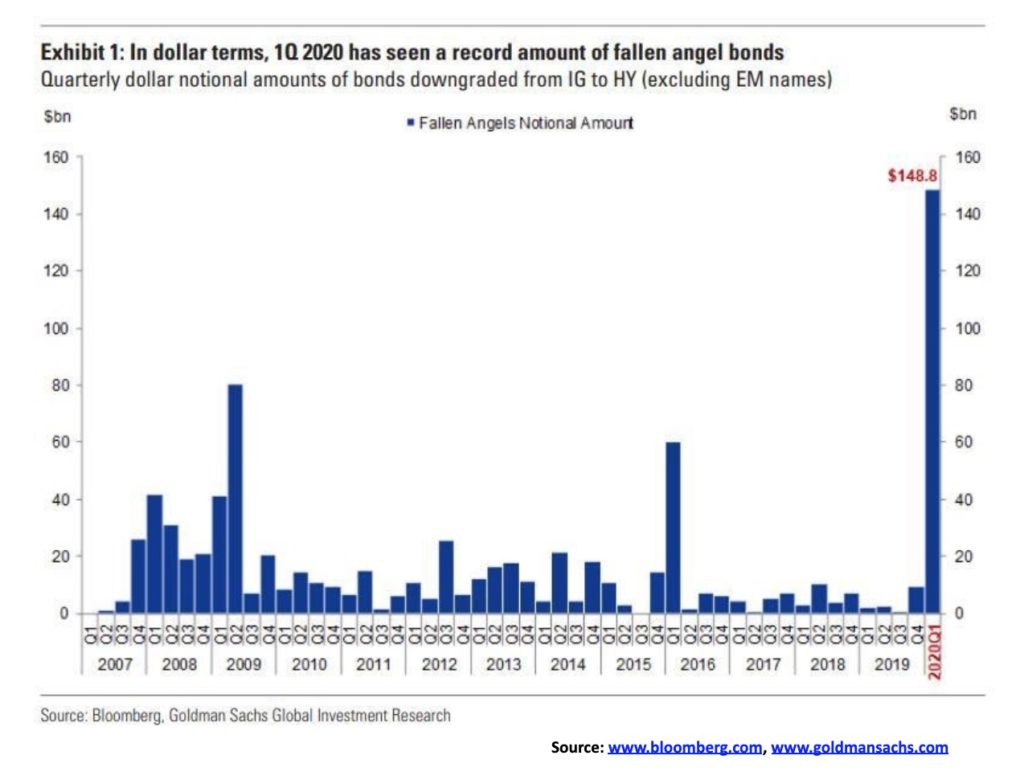
But what if opening up results in a massive surge of cases and deaths? Lockdown again? Already the pain is beginning to show with a rising tide of bankruptcies or rumours of them. This week we saw major retailer J. Crew go under, followed by a major department store Neiman Marcus. Behind them lie more major department stores that were already hurting from the 2008 collapse—Macy’s, J.C. Penney, and maybe even the Bay. Others rumoured to be on the brink include giant car rental company Hertz. Moody’s recently released their report called “Negative and Lower List” has soared already to its highest level ever at 311, surpassing the peak of 291 seen during the 2008–2009 financial crisis. In Q1 a record number of investment grade bonds have been downgraded to junk. And it’s early. The worst is yet to come. Thousands more bankruptcies are anticipated and homelessness is starting to rise as those unable to pay their rent are evicted.
With the threat of a credit crisis rising, unemployment (as not all jobs will come back and thousands, even millions, could be gone for good), threat of a U.S./China trade war or worse, the stock market sits in a precarious position. The stock market has shot up primarily because of the huge monetary stimulus provided by the Fed. Buying corporate bonds allows the corporations to finance their debt with no risk to themselves. The result over the past few weeks has been a surge of corporate offerings as they raised $560 billion. And, given the negative rates being paid in the EU and Japan, the U.S. bond yields are attractive. More funds flow in, pushing up the U.S. dollar and spiking the stock market. However, if the U.S. moved to negative rates as is rumoured, those funds might flow elsewhere as foreign investors would be paying for the privilege of owning U.S. treasuries and losing on the dollar exchange rate as the U.S. dollar would most likely fall.
But the disconnect between Wall Street and Main Street is a dangerous schism. As well, the advance has been very narrow. Five stocks—Microsoft, Alphabet (Google), Facebook Apple, and Amazon—have led the way and are now 20%+ of the S&P 500. The S&P 500 is now back where it was in June-September 2019 before the final thrust to the upside and the February 2020 high. It was overvalued then and it’s overvalued again. A fall is more likely than a continued rise.
The world needs a vaccine to stop this. But vaccines take a long time and there is no magic bullet, despite innumerable suggestions and recommendations, including scams from some quarters. Taiwan seems to have gotten it right. But what is required is more testing, more tracking and tracing, more and better border screening, temperature-taking, better knowledge of where the virus is and better knowledge on how to control it. Some of it might, however, result in giving up some freedoms and privacy we take for granted. It works in Taiwan. But will it work here?
Tilt! Off the rails! Oops! As was expected, the U.S. nonfarm payrolls and unemployment went into the stratosphere in April. The nonfarm payrolls for April saw a job loss of 20,500,000. Yes, 20,500,000. The good news? It was better than the expected 22,000,000. However, the previous month’s nonfarm payrolls was revised upwards to 807,000. Never in the history of the U.S. have they seen a job loss of this magnitude. The series goes back to 1939. The official U3 unemployment rate was 14.7% as reported by the Bureau of Labour Statistics (BLS). That is also the highest ever reported since that series was started in 1948. But it falls short of the 25% + at the height of the Great Depression.
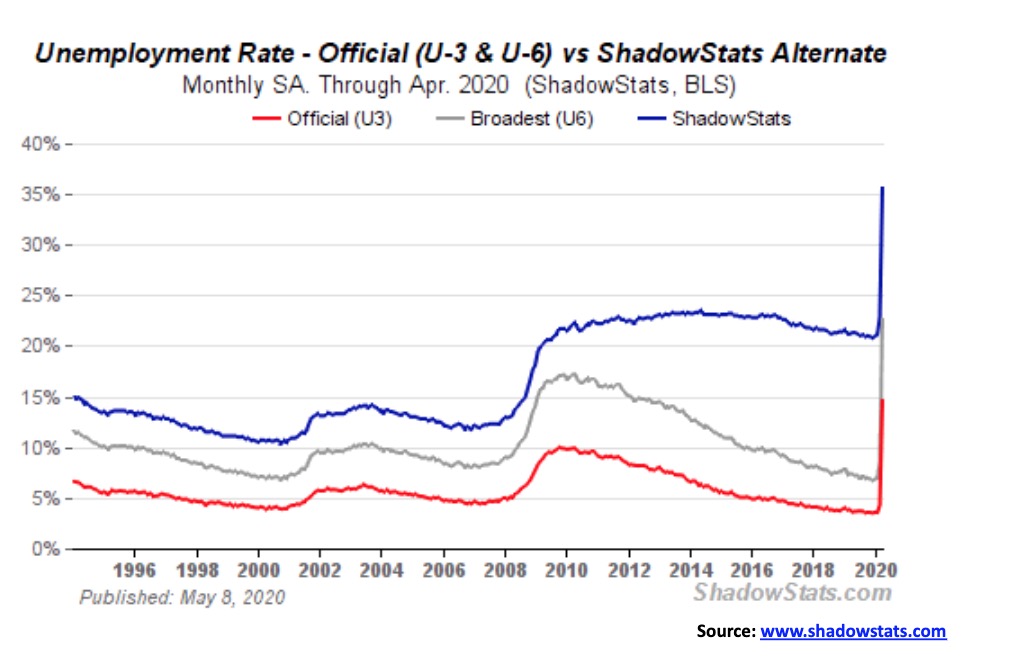
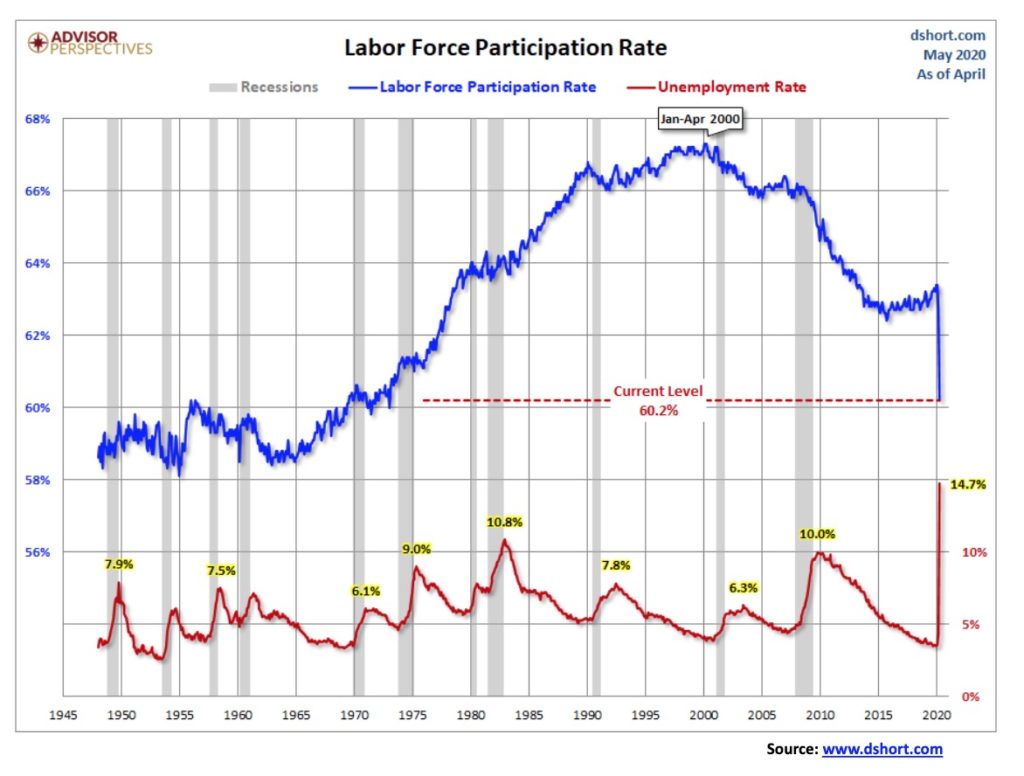
The market had expected an unemployment rate of 16%. The rate would have been higher except the labour force participation rate fell to 60.2% vs. 62.7% and the civilian employment population ratio fell to 51.3% from 60.0%. Both are back at late 1960s levels before women entered the labour force in greater numbers (see chart below).
John Williams of Shadow Stats has noted in his most recent report dated May 10, 2020 that “The Bureau of Labor Statistics (BLS) Disclosed Erroneous Unemployment Surveying for a Second Month • About 7.5 Million People in the April Household Survey Were Misclassified as Employed Instead of Unemployed, per the BLS. Headline April U.3 Unemployment at 14.7%, Should Have Been 19.5% • The BLS Had Disclosed the Same Surveying Error Last Month; Where Headline March 2020 U.3 Was 4.4%, It Should Have Been 5.3% • Per the BLS, Headline Data Will Not Be Corrected: “To maintain data integrity, no ad hoc actions are taken to reclassify survey responses.” • Nonetheless, Headline April Unemployment Soared to Historic Highs from March: U.3 from 4.4% to 14.7%, U.6 from 8.7% to 22.8% and Shadow Stats from 22.9% to 35.4% • More Realistic, Those Same Unemployment Numbers, Corrected: U.3 from 5.3 % to 19.5%, U.6 from 9.6% to 27.7% and Shadow Stats from 23.7% to 39.6%”.
What these numbers reflect is that anywhere from 1/3 to 40% of the U.S. labour force is unemployed. That’s astounding. Those are depression numbers. Yes some of these jobs will come back, but millions of them could be lost for good. Unfortunately we don’t have comparable numbers for Canada but could it be far off here as well?
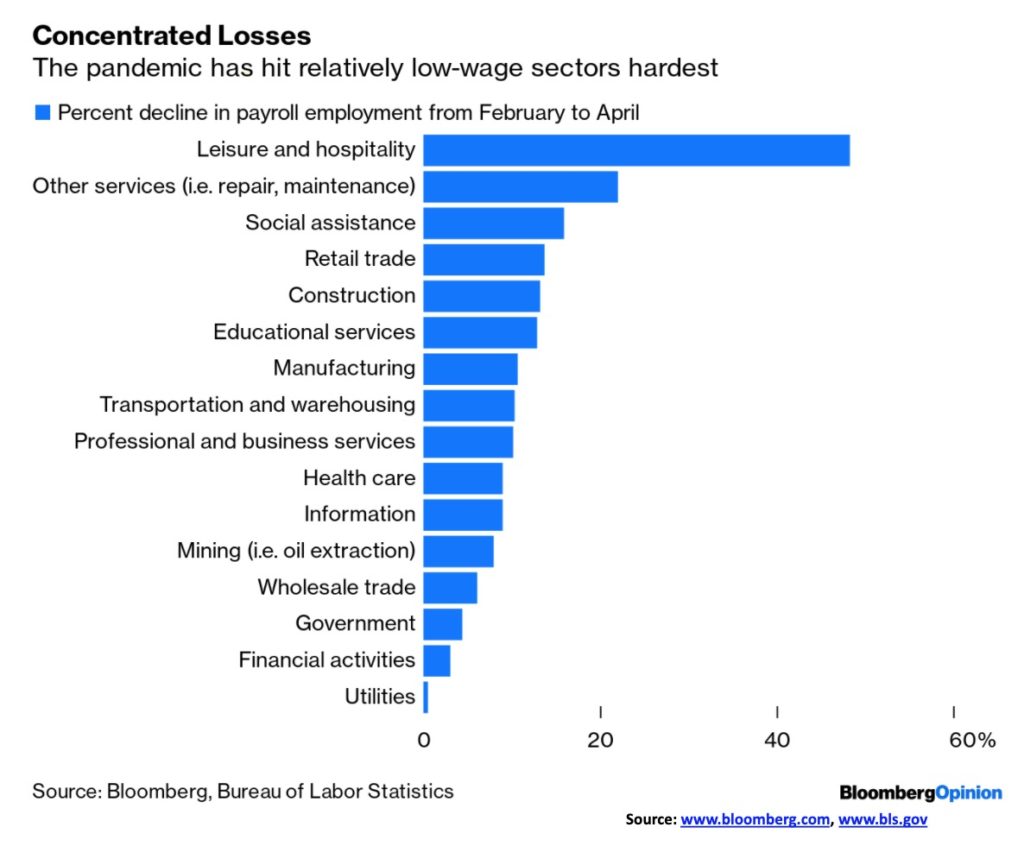
Leisure and hospitality took the biggest hit, losing 7.7 million jobs. Many of those jobs won’t be coming back. Food services and drinking establishments lost 5.5 million. As well, employment in the arts, entertainment, recreation, and accommodation took a hit. Even professional and business services lost 2.1 million jobs. Temp help fell 842 thousand. Retail trade was down 2.1 million and as retailers close their doors many of them won’t be back either. Manufacturing fell 1.3 million, but that was less than the 2.5 million expected and one of the prime reasons the nonfarm payrolls came in less than originally expected. Government employment fell 900 thousand and local government employment was down 801 thousand, primarily teachers. Construction dropped 975 thousand. The number working part-time for economic reasons reached 10.9 million. Those reported not in the labour force is now 114.0 million; however, 55 million are retirees and another 9.9 million are on disability. That’s up from 103.4 million last month and 96.8 million two months ago. The civilian labour force fell to 156.5 million in April, down from 162.9 million in March.
The question is, even when they open up, how many of these jobs will come back when thousands of businesses are closing their doors for good or declaring bankruptcy? A survey by the Society for Human Resources said that more than half of 375 firms surveyed expect they’ll be gone in 6 months. The huge job losses were not the result of an natural economic downturn but instead the result of purposeful shutdown. As expected, the report was terrible even if less bleak than some expected. The reality is, many of these jobs won’t be coming back unless a vaccine or an effective treatment is developed. People are nervous. They won’t be rushing out to the hairdresser, to the cinema, or to a restaurant. Estimates on permanently lost jobs could be up to 10 million.
The Canadian unemployment report was just as miserable as the U.S. report, although in some ways it was actually better. Canada reported an unprecedented drop in employment for April as a result of the coronavirus. Canada shed 1.99 million jobs in April, much less than what some had projected of losing 4 million jobs. Still, it is a record decline and when one adds the million lost in March Canada has shed almost 3 million jobs. Of the jobs lost in April, 1,472,000 were full-time and 522,000 were part-time. That’s now almost 2 million full-time jobs lost since February and over one million part-time jobs.
The unemployment rate rose to 13% which was well off the worst forecasts of 18%. But, as in the U.S. ,the number of people in the labour force fell. The labour force participation rate for April was 59.8% vs. 63.5%. That’s a significant drop and was a major reason why the unemployment rate wasn’t a lot higher. People just stopped looking, so effectively they are not counted as being in the labour force. As an example, take ourselves. Officially we are listed as retired and therefore not in the labour force. But we do provide a financial service and we are attached to a company Enriched Investing Inc. So in that respect we are in the labour force, but we’re not counted.
The R8 unemployment rate which includes the official unemployed plus involuntary part-timers plus discouraged workers and those waiting came in at 17.9% vs. 11.7% the previous month. The great hope as it is in the U.S. is that these jobs losses are temporary and somehow they will all come back in a month or so once things open up again. But people are conditioned as savings rates are rising, there will be considerable reluctance to go back into restaurants or even shop. Online shopping could become even more prevalent. And as with the U.S. the need for a vaccine or at least an effective treatment is needed to even begin to get things back to something resembling normalacy.
Some 7.6 million have applied for government assistance (CERB), but again, that is only temporary and recipients will still need to attempt to find work. But some 5.8 million are expecting to return to work at some point (they hope).
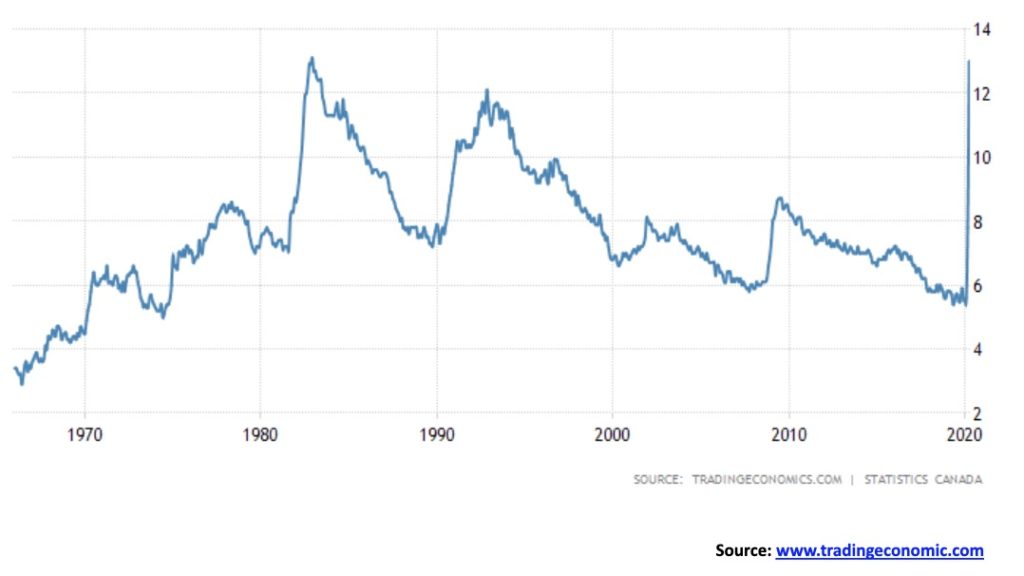
One positive thing was while the official unemployment rate of 13% was high it wasn’t a record. The record (so far, not counting the Great Depression) was a rate of 13.1% set in 1982. Next month may be worse.
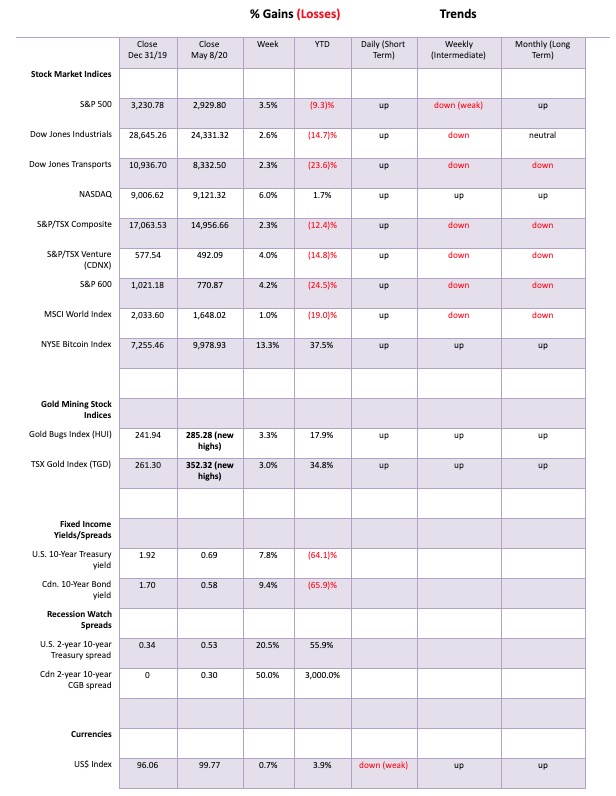
Who cares about record unemployment! Who cares about a sinking economy! Who cares if the government is flooding the system with money! The coronavirus curve is flattening, the economy is opening up again, and soon it will be back to normal. So buy, buy, buy. We’ll soon be back at record highs. Okay, that’s the way it appears. Despite the bad employment numbers this past week, the S&P 500 gained 3.5% on the week. The Dow Jones Industrials (DJI) was up 2.6% while the Dow Jones Transportations (DJT) jumped 2.3%. The big star was the tech-laden NASDAQ, jumping 6.0% and it is now positive on the year up 1.7%. The S&P 600 (Small Cap) was also up, gaining 4.2% but it remains down 24.5% on the year. In Canada, the TSX Composite gained 2.3% while the TSX Venture Exchange (CDNX) jumped 4.0%.
Overseas, the London FTSE jumped 3.0%, but on the continent things were not as rosy as the Paris CAC 40 fell 1.6% and the German DAX was down 0.9%. In Asia, China’s Shanghai Index (SSEC) was up a small 0.4% and the Tokyo Nikkei Dow (TKN) gained 0.3%. All in all, with the exception of the eurozone, major indices were up. Still, all remain down on the year, except for the NASDAQ. The World MSCI Index was also up, gaining 1.0% while Bitcoin seems destined to be a star again, hitting over $10,000 at one point gaining 13.3% on the year. The crypto fans are beside themselves, calling Bitcoin the new gold. Okay, except one is virtual while the other is real.
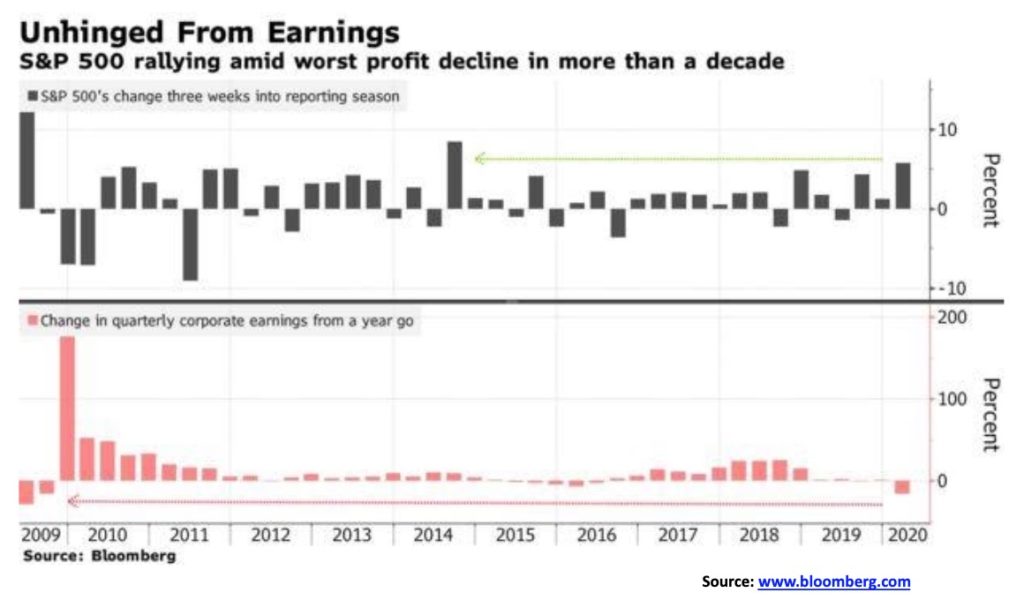
The stock market is rising even as the coronavirus continues to ravage, unemployment is soaring, earnings are sliding, and bankruptcies are rising. The stock market seems to live in another world. Maybe it isn’t real. Earnings have slipped by at least 16%, the worst since the 2008 financial crisis. Unemployment is at record levels (except for the Great Depression) but, who cares as all you really need is a few big stocks to lead the way. Microsoft, Google, Amazon, Netflix—who needs all the others. They are flying. Except, as we show later, breadth is also rising so maybe the few big ones that are leading are raising all boats. Besides, with so many bears around, the market as they say climbs the “wall of worry.” But don’t worry, be happy, and buy stocks.
Stock indices are now up over 30% from the depths of the March lows. Oh, other things could get in the way such as Trump starting a trade war with China again, but the reality is he wants to get elected and even he probably knows the market might tank if he starts another trade war. So he’ll threaten and whine but may not do anything. If that March 23 low holds, then it could become the shortest bear market on record. History, alas, doesn’t support that theory. But it is tech, tech, tech leading the way although Biotech might rise as well for whoever finds the vaccine to save us all from the coronavirus. We liked this chart from Bloomberg showing earnings falling but the stock market rising. Shrug off the lousy earnings—just close your eyes and buy.
Still, it is difficult to comprehend the rise in the S&P 500 when one considers that at least one-third of the companies have withdrawn guidance and it is not likely that buybacks will save the day as they did in the previous rally. So, where is the buying going to come from? Well, it could be the massive amount of injections of liquidity into the financial system via QE. They won’t lend it out and if the Fed institutes negative rates as they may do, then those funds could find their way into the stock market. They certainly won’t be loaned out to Main Street but, knowing the Fed is buying corporate bonds, then they’d be okay buying up corporate bond issues which in turn could help their stocks.
Don’t fight the Fed seems to be the mantra. And Trump wants to be reelected so he will do whatever it takes to get the stock market higher. Could he somehow even get the Fed to buy stocks? After all, the BOJ has been known to do just that. And the Fed could buy it through intermediaries and could make up for the stock buyback programs that won’t be happening anymore. One area that has been seeing fresh buying is golds. With trillion dollar market cap companies (or close to a trillion) like Microsoft, Amazon and Apple and all flush with cash, any one of them could probably “gobble up” all the gold mining companies in the world and still have cash left over.
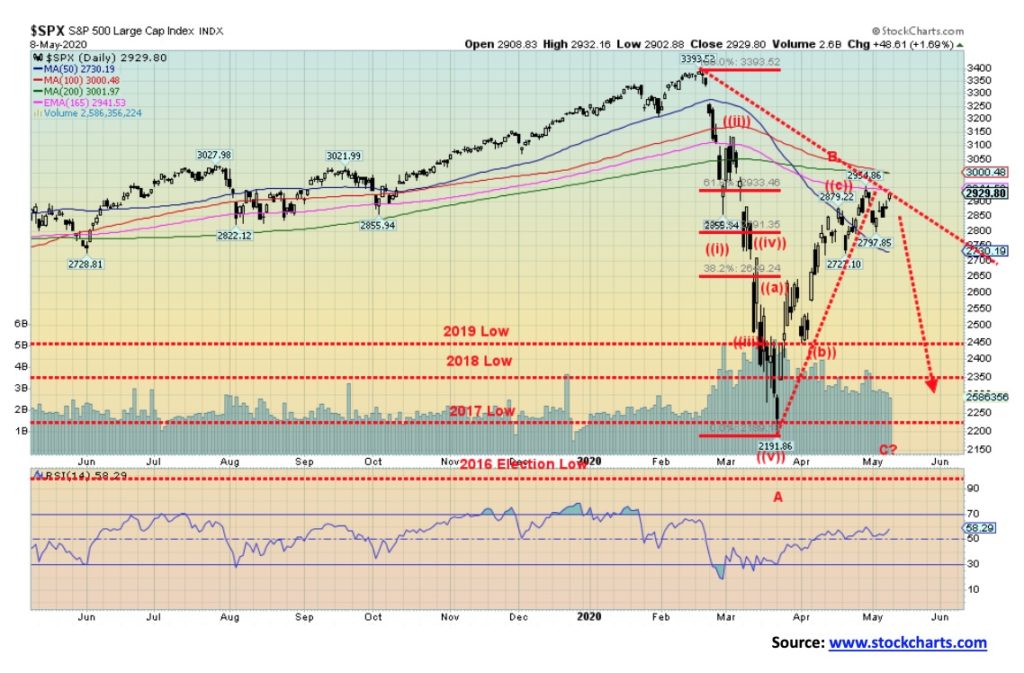
The S&P 500 is at a zone of resistance that ranges up to 3,000. Over 3,100 new highs are quite possible. A break back under 2,700 spells trouble. Under 2,450 spells big trouble and below 2,370 new lows are possible. Some numbers to keep in mind. But history, and odds still seem to favour at minimum a test of the lows or even new lows. What is needed is the trigger.
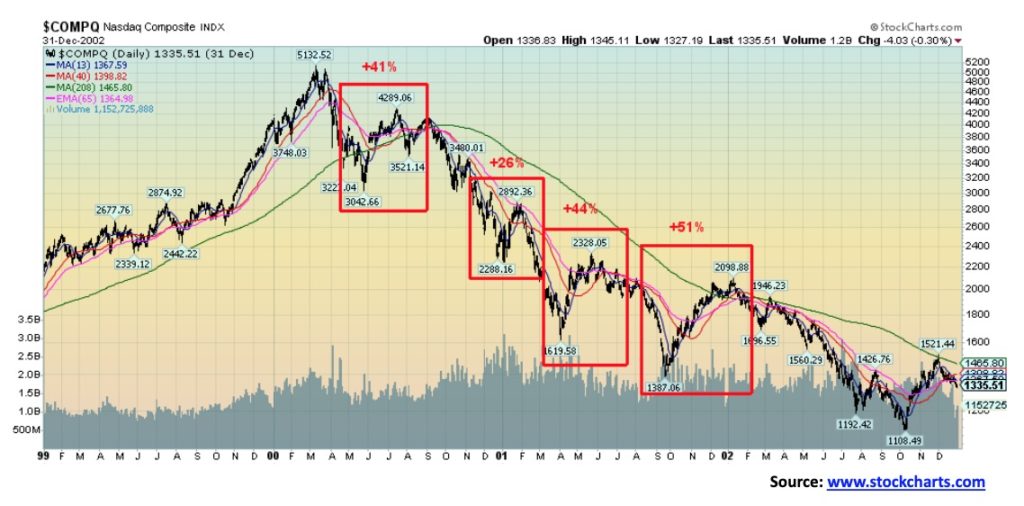
Picture of a falling market. A reminder that bear markets are not normally one and done. Once a market breaks under the 200-day MA it normally stays under that level until several months after the final bottom. It is not unusual to see impressive rallies during the bear market. The NASDAQ 2000-2002 saw four impressive rallies off of lows but with the exception of the first good rally all others failed in attempts to regain the 200-day MA. The top was seen in March 2000 and the final bottom was seen in October 2002 as the NASDAQ fell over 78%. Four impressive rallies were seen of 41%, 26%, 44%, and 51% respectively. Each time the bulls hailed that the bear was over. But they were only bear market rallies. It wasn’t until March 2003 that the NASDAQ crossed above the 200-day MA for good. Over the next five years there were two forays below the 200-day MA, in 2004 and again in 2006, but both rebounded. In 2007, with the bear underway, the NASDAQ once again broke under the 200-day MA and stayed there until regaining it for good in May 2009. The period 1929–1932 was the same. There were five good rallies seen during the 89% decline. Each one was hailed as the end of the bear.
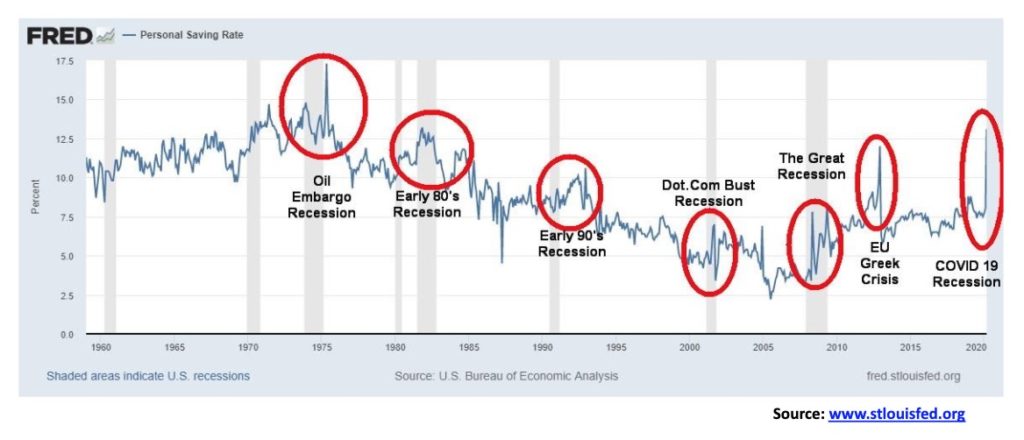
If we are going to have a growing economy, we need the consumer, who is 70% of the economy spending. Instead, they are saving and, as we show later, paying down loans as well. Rising savings rates are usually seen as a recession develops and matures. The peak can often come after the recession is over. What happens then is the consumer becomes more confident and he starts spending again. This time we are spiking in savings and the recession has barely begun. In fact, it is not even officially a recession yet. But the consumer appears to be zipping up his wallet and putting it into the bank. Savings up, loans down because of repayment = the consumer not spending, thus lowering GDP.
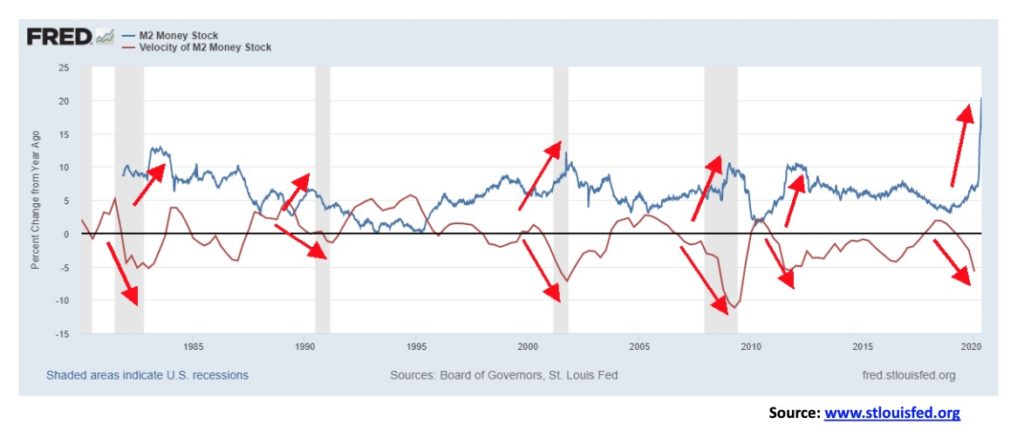
Here is the great bull hope. Gobs of money flowing into the financial system. Since the beginning of March 2020 M2 money stock has exploded upwards by $2 trillion. Historically there has never been such an explosive move for M2. But as the chart tells us even as M2 money stock rises the velocity of money actually falls. The current velocity numbers are not quite up to date but it is most likely lower today. But with 40 million unemployed and everyone unable to spend money on restaurants, travel, cinema, retail and more any money they receive is going to pay down loans and/or into savings. But the money goes somewhere and since the banks aren’t lending it out to any extent nervous as they are about mounting loan defaults the money, we suspect, is being deployed into the stock market. Wall Street bulls rejoice. Main Street the people wallow in their unemployment and lockdown.
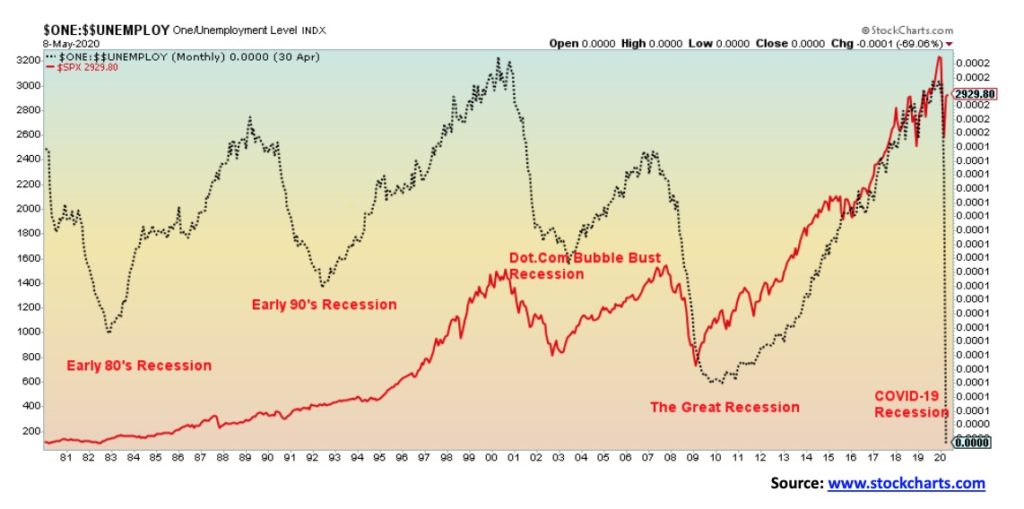
Two going in opposite directions. While Main Street flounders with the unemployment rate soaring to 14.7% (U3), Wall Street celebrates with the S&P 500 continuing its recent run to the upside. One of them is wrong. For the most part when the unemployment rate rises (the chart above has an inverted unemployment rate so in this case falls) the S&P 500 is also falling. We saw during the tech-bubble crash and during the financial bubble crash even if the rise in unemployment started after the stock market began to fall. It wasn’t too clear during the early 90s when the unemployment rate rose sharply but the stock market didn’t fall. That was certainly a signal to load up on stocks. But this time unemployment is rising while the stock market is also rising? One is sending the wrong signal. But which one? In the early 1990s it was the stock market sending the right signal to buy even as unemployment rose. Could the same signal be showing again?
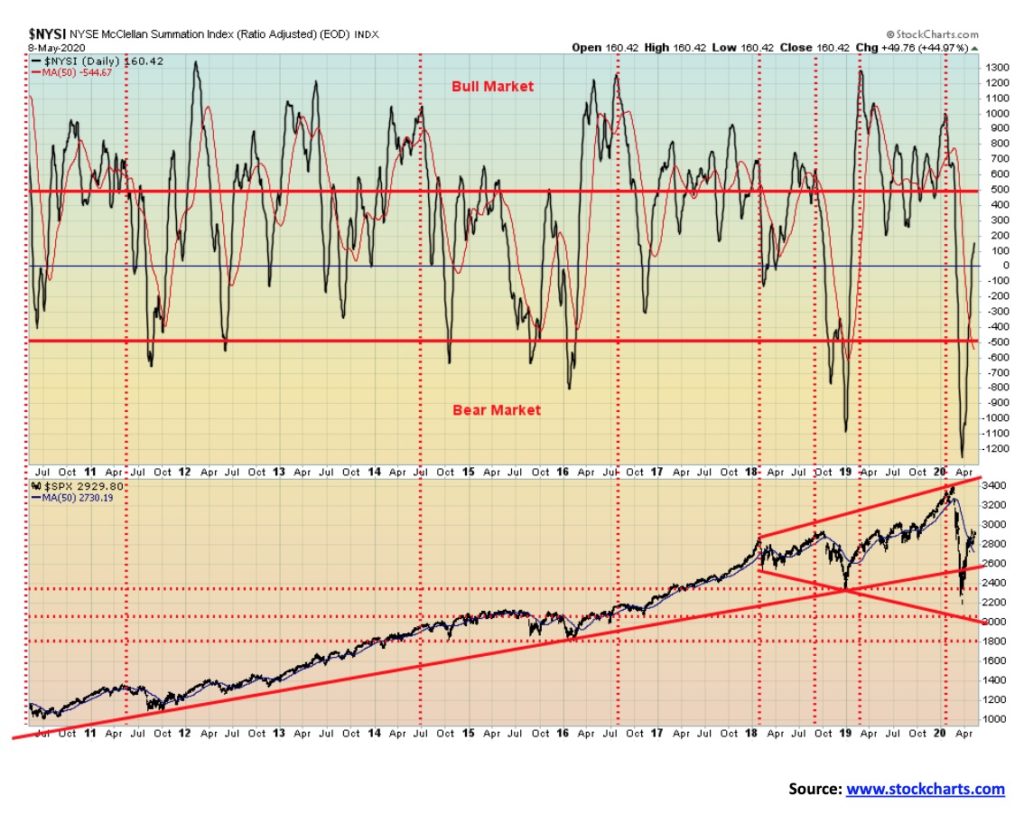
Our favourite indicator, the McClellan Summation Index ratio adjusted (RASI) is still at levels that can’t get us excited about this bull rise for the stock markets. The RASI is now back to 100 which we consider to be neutral territory. Above 500 we are bullish while below -500 we are bearish. Peaks usually come when the RASI gets to 1,000 or higher and bottoms are often found when the RASI falls below -500.
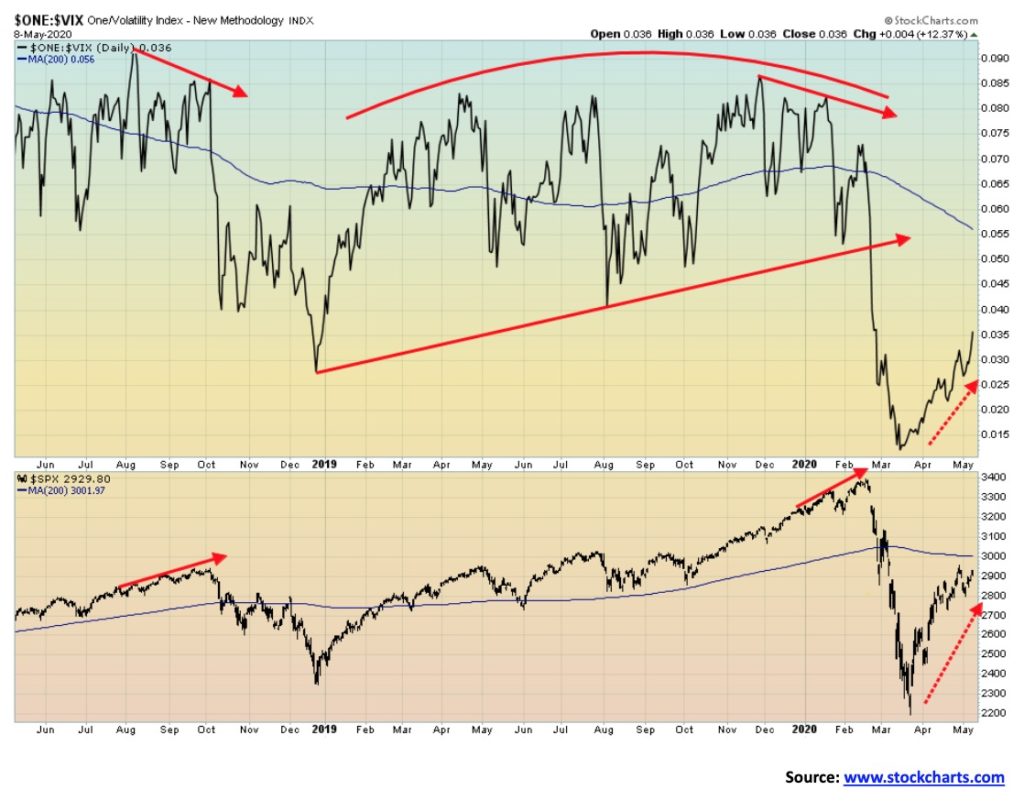
Here is another indicator that appears to be telling us that the advance seen thus far for the S&P 500 could continue. At tops and bottoms, we look for divergences. On top is the Volatility Index (VIX) (inverted) and below is the S&P 500. Note that we saw divergences between the two with the VIX making a lower high even as the S&P 500 made a higher high during the September/October top in 2018 and again during the January/February top of 2020. So far, both are rising together so that is a positive sign and suggests that could have further to rise. The only thing we note is the S&P 500 is approaching its 200-day MA but the VIX is nowhere near their 200-day MA.
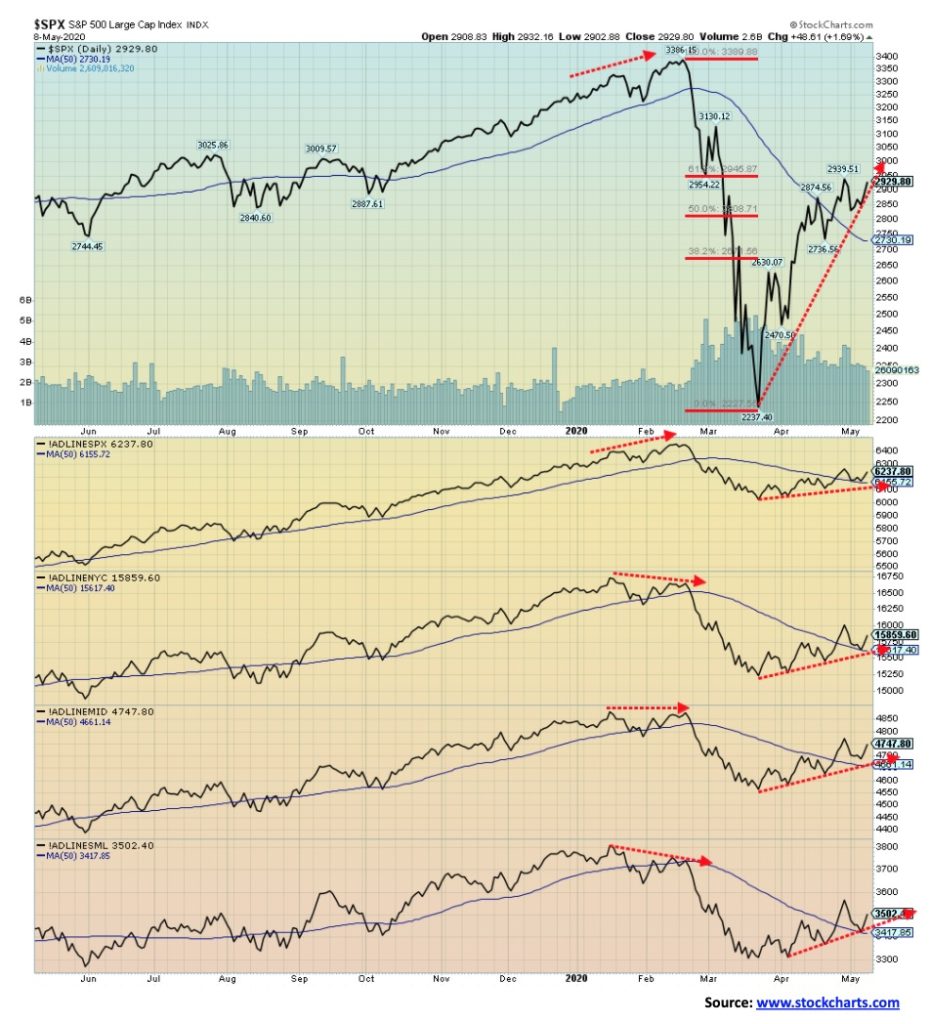
This is the bulls’ great hope. These are the cumulative-advance-decline lines for the S&P 500, the S&P 400 (mid), the S&P 600 (SML) and the NYSE (NYC). All are in uptrends with no signs of divergences. The uptrend coincides with the recent rallies for the S&P 500, S&P 400, S&P 600, and the NYSE. Note the divergences at the top for the S&P 500 (SML) and the NYSE (NYC). The S&P 400 (Mid) was fairly flat at the top; however, the S&P 500 AD line kept advancing along with the S&P 500. And we note everybody is over the 50-day MA as well. But can we advance further? The cumulative AD line appears to be saying “yes, we can.”
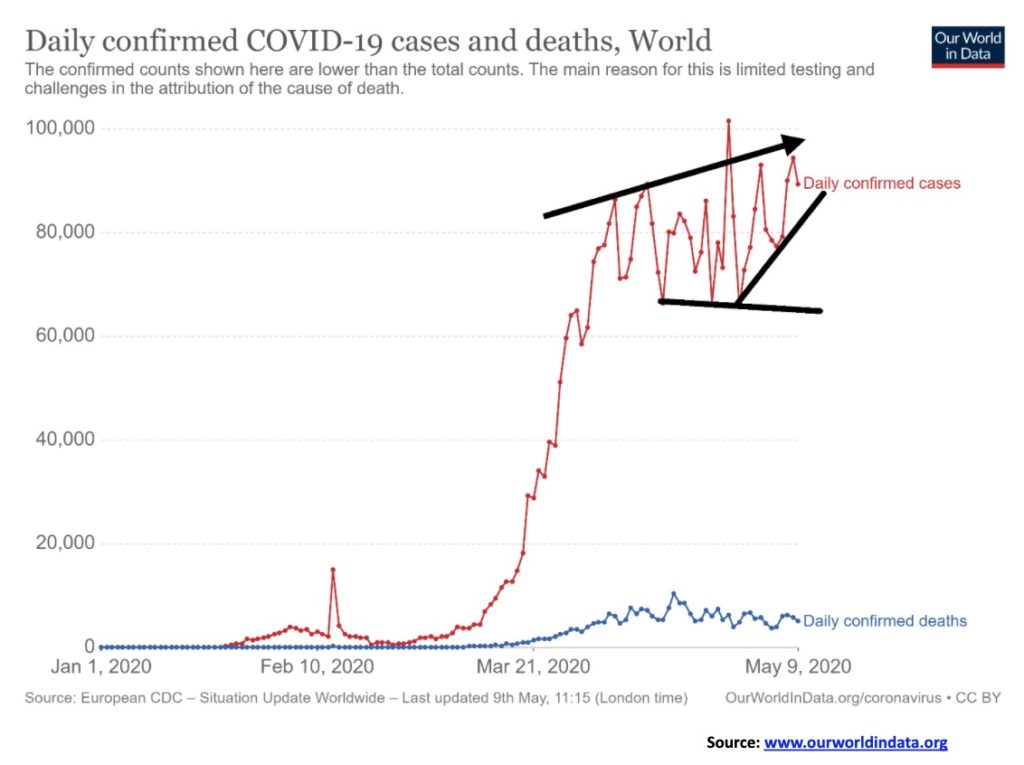
The number of COVID-19 cases worldwide appears to be rising even as the number of deaths appears to be falling. A 7-day MA on the chart would show that the MA is once again turning up even as the deaths turn down. Large daily rises are being seen in Russia, Mexico, and Brazil even as it appears to be leveling off elsewhere. The U.S. still leads almost daily in cases and deaths.
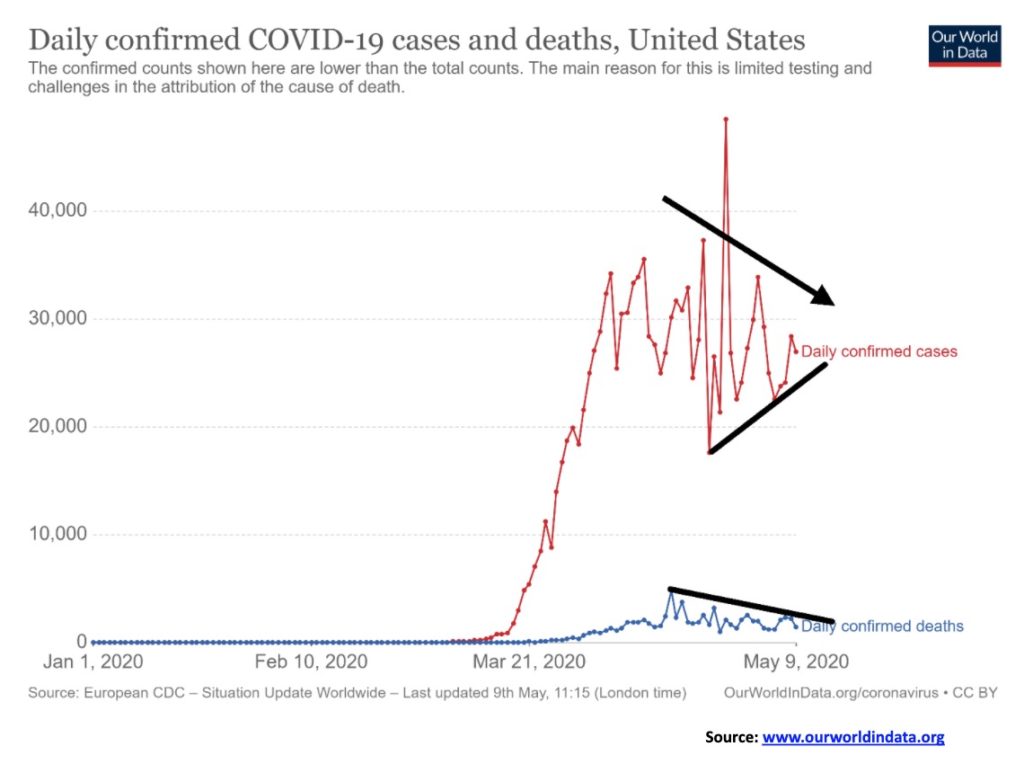
The argument in the U.S. is that the number of cases is flattening; therefore, it’s time to re-open. Leading the pack has been New York State with New Jersey second running at less than half of New York State. However, numbers are starting to rise in states that are opening up, particularly in the U.S. south. Could we see another spike in cases even as the number of deaths is flattening and slowing?
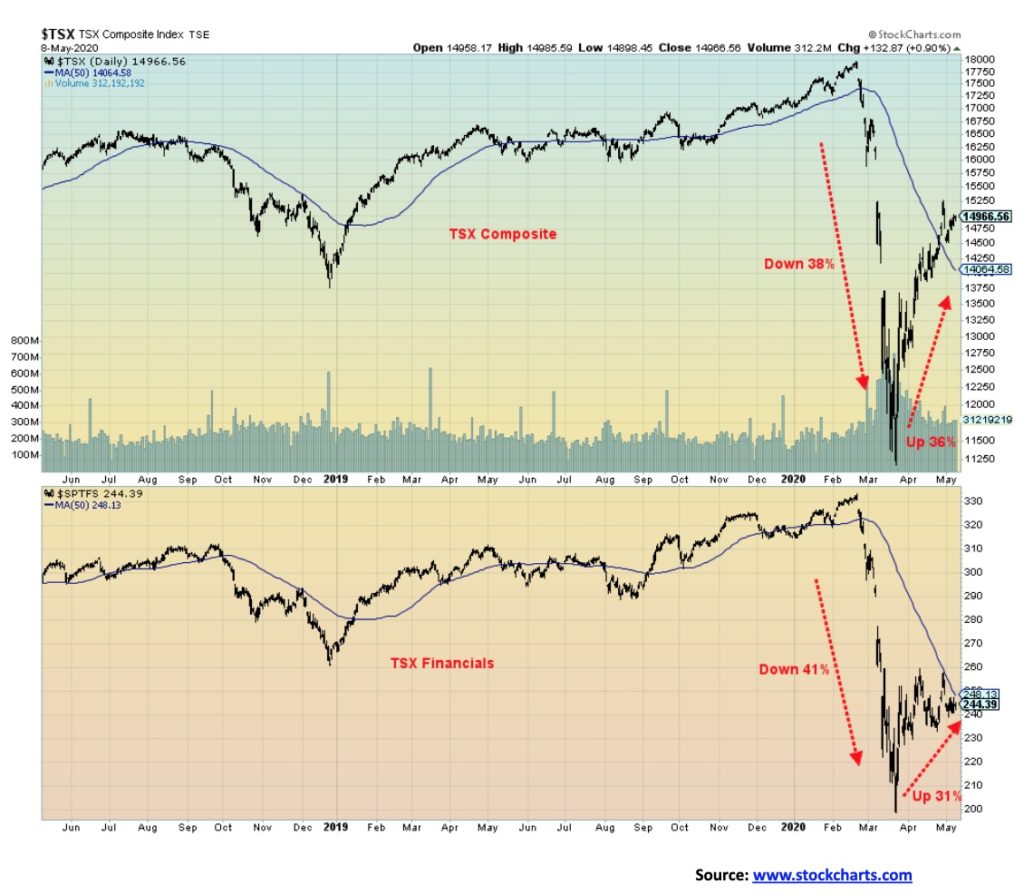
If the TSX is to make a serious run to the upside, it needs the TSX Financials sub-group to be the leader, not a laggard. The TSX Financials make up 32% of the TSX Composite. The financials are lagging as the chart attests. The TSX has gained 36% since the March low, but the TSX Financials are only up 31% and remain down 22.5% in 2020. By contrast, the TSX Composite is down only 12.4% in 2020, helped considerably by gains in Information Technology, Golds, Materials and Metals & Mining. Those four sub-indices are the only positive sub-indices in the TSX. This past week the TSX Composite gained 2.3%. But, as usual, it was a mixed bag for the sub-indices. Only one was down on the week: Health Care (THC), losing 2.5%. The Health Care sub-index is down 35.7% so far in 2020. It is the second worst performer behind Energy (TEN). The TEN was a gainer this past week, up 2.0% but remains down 48.4% in 2020. The big winner on the week was Information Technology (TTK) up 9.7%. We have previously cited Info Tech as one area that should be a big winner during COVID-19 along with Materials – Golds and Metals. Info Tech is now up 24.2% on the year. The big winner so far this year is Golds (TGD), up 34.8% on the year and 3.0% this past week. Metals & Mining (TGM) gained 4.1% this past week while Materials (TMT) was up 2.4%. The TSX is up over the 50-day MA but momentum is fading and we have recovered roughly the Fibonacci 61.8% retracement of the February/March collapse. The TSX needs to regain above 16,400 to suggest to us that new highs are possible. A breakdown under 14,000 would suggest further losses ahead. Under 12,100 new lows are possible.
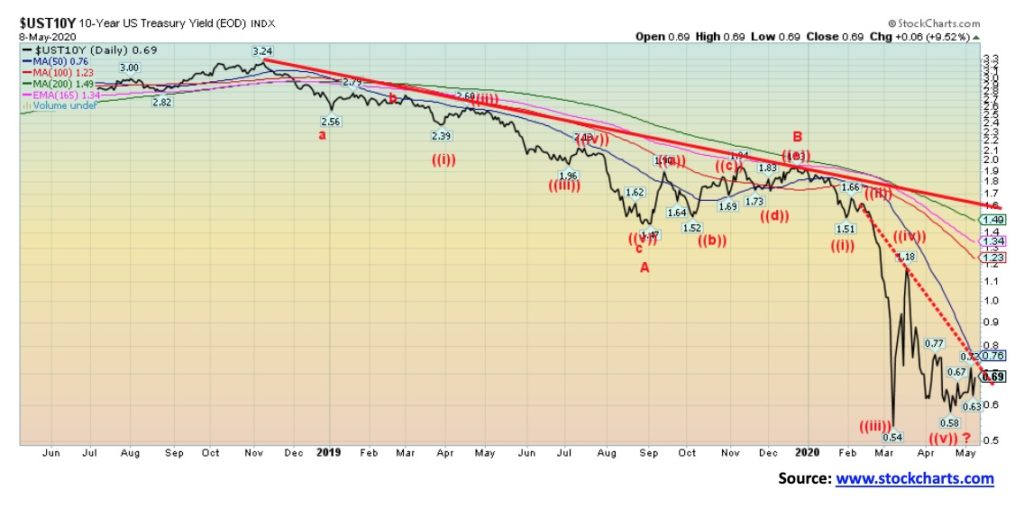
The U.S. 10-year treasury note continues to mark time at low levels, closing this past week at 0.69%, up from 0.64% the previous week. We continue to hear talk of the potential for negative interest rates. Negative interest rates would come about in an attempt to force the banks to put their money they receive from QE into the economy rather than hoarding it in bank reserves. They’d have to start paying negative rates for bank reserves held with the Fed to encourage them to place the funds elsewhere. Of course, elsewhere could be speculation in the stock market rather than lending it out to consumers and corporations, a group collectively in over their heads in debt. The banks nervous of loan losses have already tightened lending rules and as bankruptcies mount, they could tighten even more. Setting aside the job numbers which we featured, other economic numbers out this past week of importance were the NY ISM that fell to 4.3 in April vs. 12.9 in March; factory orders fell 10.3% in April; the balance of trade was -$44.4 billion vs. -$39.8 billion in March; the Markit Manufacturing PMI came in at 27.0 for April vs. 40.9 for March; and the Markit Services PMI for April was 26.7 vs. 39.8 for March. The PMIs were well below 50 that demarks whether an economy is growing or in recession. These are pretty miserable numbers. There is not much in the way of numbers this coming week, although both the CPI and PPI will be out. As well, initial jobless claims are still expected to be ridiculously high at 2.5 million. That’s good as it would be down again. This past week the jobless claims came in 3.2 million, making it to over 33 million in a mere five weeks. Temporary or not that is a horrendous number.
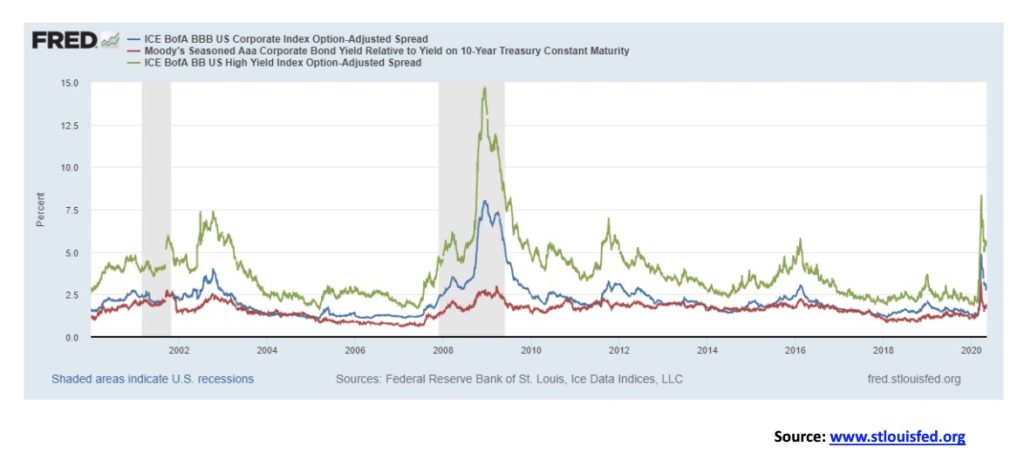
With the Fed and the Treasury pouring trillions of dollars into the economy in an attempt to keep it afloat, confidence has returned to the credit markets. They figure that the Fed will just buy up all the bad debt. Or will they? Aaa credits over the 10-year treasury is at 1.89%, up from a recent low of 1.47% but well down from a recent high of 3.20%. BBB credits, the lowest investment grade corporate bond, is at 2.83%, well down from the recent high of 4.74. Even BB-rated bonds, the highest junk bonds, saw the spread fall to 5.37%. That’s up from a recent low of 5.00% but well down from the high of 8.37%. Overall, credit spreads continue to come down. But will they last?
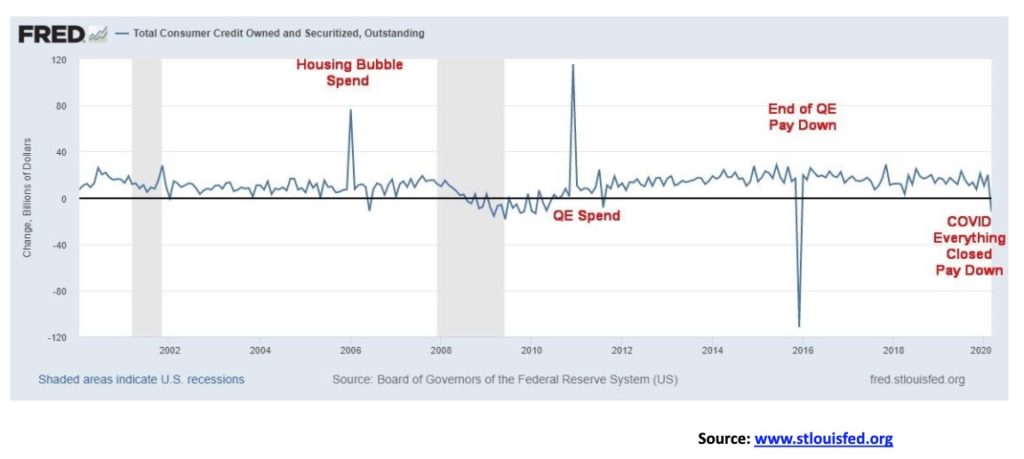
The consumer is, they say, 70% of the economy. So, if the economy is to grow, we need the consumer to spend. So, what has the consumer done with his cheque from the government? Did he spend it? Well, maybe to pay his rent, buy food, but otherwise it was spent to pay down loans or it went into savings. Consumer credit fell by $12.1 billion in March after rising by $20 billion in February. The market had actually expected a rise of $15 billion. It is the first decrease since December 2015 when the Fed was ending QE and beginning to tighten. Otherwise, those spikes we see came during the housing bubble and when the Fed was loosening like crazy and QE was swinging into the forefront. Falling consumer credit does not bode well for the consumer economy. If the consumer decides, given the circumstances, to save and pay down debt rather than spend, then growth will not get back to previous levels. That lack of spending is also reflected in the plunging Velocity of M2 Money.
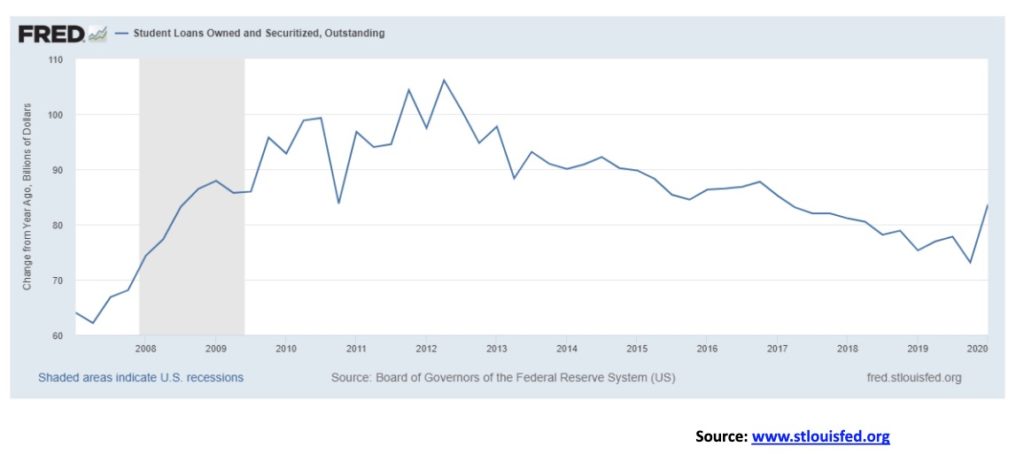
We were surprised to discover that student loans, rather than falling over the past few weeks have actually gone higher. Student loans rose to $1.683 trillion in Q1 2020, up from $1.641 trillion in Q4 2019. Over the past year, student loans have gone up by $836 billion. It will be interesting to see what Q2 brings. It could be that in the COVID-19 more are returning to school (virtually?) and are therefore borrowing more. Of course, given the huge amounts tossed out to boost things during the COVID-19, paying off all student loans would be almost a drop in the bucket given that they only total $1.7 trillion. With the Fed’s balance sheet exploding to the upside, what’s another $1.7 trillion.
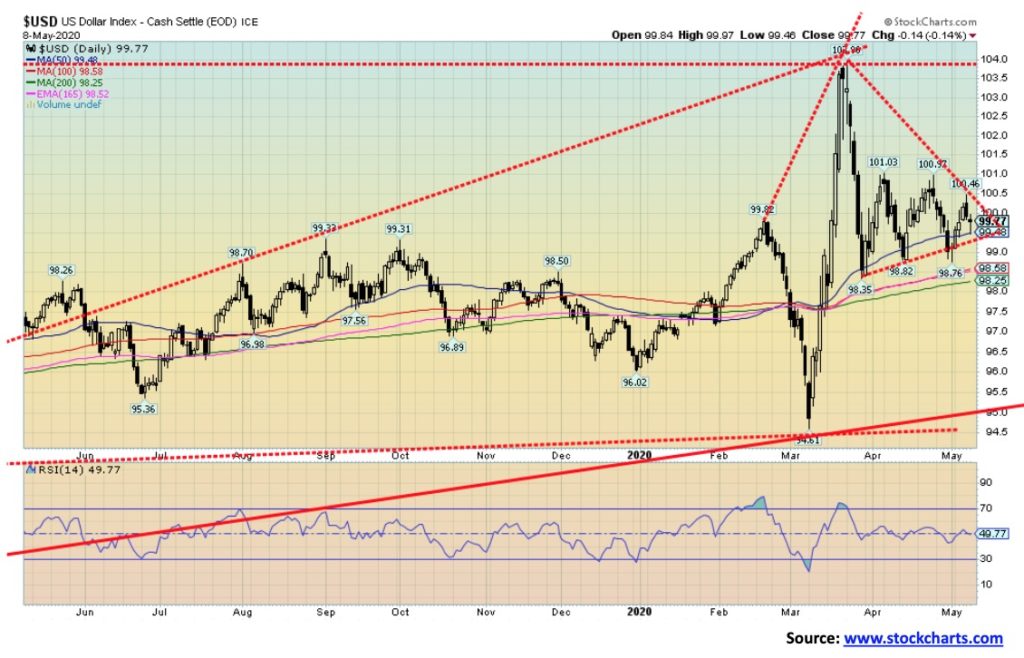
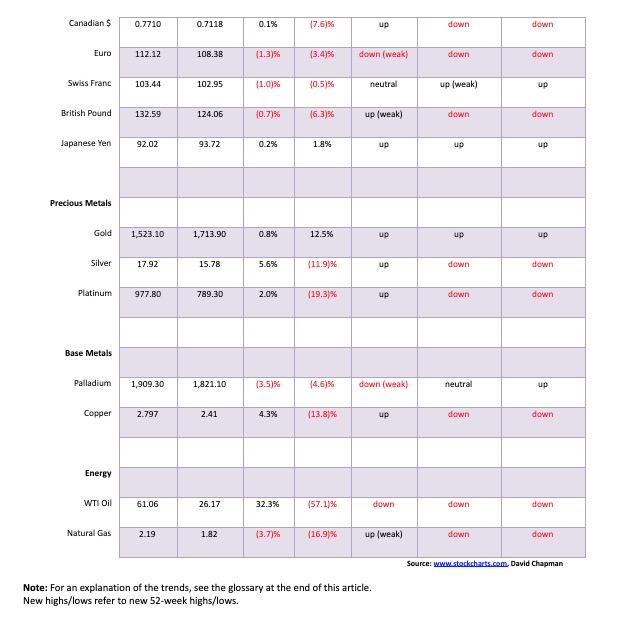
The US$ Index continues to trade within the context of a tightening triangle. The triangle is such that we could argue both bull and bear cases. On the week, the US$ Index gained 0.7% while other currencies were off. The euro slipped 1.3%, the pound sterling was down 0.7%, while the Swiss franc slipped 1.0%. The Japanese yen gained a small 0.2% on the week while the Canadian dollar’s gains of 0.1% were the smallest of the bunch. The Chinese yuan remains steady at 7.09255 vs. 7.136 a week earlier. The US$ Index breaks down under 99.00 and especially under 98.25. Potential targets could be down to 93.50. Considerable support would be seen around 98 and 95. To the upside, the breakout is at 100.50. Potential upside targets could be up to 106. There would be resistance at 101 and up to 104. Talk of negative interest rates and signs that the U.S. economy is weakening further could help push the US$ Index to the downside. Signs that the U.S. economy is recovering from the COVID-19 and employment is coming back could help push the U.S. dollar higher. The RSI is quite neutral and trends are not strong with the daily trend in a weak downtrend; the intermediate and the long-term trend remain up but not neither are particularly robust. The euro remains key and here the euro appears as if it could sink further. Of the other currencies, the Swiss franc and the Japanese yen remain the most appealing.
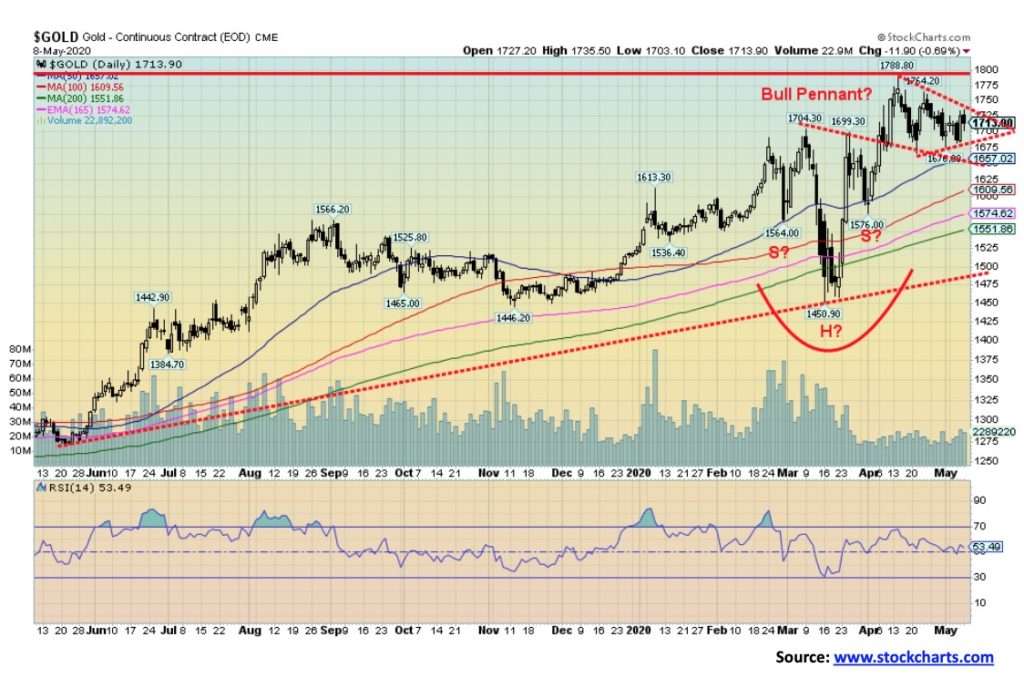
We continue to view gold positively. Gold responded to this past week to continued signs of an economic slowdown/recession, although on Friday following the jobs report gold actually sold off a little. But the sell-off appears to be all a part of the consolidation that has been going on since gold first approached $1,800 and the 2012 highs in early April. On the week, gold rose 0.8% while silver finally outperformed, up 5.6%. Platinum also was up on the week by about 2.0%. Palladium continues to correct its big gains of 2019, losing 3.5% while copper gained 4.3% on the week. Palladium is finally down on the year, off 4.6% while copper remains subdued, down 13.8% so far in 2020.
Gold has shown weak seasonality in the past into May and even June so this consolidation was not a surprise. Gold appears to be forming a bull pennant which is a positive development. If correct, the breakout comes near $1,740 and projects potentially up to $1,850. The head and shoulders pattern that appeared to form between February and April projects up to $1,925/$1,950. We are still on target for those levels. Thus, the importance of breaking out over $1,800. However, given the level was the 2012 high ($1,798), the consolidation should not have been a surprise. Gold should continue to respond to the weakening economic situation, plus near zero interest rates (that could soon become negative interest rates) and the trillions of dollars being pumped into the system through direct injections and QE to support the economy. We remain positive on gold going forward. Support is at $1,670 and we’d prefer not to see that level break. A breakdown under $1,575 would be more negative and a breakdown under $1,450 (the March low) would be terminal.
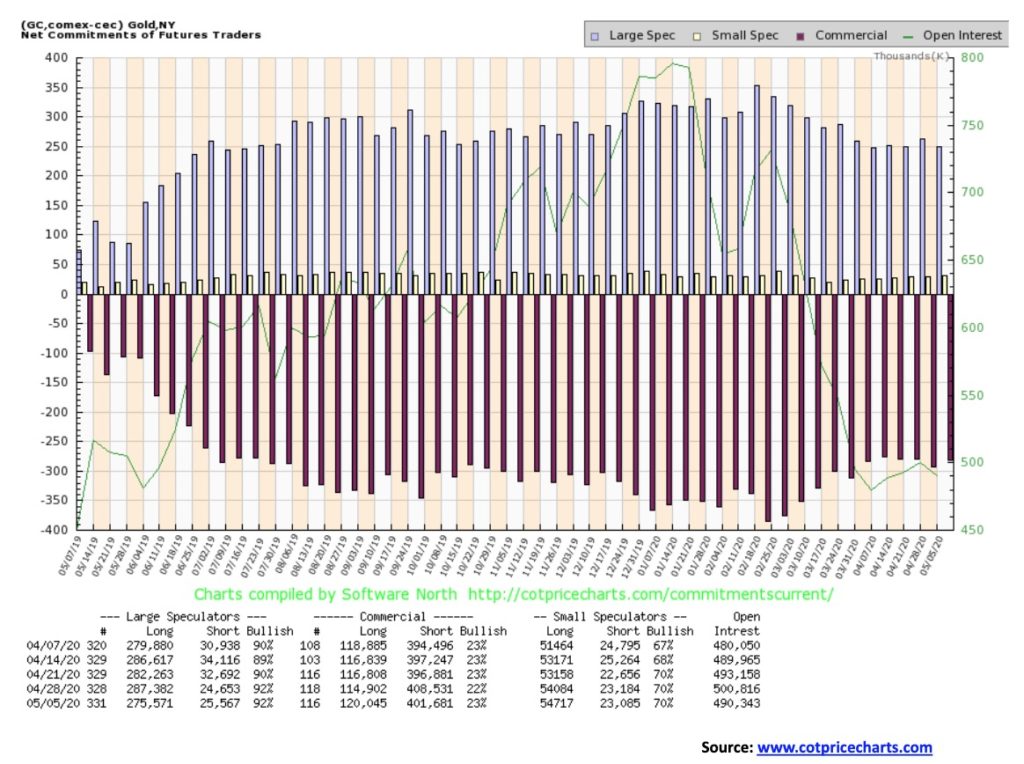
The gold commercial COT improved this past week to 23% from 22% a week ago. Long open interest rose just over 5,000 contracts while short open interest fell about 7,000 contracts. That is a positive combination that continues to tell us the commercials are covering shorts on declines and even adding a little on the long side. But at 23% we hardly consider the COT bullish. The large speculators COT (hedge funds, managed futures, etc.) was steady at 92% as long open interest fell about 12,000 contracts while short open interest rose about 1,000 contracts. Commercials a little bit more long, large speculators a little bit more short—that’s perfect if one wants to be bullish gold. Just it isn’t enough as yet. We’d prefer to see the commercial COT over 40%.
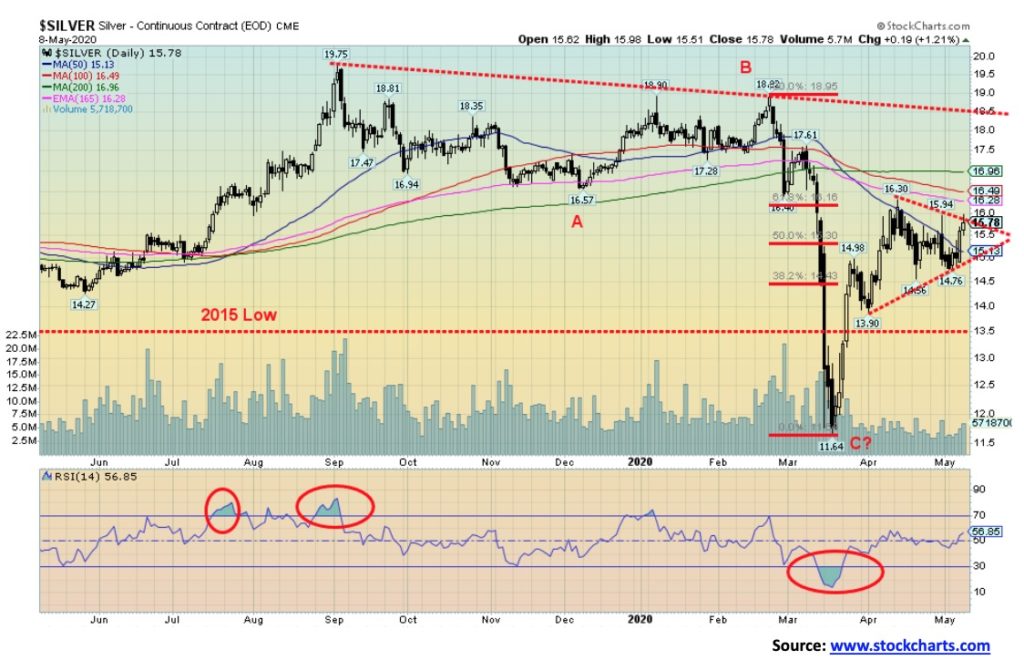
Silver had a decent week, gaining 5.6%. Put against the 0.8% gain for gold, silver’s performance was great. This helped lower the gold/silver ratio to 108.6. However, it’s still outrageously high. Even a move to 70 would be very welcome. At that level silver should be trading near $25, a good $10 higher. Silver is trying to take out the 50-day MA but further resistance lies above at the 100, 200-day MAs and the 165-day EMA. Silver still needs to break out over $17.25 to tell us new highs are potentially coming. The 200-day MA is currently at $16.90. Still, silver has recouped roughly the Fibonacci 61.8% retracement level between the recent high and the March low at $11.64. We could be forming a symmetrical triangle here. A breakout over $16 could trigger a potential move to targets up to $18.40. Support lies at $14.75 and again at $13.90 two recent lows. A breakdown under $14.75 would be negative and could potentially lead to a decline to as low as $12.50. We do keep reading bearish reports that silver could fall to 2008 levels near $9. We don’t dismiss that as we are aware of the long-term cycles that we outlined previously. Nonetheless, silver continues to appear bullish here and our expectation is an upside breakout. But given its huge lagging of gold, silver has a lot of work to do. Silver should be leading like it did this past week.
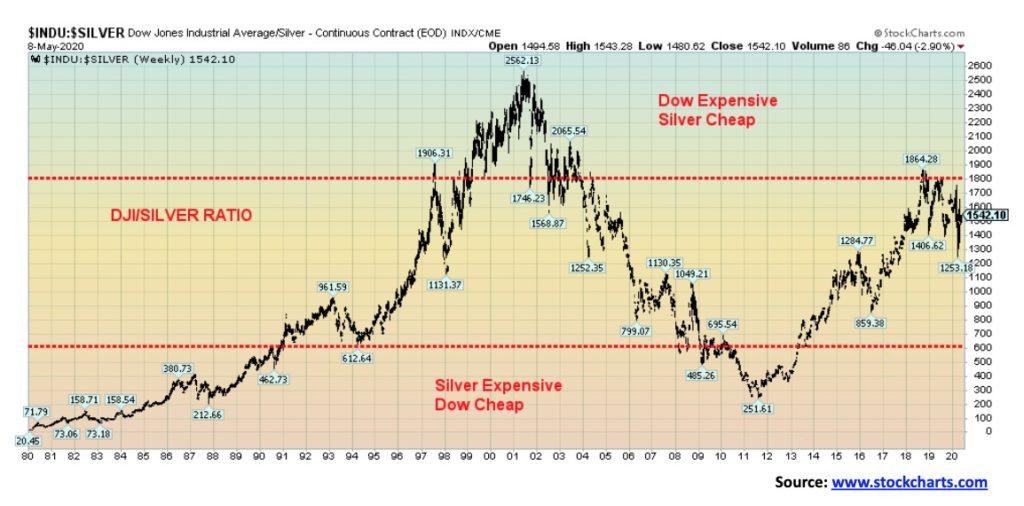
It is popular to look at the Dow/Gold ratio but we rarely, if ever, look at the Dow/Silver ratio. Yet, not dissimilar to the Dow/Gold ratio, it is showing today that silver remains relatively cheap in relation to the DJI. Naturally, the bottom was seen in 1980 when silver prices hit $50. And, once again, silver was expensive relative to the DJI in 2008 when silver hit $50. But 2001 proved to be seminal for silver, not unlike gold, as both were relatively cheap when compared to the DJI. At the time silver prices had fallen to $4. The most recent high in the ratio came in September/October 2018 when silver prices at the time were trading between $17–$20. That actually seems a long way off now with silver prices below $16. But the ratio has improved over the past few months as silver has outperformed the DJI on a relative basis. The trend has shifted down for the ratio with lower lows and lower highs. That is quite favourable for silver going forward relative to stocks.
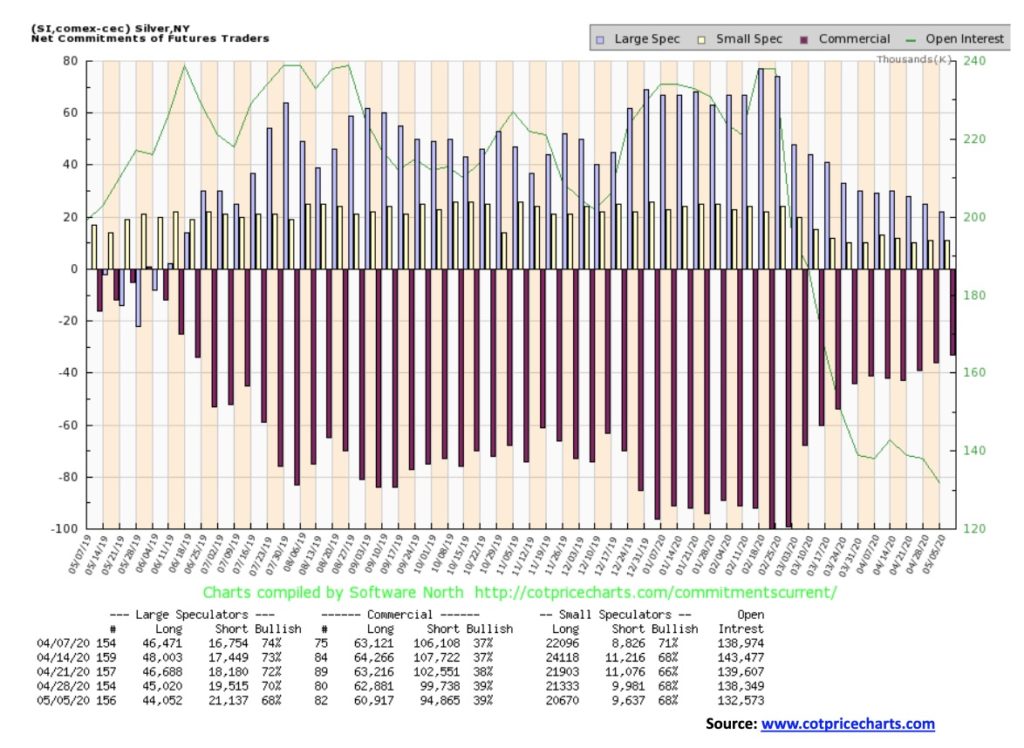
The silver commercial COT remained unchanged this past week at 39%. There was a drop of roughly 2,000 contracts for long open interest and a drop of about 5,000 contracts for short open interest. The large speculators COT fell to 68% from 70%. Overall, open interest continued to fall. We continue to view the silver COT as at least mildly bullish.
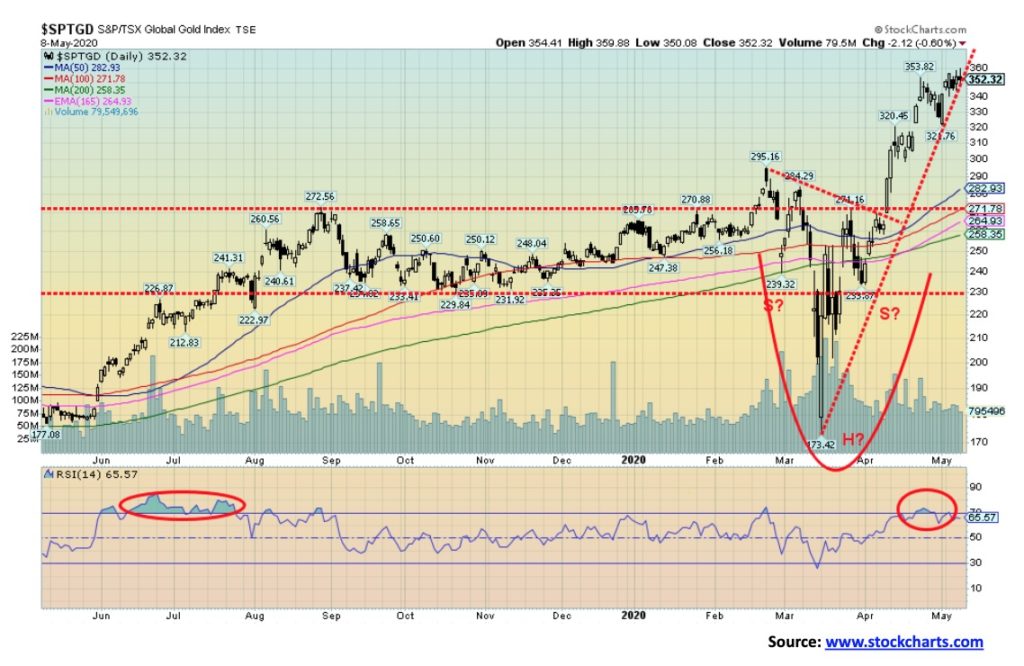
The gold miners keep chugging ahead, once again making new 52-week highs. The TSX Gold Index (TGD) was up 3% this past week and is now up a healthy 34.8% in 2020. It’s the leader on the TSX. The Gold Bugs Index (HUI) gained just under 3.3% this past week and is up 17.9% in 2020. The difference is there are some large international companies in the HUI that are not in the TGD. The head and shoulders bottom pattern remains valid and still projects up to at least 385–390 for the TGD. That’s more than a double from the March lows and a 48% gain on the year. We’d expect the TGD to hesitate at minimum up at those levels and some may wish to consider profit-taking if long. The RSI backed off from overbought over 70 but it remains elevated. In a strong market, overbought can stay with us for some time. It’s a warning, not a guarantee, of a top. A break under 322 could signal a pullback to the rising MAs between 260 and 280. Interim support would be seen at 300. We remain in somewhat unchartered territory as the last time we were up at these levels was back in 2011/2012. There is a strong band of resistance between 350 up to the 2011 highs of 450.
Oil prices continued their remarkable recovery run this past week. They have now basically doubled in a little over a week as production cuts definitely helped. But anyone expecting demand to return to 2019 levels is probably looking through rose-coloured glasses. The reduced volume on the upswing tells us this is a corrective move only and, given that it is fast approaching key resistance areas and falling MAs, the rally is probably just about done. IHS Markit has estimated that production has probably fallen some 17 million BPD in Q2 with U.S. and Canada cuts totalling some 1.7 million BPD. Given the combined push of lower oil demand, coupled with increased demand for green energy, the odds of a major recovery in the energy sector are most likely slim to none. Going forward, demand is likely to remain subdued and therefore the need to pump as much oil globally drops accordingly. Possibly war for oil will cease to become a major reason for war. Another victim of the drop in demand could be plastics, particularly given their long shelf life and disposability clogging landfills and the oceans. Again, the environment might be a major winner here.
Meanwhile, oil and gas firms continue to wrestle with debt, stopping or at least lowering dividends, cutting spending on projects, and shutting production. Will the need for huge investments such as pipelines and offshore projects really be needed going forward? Even the Middle East is looking at renewables. And, given the strategic importance of the Gulf and the Straits of Hormuz, could reduced demand lessen the thoughts of war in the region?
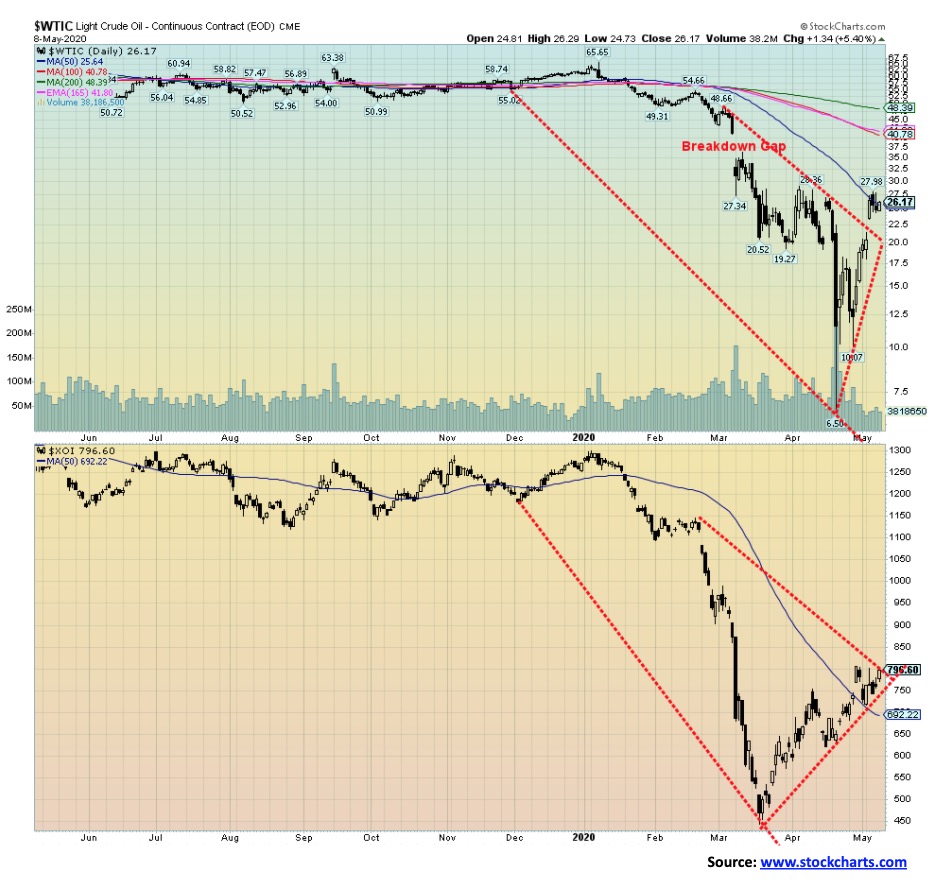
WTI oil gained 32.3% this past week but is still down 57.1% on the year. Natural gas (NG) was down 3.7% and prices remain depressed under $2. The energy indices did well with the ARCA Oil & Gas Index (XOI) in particular having a great week, up 9%. However, the TSX Energy Index (TEN) didn’t fare as well, gaining only 2%. The XOI remains down 37.3% on the year while the TEN remains down 48.4% in 2020. WTI oil is testing the 50-day MA while the XOI has broken above the key MA. But will the XOI hold above it? On a bright note, a consolidation here for WTI oil could in theory set up a potential head and shoulders bottom pattern. We’ll continue to monitor.
—
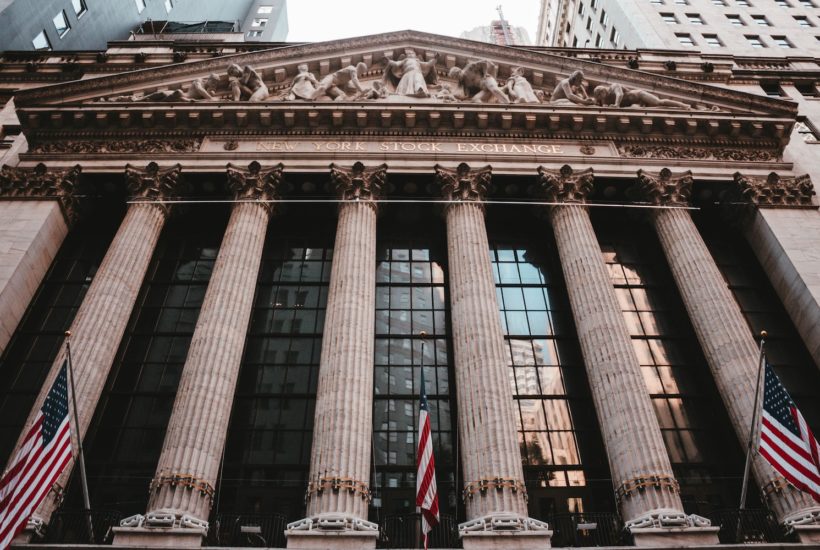
(Featured image by Aditya Vyas via Unsplash)
DISCLAIMER: This article was written by a third party contributor and does not reflect the opinion of Born2Invest, its management, staff or its associates. Please review our disclaimer for more information.
This article may include forward-looking statements. These forward-looking statements generally are identified by the words “believe,” “project,” “estimate,” “become,” “plan,” “will,” and similar expressions. These forward-looking statements involve known and unknown risks as well as uncertainties, including those discussed in the following cautionary statements and elsewhere in this article and on this site. Although the Company may believe that its expectations are based on reasonable assumptions, the actual results that the Company may achieve may differ materially from any forward-looking statements, which reflect the opinions of the management of the Company only as of the date hereof. Additionally, please make sure to read these important disclosures.


Temotiva Launches Crowdfunding Campaign to Advance Preventive Mental Health
Temotiva Innovación Lab has launched a crowdfunding campaign through Santander X Explorer, marking a new phase for the University of...


Fed Policy Shift Raises Concerns Over Debt and Inflation Risks
The Federal Reserve is criticized for resuming balance sheet expansion through Treasury purchases despite expectations of tighter policy under new...


AI Adoption in Italian Retail Stalls Despite Strong Experimentation
A survey on AI in Italian large-scale retail trade shows companies are increasingly adopting artificial intelligence, but only 1.4% have...


Crypto Market Stays Stable as Bitcoin and Ethereum See Mild Declines
The crypto market remained stable despite slight declines in major coins like Bitcoin and Ethereum. Bitcoin held near $64,362, while...


WNBA Removes Cannabis From Banned Substances List in New CBA
WNBA removed cannabis from its banned substances list in a new CBA running 2026–2032, aligning with NBA policy and allowing...
 |
|
 |  |
 |
|
-

 Biotech2 weeks ago
The German Biotech Industry Faces Funding Crunch Despite Market Stability
-
 Markets6 days ago
Rising Inflation, Fed Uncertainty, and Market Excess Amid War and SpaceX Mania
-
 Markets2 weeks ago
Jobs Strength Triggers Market Reversal as Inflation and Rates Take Focus
-

 Africa3 days ago
Egypt’s Net Foreign Assets Rise as External Position Continues Gradual Strengthening