Markets
Why a New Financial Crisis Is Looming the Market
The 2008 financial crisis was the worst financial and economic crisis since the Great Depression. It was felt that if the monetary and fiscal authorities failed to act it could turn into another Great Depression. The word QE came to the fore. Interest rates fell to zero and even below. That in turn set off the stock market and housing bubbles that were further “goosed” by the pandemic. But what if we have another crisis?

The 2008 financial crash has been described as the most severe economic crisis since the Great Depression. While it didn’t last as long the Great Depression, it left a deep, indelible mark that is still felt today. The causes are many, but greed was at the heart of it somewhere. “Greed, for lack of a better word, is good.” So said by Gordon Gecko, played by Michael Douglas, in Wall Street (1987). So, what greed? Predatory lending through sub-prime mortgages, excessive risk-taking by financial institutions, toxic assets in banks, and the bursting of the housing bubble. All of these combined to create what many call “a perfect storm.”
It wasn’t as if the 2008 global financial crisis was it. The European debt and banking crisis got underway in 2009 and lasted variously until 2019. Without the massive intervention of central banks and governments globally, what became known as the Great Recession could have become another Great Depression. Still, U.S. unemployment rose to 10.8% (U3) and 17.2% (U6), the highest since the 1980–1982 recession and GDP fell 5.1%, the biggest decline since the Great Depression. The near-global collapse spawned a number of films, including 99 Homes (2015), Margin Call (2011), Too Big to Fail (2011), The Big Short (2015), and Inside Job (2010).
Then along came the COVID 19 pandemic, giving rise to a whole new set of problems. Once again, unemployment soared and the stock market crashed. Once again, the response was dropping interest rates to nearly zero, including the EU and Japan moving to sub-zero interest rates, central banks providing liquidity through quantitative easing (QE), while governments responded with massive fiscal programs to keep the economy intact. If they hadn’t done so, the potential for another Great Depression was there.
In both cases, the words really were “if we don’t do something now (actual words were do this ‘tomorrow’), we won’t have an economy on Monday,” as stated by Ben Bernanke, 14th Chairman Federal Reserve (2006–2014). In both instances—2008 and 2020—a global financial meltdown and depression loomed.
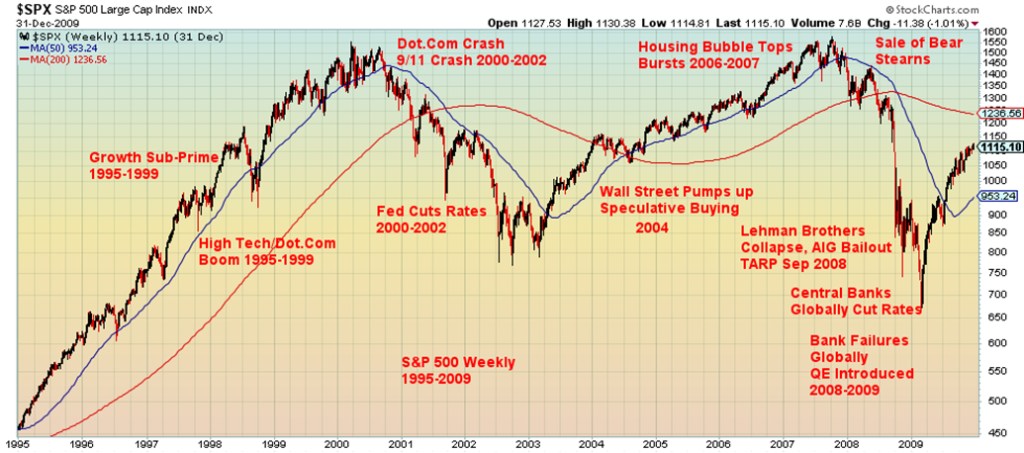
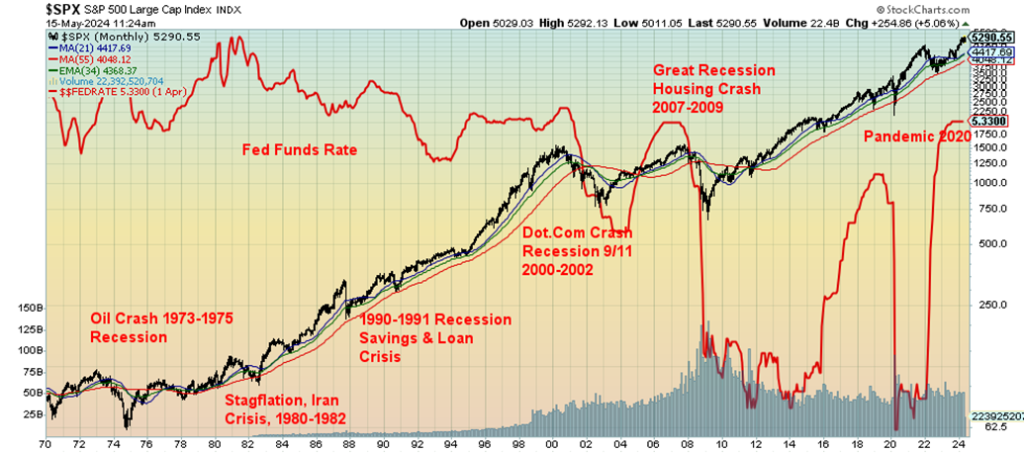
The day was saved. But what about the next time? Therein lies the problem. Since the world came off the gold standard in August 1971, signaling the end of Bretton Woods, the world has seen an unprecedented explosion in money and debt. We have covered this ground numerous times in previous Scoops. The massive growth in money and debt in turn helped spawn bubbles.
Since the turn of the century, we’ve seen the internet dot.com bubble (1995–2000), the housing bubble (2006, 2022), and the cryptocurrency bubble (2017 and again in 2024). That’s the bubbles they list, but one shouldn’t overlook a gold bubble in 2011 and the current debt bubble. And, as well, a bubble in student debt, along with soaring health care costs and unfunded pension liabilities. Add in a few manias like the meme bubbles; i.e. Game Stop.
And that is in just the U.S. Elsewhere, bubbles also dominated, especially Japan (1986–1990) and China (2005–2007), and China again with the property and credit bubble (2008–2022). The Chinese bubble and the Japanese bubble are very similar, given the that housing was at the heart of the bubble. Housing bubbles have also occurred in North America and the EU. Bubbles, bubbles, everywhere: stock markets, housing markets, commercial real estate markets, debt—we could go on.
We’ve never seen a bubble that didn’t eventually burst. A debt bubble translates into bankruptcies, whether it’s a country, a corporation, commercial real estate, or consumer real estate. The 2006 housing crisis saw the
collapse of the sub-prime mortgage market. It was the lower end of the market that was hurt the most. Today, numerous entities from countries to the consumer sit on the precipice of collapse because of excessive debt. Debt and banking crises are a constant of history. However, since the turn of the century they seem to be coming with rapidity.
And that has us wondering how can the authorities, both monetary (Fed) and fiscal (government), will deal with another crisis. During the 2008 financial crisis and the 2020 pandemic, it was bail-outs. Now legislation is in place for bail-ins. That means, in the event of a bank collapse, debt, including deposits, could be converted to equity.
Each crisis also resulted in a widening of inequality as the beneficiaries of Fed and government largesse primarily went to the well-off. Further, they were helped along by huge tax cuts, particularly in the U.S., that primarily benefitted the so-called 1%. Inequality grew and, with the growth in inequality, the divisions in society also grew between the left and the right and a host of others in between. As a result, we’ve seen the rise of extreme populism, offering simplistic solutions to complex problems. That in turn has heightened tensions between different sides.
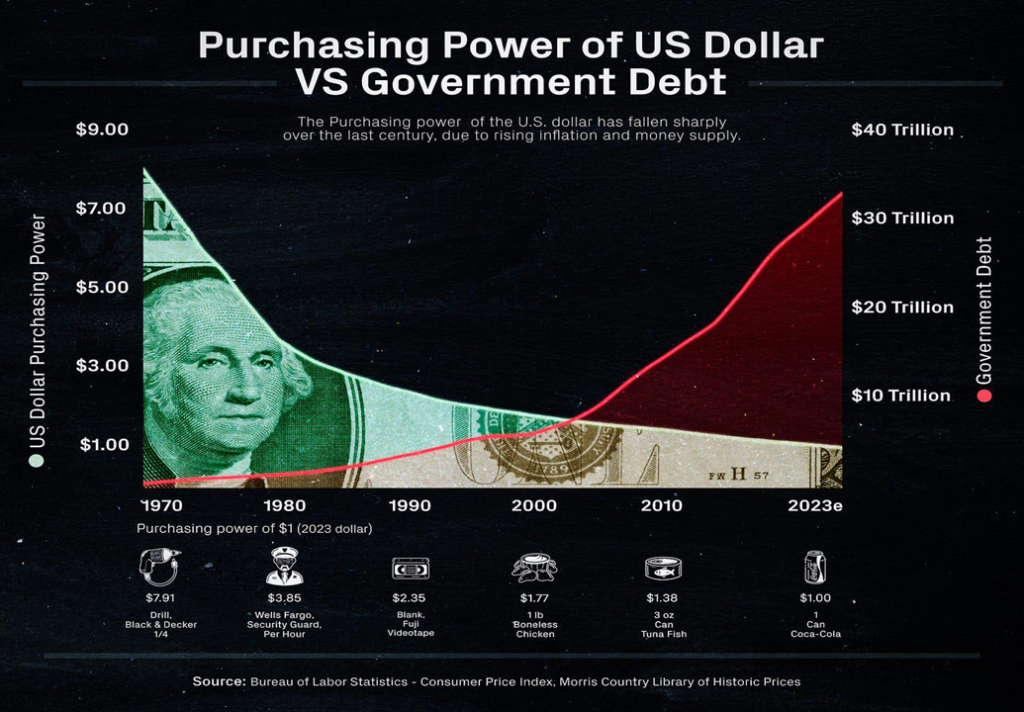
The word today is inflation and how it has eroded everything. Everyone is dealing with higher prices. But another way of looking at it is that it represents a loss of purchasing power. Ever since the creation of the Fed in 1913, the purchasing power of $1 has been falling. Today it is down over 99% from that period. But some of the biggest drop occurred after the end of Bretton Woods and the gold standard. Our chart below shows how the purchasing power of a $1 has fallen as the debt has soared. That can be applied to any developed country, not just the U.S.
Purchasing Power U.S. Dollar vs. U.S. Government Debt 1970–2023
It is not as if the bursting of bubbles is the only risk. The potential for devastating trade wars to break out is also very real. Tariffs placed on China during the Trump years were never reversed by the Biden administration. Sanctions, a different type of trade war, have only grown in the past number of years, with Russia and Iran being major targets. Nonetheless, they cause supply disruption and are ultimately inflationary. Sanctions also have a way of bouncing back against the country applying the sanctions. It also engenders smuggling and other methods to work around the sanctions.
But the potential for a new, devastating trade war is looming. Over the past half-century global tariffs had decreased, giving way to globalization on a scale the world had never seen before. The result saw millions pulled out of poverty. The World Trade Organization (WTO) was the glue that held it all together. But today the WTO is fracturing and the world is threatening to degenerate into the devastating trade wars that proliferated through the 1930s, contributing considerably to the Great Depression.
President Biden has announced that 100% tariffs will be put on Chinese electric vehicles (EVs). The complaint is China is heavily subsidizing its manufacturers. China has also been accused of dumping of steel and other products on markets as well. While trade liberalization does impact certain industries and workers, a rise in tariffs globally creates inefficient firms, which ultimately hurts consumers and workers and sparks inflation.
Import tariffs trigger price increases, resulting in inflation. They also raise costs, even if the manufacturing is brought onshore. Technology also exports jobs elsewhere, so it could be a zero-sum game. It acts like a tax that is just passed on to the consumer. Tariffs and retaliatory tariffs are ultimately destructive and contribute to a lose/lose situation.
If Trump prevails in the 2024 elections, he has already indicated he is more than willing to start a global trade war by putting tariffs on a host of products over several countries. In return, those countries will place tariffs on American goods and services and in a worst-case scenario American business in foreign countries, particularly China, could be seized.
Smoot and Hawley, the co-authors of the 1930 Tariff Act, appear to be alive and well today, threatening to start trade wars where nobody wins and everybody losses. It is economic warfare. The end result could be financial collapse as the bubbles burst and another Great Depression. And, if the past holds true, it eventually ends in a global war.
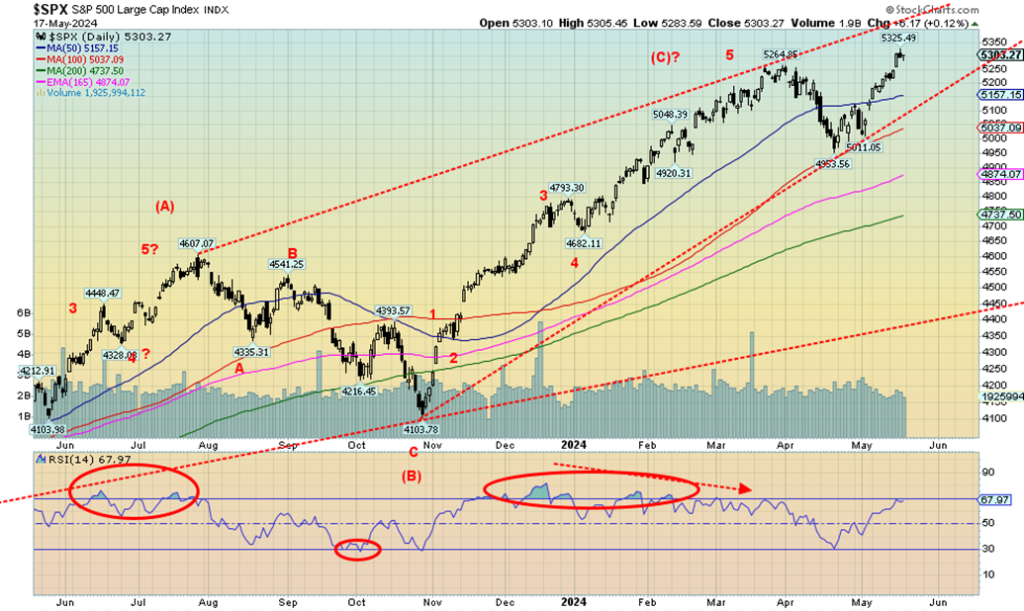
We mused earlier as to whether we would see new all-time highs on this upward wave. The jury is in and stock markets have made once again all-time highs. Not everyone, of course, but a quick review of North American stock markets notes that the S&P 500, the S&P 100, the Dow Jones Industrials (DJI), the NASDAQ, the NASDAQ 100, the New York Stock Exchange (NYSE), the Dow Jones Composite (DJC), the Dow Jones Utilities (DJU), the S&P 600 (Small), the Wilshire 5000 Index, the Russell 1000 and 3000, and the NY FANG Index all made new all-time highs this past week.
The most glaring non-confirmation was, once again, the Dow Jones Transportation (DJT) not making new all-time highs even as the DJI did. This has been ongoing since October 2021 when last the DJI and DJT made new highs together. This is a blatant divergence that has never ended well for markets—we just can’t say when that ending could happen.
This past week, the S&P 500 gained 1.5%, the DJI was up 1.2%, the DJT fell 0.6%, and the NASDAQ was up 2.1%. The S&P 400 (Mid) gained 0.7% while the S&P 600 (Small) gained 1.1%. The S&P 500 Equal Weight Index was up 1.1% but did not make all-time highs, diverging with the S&P 500. The NY FANG Index gained 2.5% as FAANG stocks rose once again. Both Google, up 4.1%, and Broadcom, up 4.7%, made all-time highs. The big gainer on the week was Alibaba, up 10.6%.
In Canada, both indices were up. The TSX Composite gained 0.7% while the TSX Venture Exchange (CDNX) was up 3.0%. The TSX was led by Metals & Mining TGM, up 4.9%, Materials TMT, up 3.6%, and Golds TGD, up 2.9%. All three indices made fresh 52-week highs, and all three look higher. In the EU, the London FTSE made all-time highs but fell slightly, down 0.2%.
The EuroNext also made all-time highs but ended the week flat. The Paris CAC 40 fell 0.6% while the German DAX fell 0.4% after making all-time highs. In Asia, China’s Shanghai Index (SSEC) was flat, the Tokyo Nikkei Dow gained 1.5%, while the star of the week was Hong Kong’s Hang Seng (HSI), up 4.0%. The MSCI World Index gained 1.9% to fresh 52-week highs.
Bond yields fell marginally this past week with the U.S. 10-year treasury note down to 4.42% from 4.50% while Canada’s 10-year Government of Canada bond (CGB) fell to 3.66% from 3.73%. The big story of the week was the inflation numbers, as PPI came in at 2.2% year over year (y-o-y) as expected, but the CPI came in at 3.4%, just below the expected 3.5%. Still, inflation remains stickily higher than where Fed wants it to be.
Other economic numbers saw retail sales falter, up 3% y-o-y, but they expected 3.8%. Weekly jobless claims were 222,000, just below the expected 225,000. The Philly Fed was 4.5 vs. the expected 4.0, but the NY Empire State Index was negative 15.6 vs. the expected negative 8.0. Industrial production fell 0.4% y-o-y when they expected a gain of 0.1%. The economy continues to show signs of slowing even as inflation remains sticky.
Oil prices gained slightly, up 1.7%, while natural gas (NG) soared, breaking out up 16.9% to $2.63. In the EU, at the Dutch Hub NG was up 3.1%. WTI oil needs to break through $80 and then $85/$87 to suggest we are going higher over $90. The energy stocks moved sideways with the ARCA Oil & Gas Index (XOI) down 0.1% while the TSX Energy Index (TEN) gained 0.1%.
It appears we are now headed for higher prices. With the DJI now hitting 40,000, we do expect some resistance here, but we have potential targets up around 44,000. The Fed, as we have often noted, is caught between a rock and hard place as to what to do. Inflation is still a problem; the economy is slowing and that spells stagflation.
Trade wars are starting (did they ever stop?), particularly between the U.S. and China, and that is inflationary. Interest payments on the debt are through the roof, but in a crisis the Fed can only print more money. Commercial real estate continues to tip over and could yet spark a crisis. Consumer sentiment is falling, but corporate profits remain robust thus helping keep the stock markets afloat. Europe is in a mild recession as is the U.K. and Japan.
Numerous banks are in trouble and more collapses are expected. There remains risk of a sovereign debt crisis. The U.S. is having trouble financing their debt. We note China’s holdings fell another $8 billion in March and are down over $100 billion in the past year. Q1 2024 saw China dump a record $53.5 billion of U.S. treasuries.
Apparently, Belgium, who has acted as a custodian for China dumped $22 billion of U.S. treasuries in Q1 as well. Other central banks have had to pick up the slack. As conflict between the U.S. and China heightens China is on a clear path to unload its holdings of U.S. treasuries. In place of them China has been buying gold.
4,950 remains the breakdown point for the S&P 500, but caution is advised under 5,150 and 5,050. Despite the rise to new highs, overbought signals are still small. All this suggests we could move higher still. However, it is difficult to chase this market. As long as problems remain over there and there is nothing that shakes the
confidence of the market (not even the upcoming November election at this time), the word is we are going higher. Even meme stocks leaped this past week once again.
Nonetheless, the breakdown points should be heeded. The risks are all around, but the market continues to shrug them off—until it doesn’t—or an accident happens. July/August has often been a period for important tops. Could we continue irregularly to then before the nasty season of September/October sets in?
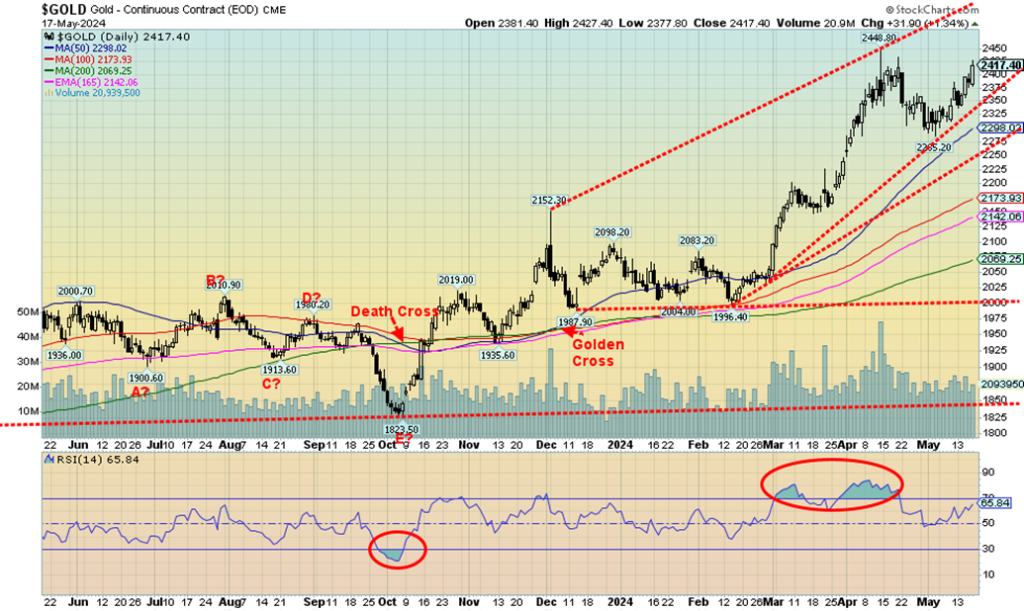
Both gold and silver finally broke through. Barriers at $2,400 and $30 respectively were finally breached on Friday, May 17. While gold still needs to close over $2,420 to suggest new highs over $2,449, the odds indicate that could occur early this coming week. After that, the next stop could be $2500 with even higher targets coming into focus. For silver, the breakthrough over $30 was far more than expected and the next targets are $39/$40. The mark had stood at $30.35 since February 2021. Silver closed the week at $31.26.
On the week, gold gained 1.8% while silver was up 9.7%, setting fresh 52-week highs. Platinum recovered nicely with an 8.2% gain, making 52-week highs. The near precious metals saw palladium gain about 3% while copper continued its recent strong run, up 8.4%, in turn making an all-time high closing over $5. Copper prices still look higher, although copper, like silver, is now in overbought territory. This doesn’t mean they can’t go higher, but a pullback/consolidation could occur any time. Gold is not yet in overbought territory.
The gold stocks joined the party as the Gold Bugs Index (HUI) gained 4.9% while the TSX Gold Index (TGD) was up 2.9%. Both indices made 52-week highs. We saw a number of individual stocks also make 52-week highs. And, for the first time in a while, junior exploration gold miners that trade primarily on the CDNX or on the Canadian Securities Exchange (CSE) put in a good week. Gains of 10% or more on Friday May 17 on selected junior exploration stocks were not unusual.
If you are a gold bug, you had a great week. Geopolitical concerns, domestic political concerns, and evidence of stagflation setting in were the principal drivers. Geopolitical as Russia advances on Ukraine and Israel advances on Rafah, despite international outcries. Domestic political concerns as the conflict between supporters of Trump vs. Biden intensifies, along with clashes on the streets between pro-Palestine supporters and pro-Israel supporters and threats of violence against the judge and others in the Trump hush-money trial.
Stagflation as inflation remains stickily high while there are growing signs of a slowing economy. These events could remain top of mind as we go forward. A sliding US$ Index also helps as the US$ Index fell 0.8% this past week. The strongest currency was the pound sterling, up 1.4%, while the euro gained 0.9%. Despite their gains against the US$, both fell against gold. In Cdn$ terms, gold is just under $3,300. Gold in Cdn$ terms is up 20% in 2024 vs. 16.7% in US$ terms.
Gold continues in fresh territory. As noted, over $2,420 new highs are probable. Targets for gold range from $2,500 to as high as $2,800. Support is now seen at $2,300, $2,200, and $2,100. Only below $2,100 would we consider the gold rally officially over. Silver has resistance at $35/$36, then again at $39/$40. Above $41 new highs above $50 are probable. Silver would have to exceed $150 to take out the 1980 high on an inflation-adjusted basis. To take out the 2011 high on an inflation-adjusted basis, silver would have to hit over $70. For gold, it is over $2,700 when it would take out the 1980 inflation-adjusted high.
Gold is proving its role of maintaining purchasing power during periods of economic and political uncertainty and social upheaval. Gold was the mainstay of the international monetary system during the 19th century. Following periods of interruption in World War I, a gold standard once again came back into use. The Great Depression and World War II once again disrupted gold as a standard, but Bretton Woods 1944 reestablished the gold standard. That ended in August 1971, and since then the world has been dominated by fiat currencies. The result has seen an explosion of money and debt and loss of purchasing power. There has never been a period of fiat currencies that didn’t end in collapse.
Over the next two weeks, the expectation is that both gold and silver could rise further with periods of pullbacks or backing and filling. The trend is solidly to the upside. The gold stocks are also finally starting to break out as well and the junior miners’ market is showing life, after a long dormant period.
Markets & Trends
| % Gains (Losses) Trends | ||||||||
| Close Dec 31/23 | Close May 17, 2024 | Week | YTD | Daily (Short Term) | Weekly (Intermediate) | Monthly (Long Term) | ||
| Stock Market Indices | ||||||||
| S&P 500 | 4,769.83 | 5,303.27 (new highs)* | 1.5% | 11.2% | up | up | up | |
| Dow Jones Industrials | 37,689.54 | 40,003.59 (new highs)* | 1.2% | 6.1% | up | up | up | |
| Dow Jones Transport | 15,898.85 | 15,501.43 | (0.6)% | (2.5)% | neutral | neutral | up | |
| NASDAQ | 15,011.35 | 16,685.97 (new highs)* | 1.1% | 8.9% | up | up | up | |
| S&P/TSX Composite | 20,958.54 | 22,465.37 | 0.7% | 7.2% | up | up | up | |
| S&P/TSX Venture (CDNX) | 552.90 | 615.17 | 3.0% | 11.3% | up | up | down | |
| S&P 600 (small) | 1,318.26 | 1,338.69 (new highs)* | 1.1% | 1.6% | up | up | up | |
| MSCI World | 2,260.96 | 2,395.30 (new highs) | 1.9% | 5.9% | up | up | up | |
| Bitcoin | 41,987.29 | 66,928.42 | 10.4% | 59.4% | up | up | up | |
| Gold Mining Stock Indices | ||||||||
| Gold Bugs Index (HUI) | 243.31 | 286.85 (new highs) | 4.9% | 17.9% | up | up | up | |
| TSX Gold Index (TGD) | 284.56 | 335.39 (new highs) | 2.9% | 17.9% | up | up | up | |
| % | ||||||||
| U.S. 10-Year Treasury Bond yield | 3.87% | 4.42% | (1.8)% | 14.2% | ||||
| Cdn. 10-Year Bond CGB yield | 3.11% | 3.66% | (1.9)% | 17.7% | ||||
| Recession Watch Spreads | ||||||||
| U.S. 2-year 10-year Treasury spread | (0.38)% | (0.42)% | (10.5)% | (10.5)% | ||||
| Cdn 2-year 10-year CGB spread | (0.78)% | (0.61)% | 21.8% | (1.7)% | ||||
| Currencies | ||||||||
| US$ Index | 101.03 | 104.48 | (0.8)% | 3.4% | down (weak) | up (weak) | up | |
| Canadian $ | 75.60 | 73.52 | 0.5% | (2.8)% | up (weak) | down (weak) | down | |
| Euro | 110.36 | 108.69 | 0.9% | (1.9)% | up | up (weak) | down (weak) | |
| Swiss Franc | 118.84 | 109.99 | (0.3)% | (7.5)% | neutral | down | neutral | |
| British Pound | 127.31 | 127.02 | 1.4% | (0.2)% | up | up (weak) | neutral | |
| Japanese Yen | 70.91 | 64.24 | 0.1% | (9.4)% | down | down | down | |
| Precious Metals | ||||||||
| Gold | 2,071.80 | 2,4717.40 | 1.8% | 16.7% | up | up | up | |
| Silver | 24.09 | 31.26 (new highs) | 9.7% | 29.8% | up | up | up | |
| Platinum | 1,023.20 | 1,090.00 (new highs) | 8.2% | 6.5% | up | up | up (weak) | |
| Base Metals | ||||||||
| Palladium | 1,140.20 | 1,010.80 | 3.0% | (11.4)% | neutral | down | down | |
| Copper | 3.89 | 5.05 (new highs)* | 8.4% | 29.2% | up | up | up | |
| Energy | ||||||||
| WTI Oil | 71.70 | 79.58 | 1.7% | 10.9% | down | neutral | neutral | |
| Nat Gas | 2.56 | 2.63 | 16.9% | 2.7% | up | neutral | down | |
__
(Featured image by Jakub Żerdzicki via Unsplash)
DISCLAIMER: This article was written by a third party contributor and does not reflect the opinion of Born2Invest, its management, staff or its associates. Please review our disclaimer for more information.
This article may include forward-looking statements. These forward-looking statements generally are identified by the words “believe,” “project,” “estimate,” “become,” “plan,” “will,” and similar expressions. These forward-looking statements involve known and unknown risks as well as uncertainties, including those discussed in the following cautionary statements and elsewhere in this article and on this site. Although the Company may believe that its expectations are based on reasonable assumptions, the actual results that the Company may achieve may differ materially from any forward-looking statements, which reflect the opinions of the management of the Company only as of the date hereof. Additionally, please make sure to read these important disclosures.
Copyright David Chapman 2024
David Chapman is not a registered advisory service and is not an exempt market dealer (EMD) nor a licensed financial advisor. He does not and cannot give individualised market advice. David Chapman has worked in the financial industry for over 40 years including large financial corporations, banks, and investment dealers. The information in this newsletter is intended only for informational and educational purposes. It should not be construed as an offer, a solicitation of an offer or sale of any security. Every effort is made to provide accurate and complete information. However, we cannot guarantee that there will be no errors. We make no claims, promises or guarantees about the accuracy, completeness, or adequacy of the contents of this commentary and expressly disclaim liability for errors and omissions in the contents of this commentary.
David Chapman will always use his best efforts to ensure the accuracy and timeliness of all information. The reader assumes all risk when trading in securities and David Chapman advises consulting a licensed professional financial advisor or portfolio manager such as Enriched Investing Incorporated before proceeding with any trade or idea presented in this newsletter. David Chapman may own shares in companies mentioned in this newsletter. Before making an investment, prospective investors should review each security’s offering documents which summarize the objectives, fees, expenses and associated risks. David Chapman shares his ideas and opinions for informational and educational purposes only and expects the reader to perform due diligence before considering a position in any security. That includes consulting with your own licensed professional financial advisor such as Enriched Investing Incorporated. Performance is not guaranteed, values change frequently, and past performance may not be repeated.


Ecobnb Turns Sustainable Tourism Into Measurable Impact
Ecobnb’s sustainable tourism platform generated significant environmental and social impact in 2025, avoiding 58,207 kg of CO₂ and adding 583...


Sugar Markets Balance Biofuel Demand and Global Supply
Sugar markets in New York and London were mostly unchanged as the Iran conflict renewed interest in biofuels. Drought concerns...


The $40 Trillion Trap: Disinflation Is Not Deliverance
U.S. debt has reached $40 trillion, with $24 billion weekly interest, while deficits accelerate. Despite disinflation in CPI, from cooling...


FinTech Matures as AI and Infrastructure Drive the Next Growth Phase
Fintech markets are entering a mature phase, shifting from rapid growth to consolidation, specialization, and sustainable business models. Zurich and...


Bitcoin, and Ethereum Rise, While Cardano Enters Transition
Bitcoin and Ethereum posted modest weekend gains, supported by ETF inflows. A new proposal may protect Bitcoin from quantum threats....
 |
|
 |  |
 |
|
-

 Africa1 week ago
Morocco Cuts Card Fees to Spur Digital Payments, but Uncertainty Remains
-

 Markets2 weeks ago
Rice Prices Rise as Supply Outlook Tightens and Demand Stays Mixed
-

 Cannabis5 days ago
Virginia Cannabis Market Could Reshape Regional Competition
-

 Biotech2 weeks ago
BIP Sells BIC Incubator to Innova, Refocuses on Core Innovation Areas