Featured
When Will the Dow Jones Resume Going Up Again?
At this week’s close, everyone is talking about Thursday’s miracle turnaround. For myself, I’m thinking Monday wasn’t all that far from September 30th bear market low, so far, the deepest market decline since this bear-market decline began on January 5th of this year. That is ten months of the Dow Jones going down. When will that stop, and the Dow Jones once again resume going up?

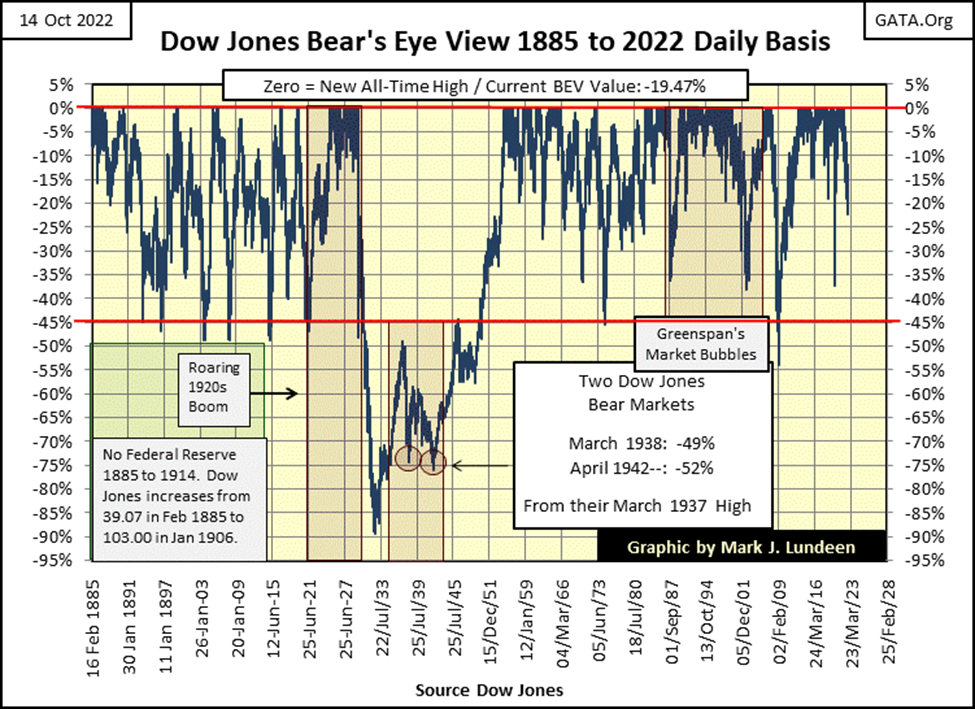
Here’s a Dow Jones BEV chart going back to 1885. A Bear’s Eye View (BEV) chart displays the Dow Jones in terms of new all-time highs (0.0% / BEV Zero) and percentage claw-backs on those days the Dow Jones came short of making a new all-time high, all the way down to the 89% claw-back seen in July 1932 during the Great Depression.
The Bear’s Eye View allows us to directly compare any bull or bear market, to any other bull or bear market seen in the Dow Jones for the past 137 years. We compare bull markets by seeing how often the Dow Jones was making new all-time highs; 0.0% or BEV Zeros. We compare bear markets by seeing how low the BEV plot goes, a BEV -40% is a bear market decline of 40%.
This week the Dow Jones closed with a BEV of -19.47%, or 19.47% from its last all-time high from last January 4th. Up a bit from its BEV of -21.94% (this bear market low, so far) seen on September 30th. Up to now in this bear market (and yes, the stock market is in a bear market), the Dow Jones hasn’t approached the BEV -38% seen during the March 2020 flash crash, remaining far above the BEV -54% at the March 2009 bottom of the Sub-Prime Mortgage bear market.
Maybe it will stay that way until the Dow Jones once again begins making new BEV Zeros / on the 0.0% red line seen below. But I’m not holding my breath until it does.
Let’s look at the past 137 years of Dow Jones history displayed in the BEV chart above, via the frequency table below. What does a frequency table show? One thing is how many daily new all-time highs the Dow Jones has seen since February 1885: exactly 1514, or 4% of the 37,810 daily NYSE trading sessions of the past 137 years, closed at new all-time highs.
The -0.000001% row are the daily closes in “scoring position”, those daily closings just short of being a new BEV Zero, down to a BEV of -4.99% (less than 5% from their BEV Zero). These two rows are where bull markets work their magic; where they are either making new all-time highs, or closing just short of being one, waiting for the next trading day for making yet one more BEV Zero /0.0%.
Since February 1885, one might say the Dow Jones has been in a bull market during the 26.96% trading days seen in the top two rows in the freq table below. Or in a bull market in one out of every four trading days of its 137-year history. That’s really remarkable.
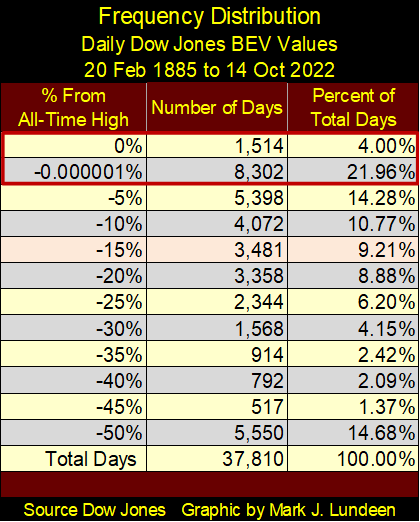
This week’s BEV of -19.47 places it in the -15% row above. Some of these 3481 daily closes happened in both bull and bear markets. A bull market where the BEV plot seen above was rising from a lower percentage BEV value, on its way to a new BEV Zero. And a bear market where the BEV plot seen above was deflating from a BEV Zero, down to a lower percentage BEV value. This is exactly what has been happening since the Dow Jones’ last BEV Zero (January 4th).
At this week’s close, everyone is talking about Thursday’s miracle turnaround. For myself, I’m thinking Monday wasn’t all that far from September 30th bear market low, so far, the deepest market decline since this bear-market decline began on January 5th of this year. That is ten months of the Dow Jones going down. When will that stop, and the Dow Jones once again resume going up?
Are you wondering that too? That isn’t a question people ask at bear market bottoms. No, at bear market bottoms investors are so traumatized by Mr Bear’s trampling their positions, the only questions on most people minds are how dumb could I’ve been, and when is the pain going to stop. At big-bear market bottoms, former investors no longer believe the market will ever advance again.
It will, but at big-bear market bottoms, you may not believe it will either. So, if you do find the courage to buy at the bottom, and it will take courage, don’t expect your friends and family to congratulate you on your astute market maneuver of buying at the bottom.
As seen in the daily bar chart below, since January the path taken by the Dow Jones hasn’t been straight down. From June to August, it saw a nice advance. But since then, the Dow Jones once again began losing steam, and in late September broke below the lows of June; a fact the bulls should keep in mind.
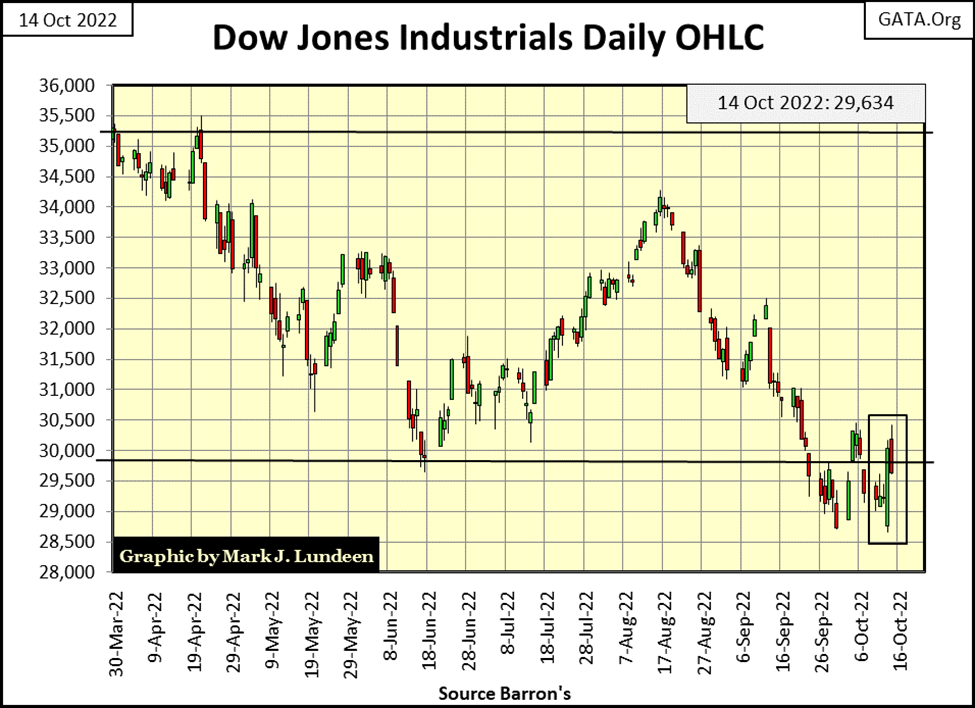
Here is how I’m looking at the daily bar chart above; note Thursday’s huge move-up. It closed above the lows of last June, but Friday failed to close above those lows. In fact, in the past three trading weeks, the Dow Jones has closed above the lows of last June in only four of its past fifteen trading days. Unless we see some remarkable strength in the coming weeks, I expect the next big move for the Dow Jones will be down.
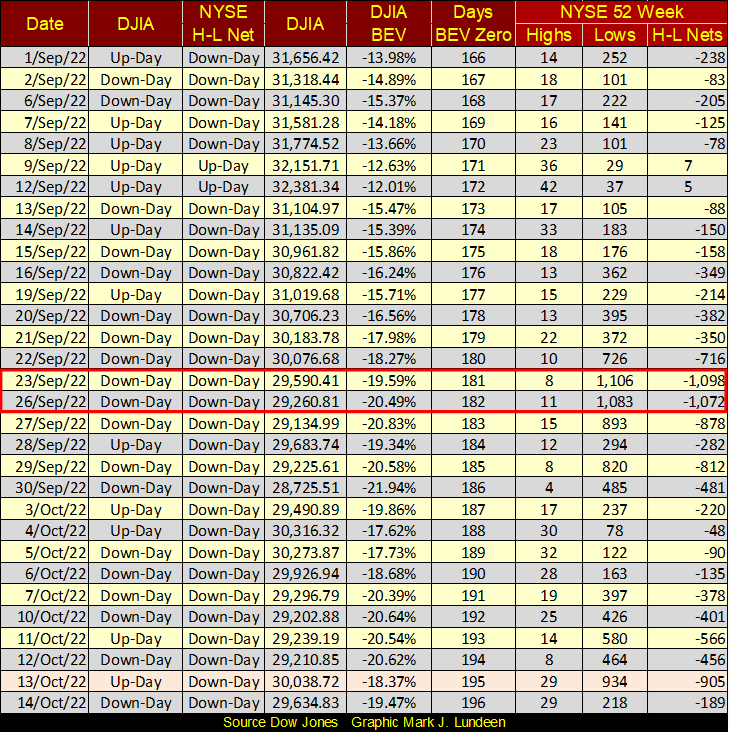
This is something interesting to note; though Thursday was a big move up in the Dow Jones, over at the NYSE, its 52Wk H-L Net was a -905. A huge number of new 52Wk Lows at the NYSE for a day the Dow Jones saw a huge advance.
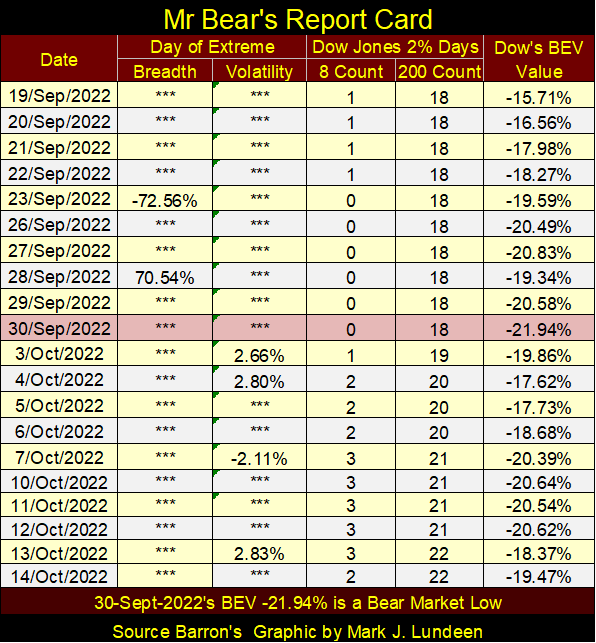
And Mr Bear’s Report Card below remains bearish. So far in October, we’ve seen four Dow Jones 2% days, days of extreme volatility where the Dow Jones has moved (+/-) 2%, or more from its previous day’s closing price. As far as this being a bull market, the report card below is a failing grade.
Still, the stock market could be making a bottom here. That would be nice, but not likely. The big factor that would argue against that is the amount of debt the financial system is carrying, debt whose principal and interest our shrinking economy must service.
Back in the 1970s, interest rates were over 15%, and most people and even companies didn’t mind that much, as they had more money deposited in the bank, than they owed to the bank. So, 15% interest rates in 1979 may have helped many parents pay for Christmas, while for others it helped them send their kids to college.
In 2022, few people have any significant sums of money deposited in the bank. What banks do today is loan money out to people, lots of money. Seeing interest rates today at even 8% may be ruinous to many people, as they are having difficulties servicing their debts while rates are at 5%.
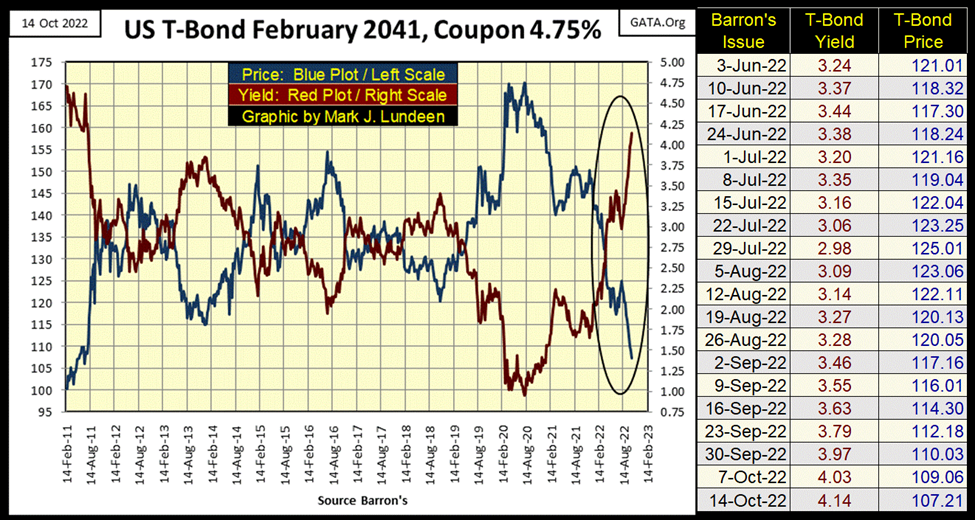
Keeping this in mind, let’s look at some bond charts. The T-bond below was issued as a 30yr bond in February 2011, so now in 2022 it is actually a 19yr bond, but we’ll call it a 20yr bond.
It’s remarkable how since January, this bond, and the bond market as a whole has plunged into a bear market. This week the Dow Jones closed down -19.47% from its January highs. Now, look at this turkey, a flightless T-bond whose valuation (Blue Plot) is down about 29% from its highs of last January.
They sell these to widows and orphans, as they tell them that isn’t going to happen with US Government T-bonds – yet there it is. This bond from its August 2020 highs at week’s close is down 37%.
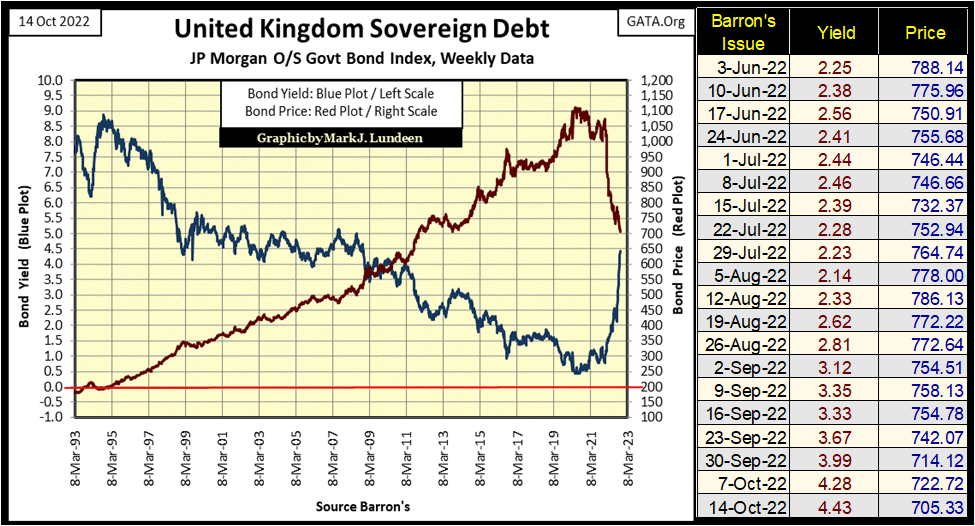
Here’s a chart for the United Kingdom’s sovereign bond. John Bull’s IOUs below are melting down like Uncle Sam’s are above. Down around 35% (Red Plot) from its bull market highs.
Barron’s Best & Intermediate Grade Corporate Bond Yields continue rising (bond prices continue deflating). How anyone could be bullish on the stock market while seeing corporate bond yields doing this since January is beyond me.
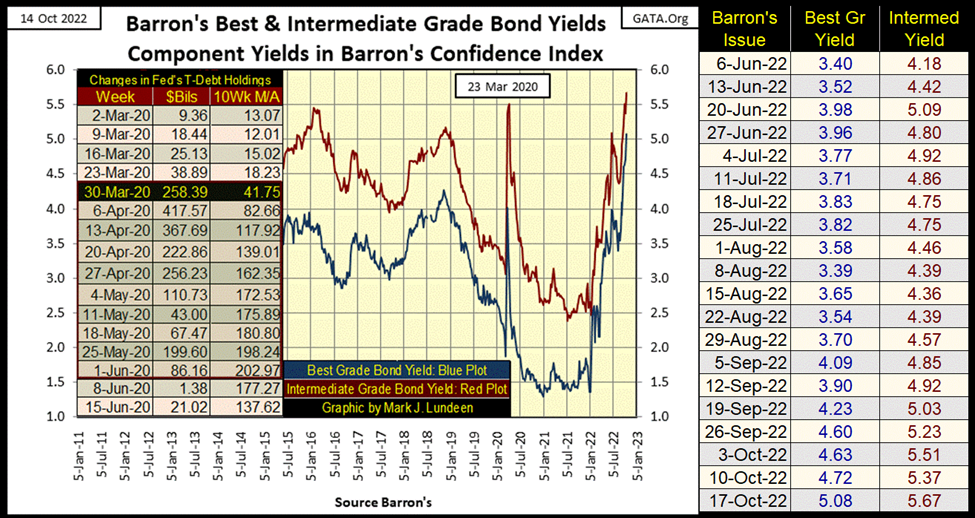
I look at the news feed for business and the economy; I see little, if anything on the bear market in bonds. Here is the price for the Dow Jones Corporate Bond Index, and since last January, corporate bonds have done little but go down.
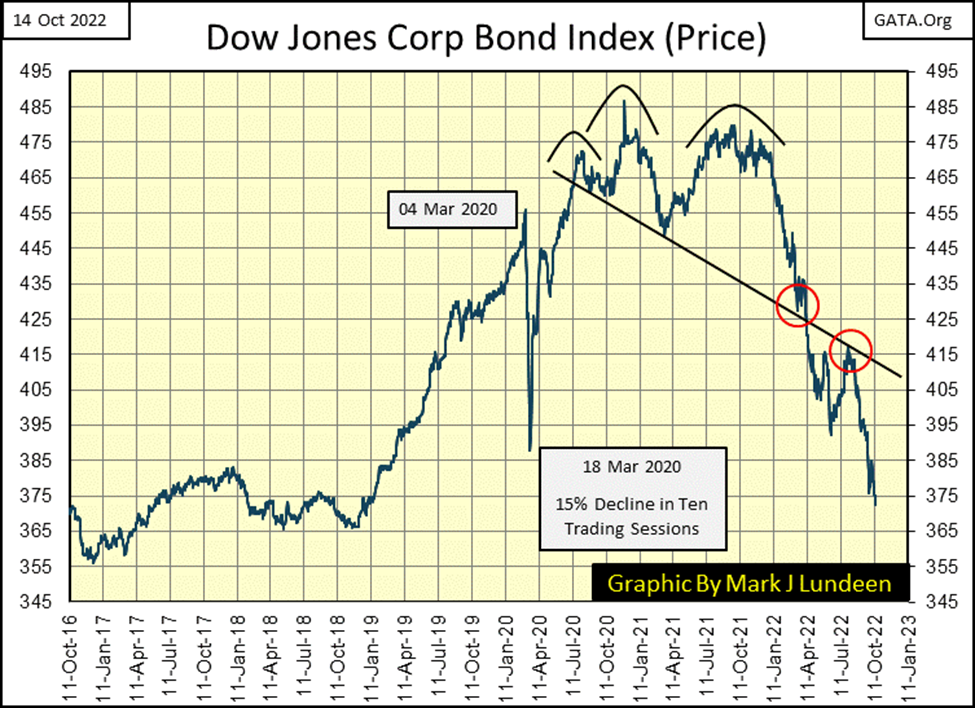
But at some point, that is going to change. As this trend in rising corporate bond yields is ultimately going to lead some well-known companies now trading in the stock market into bankruptcy.
Why? Because during the good times following the sub-prime mortgage bear market, March 2009 bottom, all too many American corporations took full advantage of the cheap money flowing from the Federal Reserve. Corporate officers would have felt foolish not to have. So, they loaded up their companies’ balance sheets with massive amounts of consumptive debt to fund their stock buyback and dividend programs.
There was a time when corporations would have used profits from their operations to fund these programs. The thought of using debt to buy back shares and fund dividend payouts was once shocking. But not in the 21st Century. At the time, the mainstream financial media praised these corporations for it, as this act of stupidity “stabilized” the stock market.
Well, that was then when they borrowed the money, but this is now when they have to pay it back. But they can’t, because the money used on share buyback and dividend programs don’t provide for a return on capital spent. So, they’ll attempt to roll over this debt by issuing more bonds but look at the new rates these bonds will have to offer. Wait until these yields go double-digit.
Some people may find it offensive that I call members of the FOMC idiot savants, or just plain idiots. But those are the idiots who made all this idiocy possible. Plus, the idiots sitting on the corporate boards of the big American corporations, who took full “advantage” of the cheap money flowing from the FOMC.
Then let’s not forget the idiots in academia who taught all the idiots above how to manage a business, the economy, and the world! Let’s give the idiot government regulators their due too; for doing what? Nothing good, unless one is listening to an idiot in the mainstream financial media.
I’m sure the idiots at the very top, those in the inner circle of the Davos clique know exactly what they are doing, and do, what they do because they are just bad people. But for most people, none of the above has directly affected them – yet. So, I saved my chart on mortgage rates for single family homes for last.
As seen in the table, with the increase in mortgage rates from their market bottom (2.65% seen in January 2021) to this week’s close 6.92%, the amount of principal a $1000 a month payment would qualify for has been greatly reduced. Down over 30%. Rising mortgage rates are starving the residential real estate market of funds, which is massively deflationary for home prices.
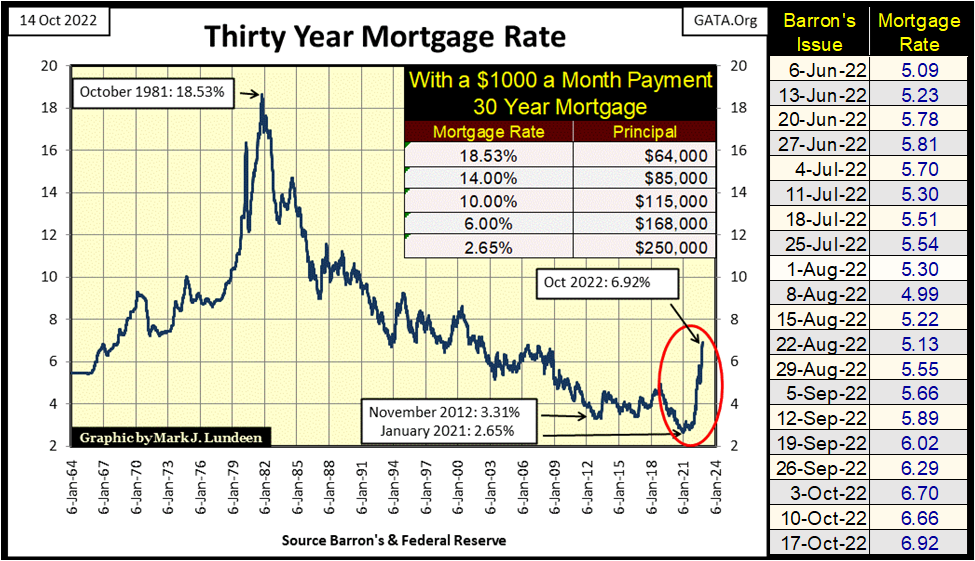
Come to think of it, I haven’t heard much about a bear market in real estate either in the mainstream financial media. But that is something I’m sure will change, should mortgage rates seen above continue to rise – and they will.
Let’s next look at the Bear’s Eye View chart for gold. It closed the week with a BEV of -20.29%. Which was not as good as the Dow Jones at this week’s close, but far better than any bond trading in the market.
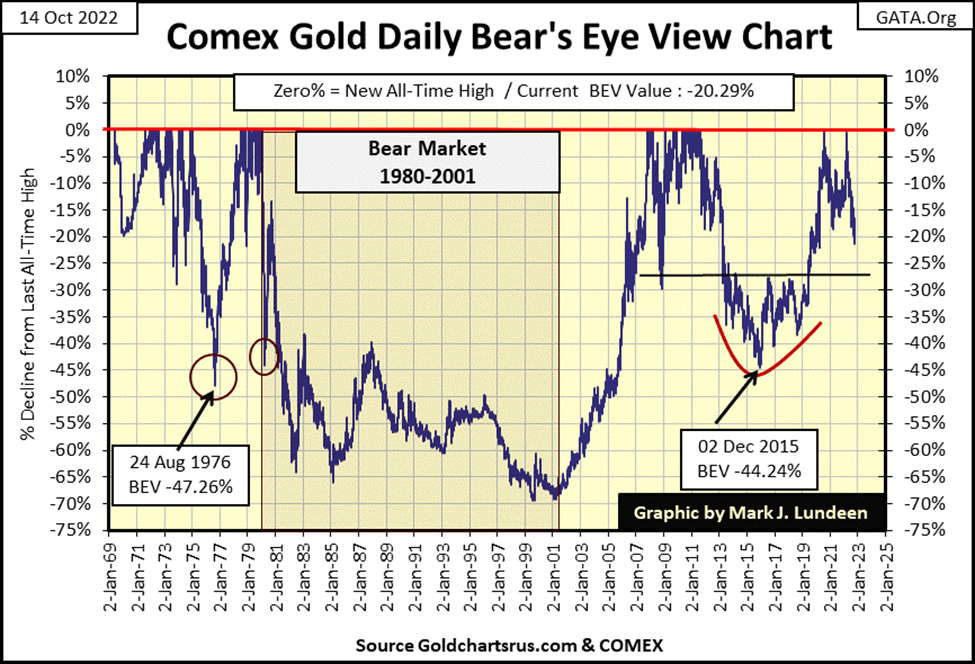
The thing to focus on in the chart above is the black line at gold’s -27.5% BEV level. In dollar terms: $1495 based on gold’s last all-time high from August 2020: $2061. In gold’s BEV chart above, this has been an important line of support and resistance since March 2009, a level the COMEX goons would love to see gold fall below once again.
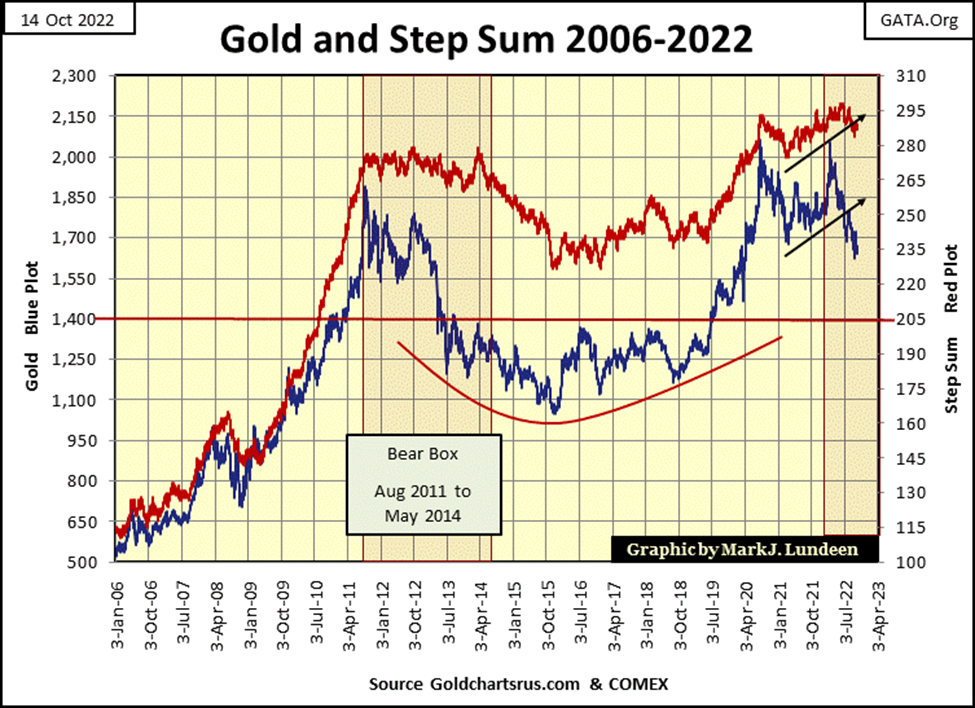
In gold’s step sum chart below, the bear box remains operative. Meaning the price of gold continues declining as its step sum plot refuses to follow the price of gold down. If this bear box continues to go as most bear boxes have in the past, it’s a promise for lower gold prices in the weeks and months to come.
Still, in our world of uncertainty, gold (and silver) is something you want to own. If you have any, I wouldn’t sell it unless you needed the money.
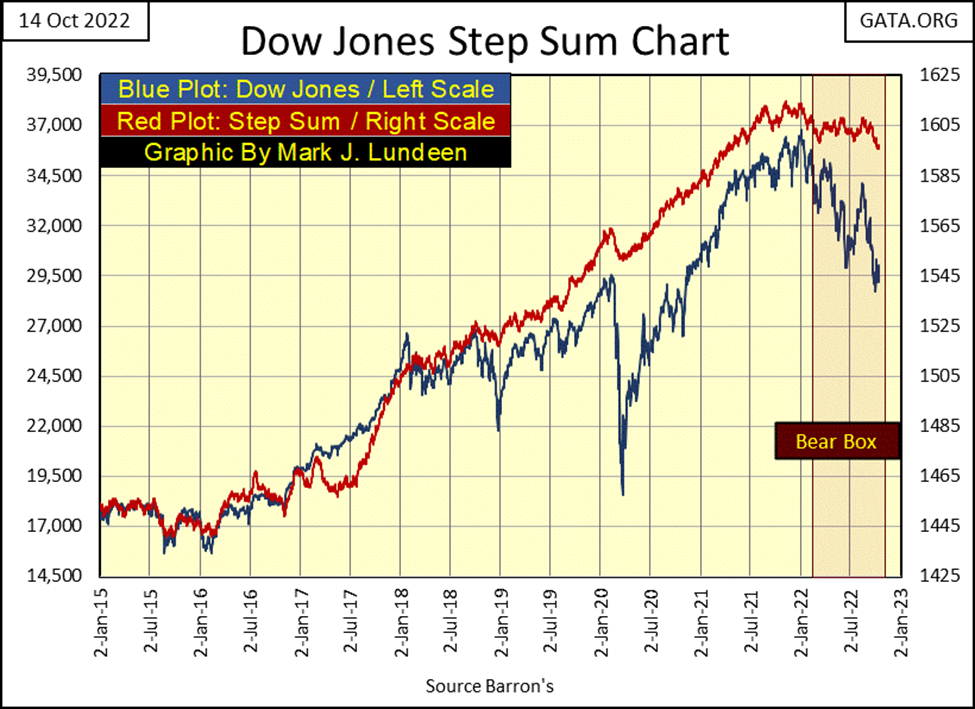
Looking at the bear box in the Dow Jones’ step sum chart below, the step sum plot may have begun breaking down towards its price plot. It’s not visually obvious in the chart below. But looking at the step sum table for the Dow Jones, its step sum plot is beginning to go down.
This new development isn’t a promise for the end of the current bear market, but its good to see as it’s an indication the bear market is moving on.
Let’s go on to gold’s step sum table below. Its step sum closed this week at 287, down by two daily down days since September 12th. This isn’t what a collapsing step sum in a bear box looks like.
Gold’s 15-count is a neutral +1, so gold isn’t oversold or bought. Also, gold’s daily volatility’s 200D M/A ticked up to 0.73% this week. That is good, as a bull market in gold is an exciting market, a market with rising volatility. Though a 0.73% value for this indicator isn’t exciting, but the rising trend is going in the right direction.
Looking at the Dow Jones side of the step sum table, its step sum lost a full ten steps since September 12th, that is a lot of steps! Reason to believe the bear box for the Dow Jones seen in the chart above is coming to an end. Should the Dow Jones continue deflating in the weeks to come, I expect its step sum will follow the price plot down. That is something it has refused to do since last January.
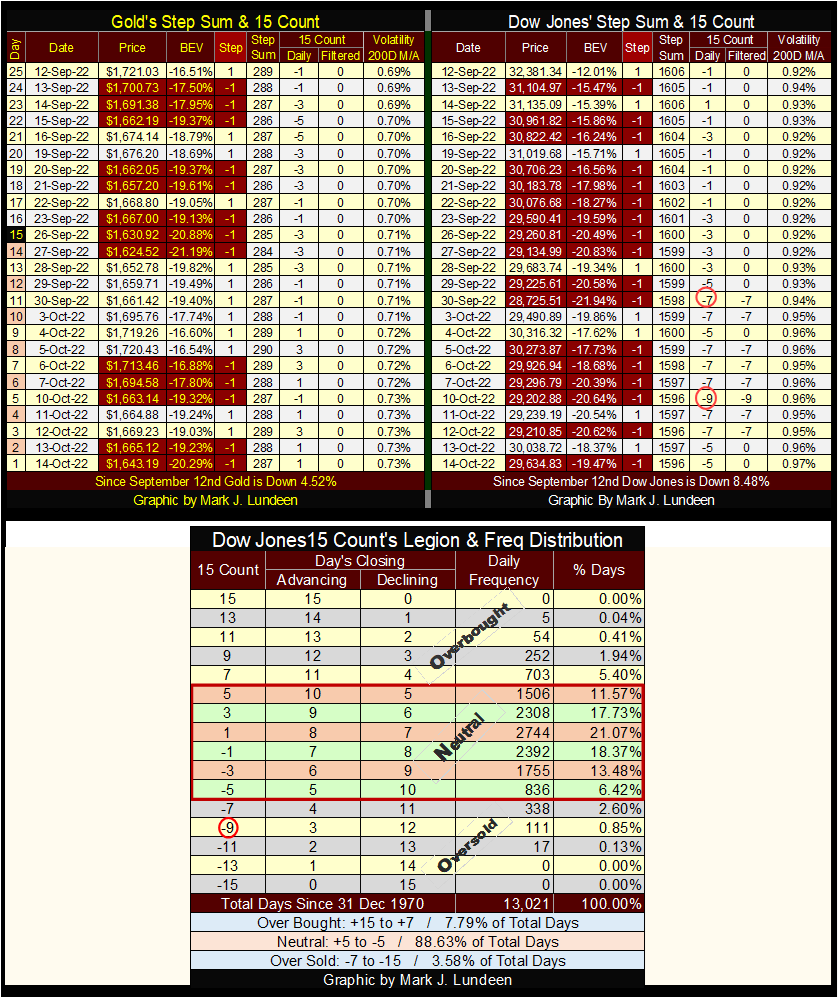
Also, the Dow Jones this week saw a 15-count of -9, making the Dow Jones very oversold. How oversold is a -9, 15-count? Looking at the freq table above, since 31 December 1970, the Dow Jones closed with a -9, 15-count on only 111 daily closes in the past fifty-two years.
Markets don’t like being very oversold. So, this means we should be due for a relief rally in the Dow Jones. But it’s a bear market. Not a time to anticipate good things to come for the bulls.
__
(Featured image by Tech Daily via Unsplash)
This article may include forward-looking statements. These forward-looking statements generally are identified by the words “believe,” “project,” “estimate,” “become,” “plan,” “will,” and similar expressions. These forward-looking statements involve known and unknown risks as well as uncertainties, including those discussed in the following cautionary statements and elsewhere in this article and on this site. Although the Company may believe that its expectations are based on reasonable assumptions, the actual results that the Company may achieve may differ materially from any forward-looking statements, which reflect the opinions of the management of the Company only as of the date hereof. Additionally, please make sure to read these important disclosures.


Virginia Cannabis Market Could Reshape Regional Competition
Virginia’s planned recreational cannabis market could reshape the Washington region’s economic landscape. With nine million residents, it may draw consumers...


Bitcoin’s Price Drops as Investors Turn to Layer 2 Solutions
Bitcoin fell toward $63,000 after leveraged liquidations erased recent gains, while geopolitical tensions between the US and Iran pressured risk...


Emily.AI: Personalized Oxygen Therapy Earns Global AI Recognition
Emily.AI, Quirónsalud’s explainable AI medical device, became a global finalist at the AI for Good Summit 2026 after competing with...


Advanced Blockchain Under Pressure Amid Crypto Market Shifts
The crypto market shows diverging trends: Advanced Blockchain faces heavy pressure despite restructuring, weak finances, and ongoing transformation, though analysts...


Cannabis Regulation in Germany and Switzerland Shows Early Benefits of Legalization Models
Germany and Switzerland’s cannabis reforms suggest regulated access can reduce criminalization without increasing consumption. Germany saw fewer cannabis-related prosecutions, while...
 |
|
 |  |
 |
|
-

 Crypto1 week ago
Crypto Platforms Expand Stock Perpetual Trading
-

 Crypto7 days ago
SpaceX Bitcoin Move Sparks Debate Amid Market Uncertainty
-

 Impact Investing2 weeks ago
ReLife Recycling Acquires Palcart Recycling Operations in Verona
-

 Crypto3 days ago
Bitcoin Rally Faces Tests from Fed, ETFs, and Market Fear